
 Login Sign Up


| |||||
 |  | ||||

| 12Stocks.com Market Intelligence |
Best Financial Stocks
| In a hurry? Financial Stocks Lists: Performance Trends Table, Stock Charts
Sort Financial stocks: Daily, Weekly, Year-to-Date, Market Cap & Trends. Filter Financial stocks list by size:All Financial Large Mid-Range Small & MicroCap |
| 12Stocks.com Financial Stocks Performances & Trends Daily | |||||||||
|
|  The overall Smart Investing & Trading Score is 33 (0-bearish to 100-bullish) which puts Financial sector in short term bearish to neutral trend. The Smart Investing & Trading Score from previous trading session is 26 and hence an improvement of trend.
| ||||||||
Here are the Smart Investing & Trading Scores of the most requested Financial stocks at 12Stocks.com (click stock name for detailed review):
|


| 12Stocks.com: Investing in Financial sector with Stocks | |
|
The following table helps investors and traders sort through current performance and trends (as measured by Smart Investing & Trading Score) of various
stocks in the Financial sector. Quick View: Move mouse or cursor over stock symbol (ticker) to view short-term Technical chart and over stock name to view long term chart. Click on  to add stock symbol to your watchlist and to add stock symbol to your watchlist and  to view watchlist. Click on any ticker or stock name for detailed market intelligence report for that stock. to view watchlist. Click on any ticker or stock name for detailed market intelligence report for that stock. |
12Stocks.com Performance of Stocks in Financial Sector
| Ticker | Stock Name | Watchlist | Category | Recent Price | Smart Investing & Trading Score | Change % | YTD Change% |
| MCY | Mercury General |   | Insurance | 71.69 | 100 | 5.36% | 8.47% |
| V | Visa | | Credit Services | 342.15 | 0 | 0.83% | 8.44% |
| AGNC | AGNC | | Mortgage | 9.63 | 88 | 1.58% | 8.42% |
| PIPR | Piper Sandler | | Asset Mgmt | 320.98 | 95 | 3.01% | 8.41% |
| SBRA | Sabra Health | | REIT | 18.41 | 73 | 0.66% | 8.24% |
| RF | Regions | | Regional Banks | 25.18 | 43 | 1.17% | 8.20% |
| TCBX | Third Coast | | Banks - Regional | 36.73 | 51 | 1.05% | 8.19% |
| AIG | American | | Insurance | 78.29 | 32 | 1.68% | 8.06% |
| TRTX | TPG RE | | Mortgage | 8.92 | 100 | 2.88% | 8.04% |
| RJF | Raymond James | | Brokerage | 166.48 | 70 | 2.12% | 7.91% |
| HMN | Horace Mann | | Insurance | 41.90 | 64 | 1.53% | 7.70% |
| ADC | Agree Realty | | Property Mgmt | 75.05 | 77 | 1.79% | 7.62% |
| UHT | Universal Health | | REIT | 39.22 | 37 | 1.61% | 7.34% |
| ARES | Ares Management | | Asset Mgmt | 188.55 | 88 | 3.13% | 7.34% |
| BNL | Broadstone Net | | REIT | 16.72 | 100 | 3.02% | 7.26% |
| PFBC | Preferred Bank | | Regional Banks | 90.86 | 54 | 2.01% | 7.22% |
| ORI | Old Republic | | Insurance | 36.35 | 35 | 1.23% | 7.18% |
| SEIC | SEI s | | Asset Mgmt | 88.34 | 51 | 2.19% | 7.10% |
| OHI | Omega Healthcare | | REIT | 39.79 | 100 | -0.40% | 7.02% |
| ENVA | Enova | | Credit Services | 102.60 | 36 | 2.03% | 7.01% |
| NNN | National Retail | | REIT - | 43.05 | 93 | 2.45% | 6.95% |
| PVBC | Provident Bancorp | | Banks | 12.19 | 43 | 0.41% | 6.93% |
| SYF | Synchrony | | Credit Services | 69.25 | 53 | 2.55% | 6.93% |
| CCBG | Capital City | | Regional Banks | 38.92 | 36 | 1.09% | 6.90% |
| FRBA | First Bank | | Regional Banks | 14.98 | 51 | 2.32% | 6.88% |
| For chart view version of above stock list: Chart View ➞ 0 - 25 , 25 - 50 , 50 - 75 , 75 - 100 , 100 - 125 , 125 - 150 , 150 - 175 , 175 - 200 , 200 - 225 , 225 - 250 , 250 - 275 , 275 - 300 , 300 - 325 , 325 - 350 , 350 - 375 , 375 - 400 , 400 - 425 , 425 - 450 , 450 - 475 , 475 - 500 , 500 - 525 , 525 - 550 , 550 - 575 | ||
 | Click To Change The Sort Order: By Market Cap or Company Size Performance: Year-to-date, Week and Day |  |
|
Get the most comprehensive stock market coverage daily at 12Stocks.com ➞ Best Stocks Today ➞ Best Stocks Weekly ➞ Best Stocks Year-to-Date ➞ Best Stocks Trends ➞  Best Stocks Today 12Stocks.com Best Nasdaq Stocks ➞ Best S&P 500 Stocks ➞ Best Tech Stocks ➞ Best Biotech Stocks ➞ |
| Detailed Overview of Financial Stocks |
| Financial Technical Overview, Leaders & Laggards, Top Financial ETF Funds & Detailed Financial Stocks List, Charts, Trends & More |
| Financial Sector: Technical Analysis, Trends & YTD Performance | |
| Financial sector is composed of stocks
from banks, brokers, insurance, REITs
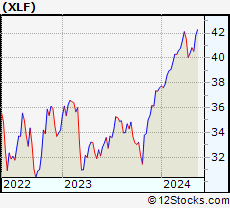
and services subsectors. Financial sector, as represented by XLF, an exchange-traded fund [ETF] that holds basket of Financial stocks (e.g, Bank of America, Goldman Sachs) is up by 7.8% and is currently outperforming the overall market by 0.27% year-to-date. Below is a quick view of Technical charts and trends: |
|
 XLF Weekly Chart |
|
| Long Term Trend: Good | |
| Medium Term Trend: Not Good | |
 XLF Daily Chart |
|
| Short Term Trend: Not Good | |
| Overall Trend Score: 33 | |
| YTD Performance: 7.8% | |
| **Trend Scores & Views Are Only For Educational Purposes And Not For Investing | |
| 12Stocks.com: Top Performing Financial Sector Stocks | ||||||||||||||||||||||||||||||||||||||||||||||||
 The top performing Financial sector stocks year to date are
Now, more recently, over last week, the top performing Financial sector stocks on the move are


|
||||||||||||||||||||||||||||||||||||||||||||||||
| 12Stocks.com: Investing in Financial Sector using Exchange Traded Funds | |
|
The following table shows list of key exchange traded funds (ETF) that
help investors track Financial Index. For detailed view, check out our ETF Funds section of our website. Quick View: Move mouse or cursor over ETF symbol (ticker) to view short-term Technical chart and over ETF name to view long term chart. Click on ticker or stock name for detailed view. Click on to add stock symbol to your watchlist and to view watchlist. |
12Stocks.com List of ETFs that track Financial Index
| Ticker | ETF Name | Watchlist | Recent Price | Smart Investing & Trading Score | Change % | Week % | Year-to-date % |
| XLF | Financial | | 51.91 | 33 | 0.99 | 0.99 | 7.8% |
| IAI | Broker-Dealers & Secs | | 174.97 | 63 | 2.34 | 2.34 | 21.82% |
| KBE | Bank | | 55.98 | 43 | 1.3 | 1.3 | 1.64% |
| FAS | Financial Bull 3X | | 161.82 | 33 | 2.91 | 2.91 | 7.48% |
| FAZ | Financial Bear 3X | | 4.54 | 62 | -2.78 | -2.78 | -27.4% |
| UYG | Financials | | 92.87 | 26 | 1.72 | 1.72 | 9% |
| KIE | Insurance | | 56.42 | 25 | 1.27 | 1.27 | 0.32% |
| 12Stocks.com: Charts, Trends, Fundamental Data and Performances of Financial Stocks | |
|
We now take in-depth look at all Financial stocks including charts, multi-period performances and overall trends (as measured by Smart Investing & Trading Score). One can sort Financial stocks (click link to choose) by Daily, Weekly and by Year-to-Date performances. Also, one can sort by size of the company or by market capitalization. |
| Select Your Default Chart Type: | |||||
| |||||
| Click on stock symbol or name for detailed view. Click on to add stock symbol to your watchlist and to view watchlist. Quick View: Move mouse or cursor over "Daily" to quickly view daily Technical stock chart and over "Weekly" to view weekly Technical stock chart. | |||||

 | MCY Mercury General Corporation |
| Sector: Financials | |
| SubSector: Property & Casualty Insurance | |
| MarketCap: 2122.12 Millions | |
| Recent Price: 71.69 Smart Investing & Trading Score: 100 | |
| Day Percent Change: 5.36% Day Change: 3.65 | |
| Week Change: 5.36% Year-to-date Change: 8.5% | |
| MCY Links: Profile News Message Board | |
| Charts:- Daily , Weekly | |
| Add MCY to Watchlist: View: Get Complete MCY Trend Analysis ➞ | |
 | V Visa Inc. |
| Sector: Financials | |
| SubSector: Credit Services | |
| MarketCap: 340798 Millions | |
| Recent Price: 342.15 Smart Investing & Trading Score: 0 | |
| Day Percent Change: 0.83% Day Change: 2.8 | |
| Week Change: 0.83% Year-to-date Change: 8.4% | |
| V Links: Profile News Message Board | |
| Charts:- Daily , Weekly | |
| Add V to Watchlist: View: Get Complete V Trend Analysis ➞ | |
 | AGNC AGNC Investment Corp. |
| Sector: Financials | |
| SubSector: Mortgage Investment | |
| MarketCap: 6622.19 Millions | |
| Recent Price: 9.63 Smart Investing & Trading Score: 88 | |
| Day Percent Change: 1.58% Day Change: 0.15 | |
| Week Change: 1.58% Year-to-date Change: 8.4% | |
| AGNC Links: Profile News Message Board | |
| Charts:- Daily , Weekly | |
| Add AGNC to Watchlist: View: Get Complete AGNC Trend Analysis ➞ | |
 | PIPR Piper Sandler Companies |
| Sector: Financials | |
| SubSector: Asset Management | |
| MarketCap: 759.603 Millions | |
| Recent Price: 320.98 Smart Investing & Trading Score: 95 | |
| Day Percent Change: 3.01% Day Change: 9.39 | |
| Week Change: 3.01% Year-to-date Change: 8.4% | |
| PIPR Links: Profile News Message Board | |
| Charts:- Daily , Weekly | |
| Add PIPR to Watchlist: View: Get Complete PIPR Trend Analysis ➞ | |
 | SBRA Sabra Health Care REIT, Inc. |
| Sector: Financials | |
| SubSector: REIT - Healthcare Facilities | |
| MarketCap: 2576.54 Millions | |
| Recent Price: 18.41 Smart Investing & Trading Score: 73 | |
| Day Percent Change: 0.66% Day Change: 0.12 | |
| Week Change: 0.66% Year-to-date Change: 8.2% | |
| SBRA Links: Profile News Message Board | |
| Charts:- Daily , Weekly | |
| Add SBRA to Watchlist: View: Get Complete SBRA Trend Analysis ➞ | |
 | RF Regions Financial Corporation |
| Sector: Financials | |
| SubSector: Regional - Southeast Banks | |
| MarketCap: 8936.25 Millions | |
| Recent Price: 25.18 Smart Investing & Trading Score: 43 | |
| Day Percent Change: 1.17% Day Change: 0.29 | |
| Week Change: 1.17% Year-to-date Change: 8.2% | |
| RF Links: Profile News Message Board | |
| Charts:- Daily , Weekly | |
| Add RF to Watchlist: View: Get Complete RF Trend Analysis ➞ | |
 | TCBX Third Coast Bancshares, Inc. |
| Sector: Financials | |
| SubSector: Banks - Regional | |
| MarketCap: 212 Millions | |
| Recent Price: 36.73 Smart Investing & Trading Score: 51 | |
| Day Percent Change: 1.05% Day Change: 0.38 | |
| Week Change: 1.05% Year-to-date Change: 8.2% | |
| TCBX Links: Profile News Message Board | |
| Charts:- Daily , Weekly | |
| Add TCBX to Watchlist: View: Get Complete TCBX Trend Analysis ➞ | |
 | AIG American International Group, Inc. |
| Sector: Financials | |
| SubSector: Property & Casualty Insurance | |
| MarketCap: 21219 Millions | |
| Recent Price: 78.29 Smart Investing & Trading Score: 32 | |
| Day Percent Change: 1.68% Day Change: 1.29 | |
| Week Change: 1.68% Year-to-date Change: 8.1% | |
| AIG Links: Profile News Message Board | |
| Charts:- Daily , Weekly | |
| Add AIG to Watchlist: View: Get Complete AIG Trend Analysis ➞ | |
 | TRTX TPG RE Finance Trust, Inc. |
| Sector: Financials | |
| SubSector: Mortgage Investment | |
| MarketCap: 607.739 Millions | |
| Recent Price: 8.92 Smart Investing & Trading Score: 100 | |
| Day Percent Change: 2.88% Day Change: 0.25 | |
| Week Change: 2.88% Year-to-date Change: 8.0% | |
| TRTX Links: Profile News Message Board | |
| Charts:- Daily , Weekly | |
| Add TRTX to Watchlist: View: Get Complete TRTX Trend Analysis ➞ | |
 | RJF Raymond James Financial, Inc. |
| Sector: Financials | |
| SubSector: Investment Brokerage - Regional | |
| MarketCap: 9490.65 Millions | |
| Recent Price: 166.48 Smart Investing & Trading Score: 70 | |
| Day Percent Change: 2.12% Day Change: 3.45 | |
| Week Change: 2.12% Year-to-date Change: 7.9% | |
| RJF Links: Profile News Message Board | |
| Charts:- Daily , Weekly | |
| Add RJF to Watchlist: View: Get Complete RJF Trend Analysis ➞ | |
 | HMN Horace Mann Educators Corporation |
| Sector: Financials | |
| SubSector: Property & Casualty Insurance | |
| MarketCap: 1545.52 Millions | |
| Recent Price: 41.90 Smart Investing & Trading Score: 64 | |
| Day Percent Change: 1.53% Day Change: 0.63 | |
| Week Change: 1.53% Year-to-date Change: 7.7% | |
| HMN Links: Profile News Message Board | |
| Charts:- Daily , Weekly | |
| Add HMN to Watchlist: View: Get Complete HMN Trend Analysis ➞ | |
 | ADC Agree Realty Corporation |
| Sector: Financials | |
| SubSector: Property Management | |
| MarketCap: 2573.82 Millions | |
| Recent Price: 75.05 Smart Investing & Trading Score: 77 | |
| Day Percent Change: 1.79% Day Change: 1.32 | |
| Week Change: 1.79% Year-to-date Change: 7.6% | |
| ADC Links: Profile News Message Board | |
| Charts:- Daily , Weekly | |
| Add ADC to Watchlist: View: Get Complete ADC Trend Analysis ➞ | |
 | UHT Universal Health Realty Income Trust |
| Sector: Financials | |
| SubSector: REIT - Healthcare Facilities | |
| MarketCap: 1121.14 Millions | |
| Recent Price: 39.22 Smart Investing & Trading Score: 37 | |
| Day Percent Change: 1.61% Day Change: 0.62 | |
| Week Change: 1.61% Year-to-date Change: 7.3% | |
| UHT Links: Profile News Message Board | |
| Charts:- Daily , Weekly | |
| Add UHT to Watchlist: View: Get Complete UHT Trend Analysis ➞ | |
 | ARES Ares Management Corporation |
| Sector: Financials | |
| SubSector: Asset Management | |
| MarketCap: 5826.23 Millions | |
| Recent Price: 188.55 Smart Investing & Trading Score: 88 | |
| Day Percent Change: 3.13% Day Change: 5.72 | |
| Week Change: 3.13% Year-to-date Change: 7.3% | |
| ARES Links: Profile News Message Board | |
| Charts:- Daily , Weekly | |
| Add ARES to Watchlist: View: Get Complete ARES Trend Analysis ➞ | |
 | BNL Broadstone Net Lease, Inc. |
| Sector: Financials | |
| SubSector: REIT Diversified | |
| MarketCap: 27267 Millions | |
| Recent Price: 16.72 Smart Investing & Trading Score: 100 | |
| Day Percent Change: 3.02% Day Change: 0.49 | |
| Week Change: 3.02% Year-to-date Change: 7.3% | |
| BNL Links: Profile News Message Board | |
| Charts:- Daily , Weekly | |
| Add BNL to Watchlist: View: Get Complete BNL Trend Analysis ➞ | |
 | PFBC Preferred Bank |
| Sector: Financials | |
| SubSector: Regional - Pacific Banks | |
| MarketCap: 559.629 Millions | |
| Recent Price: 90.86 Smart Investing & Trading Score: 54 | |
| Day Percent Change: 2.01% Day Change: 1.79 | |
| Week Change: 2.01% Year-to-date Change: 7.2% | |
| PFBC Links: Profile News Message Board | |
| Charts:- Daily , Weekly | |
| Add PFBC to Watchlist: View: Get Complete PFBC Trend Analysis ➞ | |
 | ORI Old Republic International Corporation |
| Sector: Financials | |
| SubSector: Property & Casualty Insurance | |
| MarketCap: 4420.92 Millions | |
| Recent Price: 36.35 Smart Investing & Trading Score: 35 | |
| Day Percent Change: 1.23% Day Change: 0.44 | |
| Week Change: 1.23% Year-to-date Change: 7.2% | |
| ORI Links: Profile News Message Board | |
| Charts:- Daily , Weekly | |
| Add ORI to Watchlist: View: Get Complete ORI Trend Analysis ➞ | |
 | SEIC SEI Investments Company |
| Sector: Financials | |
| SubSector: Asset Management | |
| MarketCap: 6367.03 Millions | |
| Recent Price: 88.34 Smart Investing & Trading Score: 51 | |
| Day Percent Change: 2.19% Day Change: 1.89 | |
| Week Change: 2.19% Year-to-date Change: 7.1% | |
| SEIC Links: Profile News Message Board | |
| Charts:- Daily , Weekly | |
| Add SEIC to Watchlist: View: Get Complete SEIC Trend Analysis ➞ | |
 | OHI Omega Healthcare Investors, Inc. |
| Sector: Financials | |
| SubSector: REIT - Healthcare Facilities | |
| MarketCap: 6433.84 Millions | |
| Recent Price: 39.79 Smart Investing & Trading Score: 100 | |
| Day Percent Change: -0.4% Day Change: -0.16 | |
| Week Change: -0.4% Year-to-date Change: 7.0% | |
| OHI Links: Profile News Message Board | |
| Charts:- Daily , Weekly | |
| Add OHI to Watchlist: View: Get Complete OHI Trend Analysis ➞ | |
 | ENVA Enova International, Inc. |
| Sector: Financials | |
| SubSector: Credit Services | |
| MarketCap: 345.508 Millions | |
| Recent Price: 102.60 Smart Investing & Trading Score: 36 | |
| Day Percent Change: 2.03% Day Change: 2.04 | |
| Week Change: 2.03% Year-to-date Change: 7.0% | |
| ENVA Links: Profile News Message Board | |
| Charts:- Daily , Weekly | |
| Add ENVA to Watchlist: View: Get Complete ENVA Trend Analysis ➞ | |
 | NNN National Retail Properties, Inc. |
| Sector: Financials | |
| SubSector: REIT - Diversified | |
| MarketCap: 5459.93 Millions | |
| Recent Price: 43.05 Smart Investing & Trading Score: 93 | |
| Day Percent Change: 2.45% Day Change: 1.03 | |
| Week Change: 2.45% Year-to-date Change: 7.0% | |
| NNN Links: Profile News Message Board | |
| Charts:- Daily , Weekly | |
| Add NNN to Watchlist: View: Get Complete NNN Trend Analysis ➞ | |
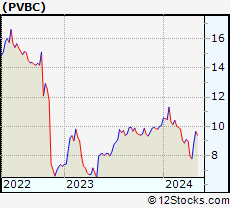 | PVBC Provident Bancorp, Inc. |
| Sector: Financials | |
| SubSector: Money Center Banks | |
| MarketCap: 168.599 Millions | |
| Recent Price: 12.19 Smart Investing & Trading Score: 43 | |
| Day Percent Change: 0.41% Day Change: 0.05 | |
| Week Change: 0.41% Year-to-date Change: 6.9% | |
| PVBC Links: Profile News Message Board | |
| Charts:- Daily , Weekly | |
| Add PVBC to Watchlist: View: Get Complete PVBC Trend Analysis ➞ | |
 | SYF Synchrony Financial |
| Sector: Financials | |
| SubSector: Credit Services | |
| MarketCap: 9297.28 Millions | |
| Recent Price: 69.25 Smart Investing & Trading Score: 53 | |
| Day Percent Change: 2.55% Day Change: 1.72 | |
| Week Change: 2.55% Year-to-date Change: 6.9% | |
| SYF Links: Profile News Message Board | |
| Charts:- Daily , Weekly | |
| Add SYF to Watchlist: View: Get Complete SYF Trend Analysis ➞ | |
 | CCBG Capital City Bank Group, Inc. |
| Sector: Financials | |
| SubSector: Regional - Mid-Atlantic Banks | |
| MarketCap: 314.459 Millions | |
| Recent Price: 38.92 Smart Investing & Trading Score: 36 | |
| Day Percent Change: 1.09% Day Change: 0.42 | |
| Week Change: 1.09% Year-to-date Change: 6.9% | |
| CCBG Links: Profile News Message Board | |
| Charts:- Daily , Weekly | |
| Add CCBG to Watchlist: View: Get Complete CCBG Trend Analysis ➞ | |
 | FRBA First Bank |
| Sector: Financials | |
| SubSector: Regional - Mid-Atlantic Banks | |
| MarketCap: 124.859 Millions | |
| Recent Price: 14.98 Smart Investing & Trading Score: 51 | |
| Day Percent Change: 2.32% Day Change: 0.34 | |
| Week Change: 2.32% Year-to-date Change: 6.9% | |
| FRBA Links: Profile News Message Board | |
| Charts:- Daily , Weekly | |
| Add FRBA to Watchlist: View: Get Complete FRBA Trend Analysis ➞ | |
| For tabular summary view of above stock list: Summary View ➞ 0 - 25 , 25 - 50 , 50 - 75 , 75 - 100 , 100 - 125 , 125 - 150 , 150 - 175 , 175 - 200 , 200 - 225 , 225 - 250 , 250 - 275 , 275 - 300 , 300 - 325 , 325 - 350 , 350 - 375 , 375 - 400 , 400 - 425 , 425 - 450 , 450 - 475 , 475 - 500 , 500 - 525 , 525 - 550 , 550 - 575 | ||
| Click To Change The Sort Order: By Market Cap or Company Size Performance: Year-to-date, Week and Day | |
| Select Chart Type: | ||
|
Best Stocks Today 12Stocks.com |
© 2025 12Stocks.com Terms & Conditions Privacy Contact Us
All Information Provided Only For Education And Not To Be Used For Investing or Trading. See Terms & Conditions


One More Thing ... Get Best Stocks Delivered Daily!
Never Ever Miss A Move With Our Top Ten Stocks Lists
Find Best Stocks In Any Market - Bull or Bear Market
Take A Peek At Our Top Ten Stocks Lists: Daily, Weekly, Year-to-Date & Top Trends
Find Best Stocks In Any Market - Bull or Bear Market
Take A Peek At Our Top Ten Stocks Lists: Daily, Weekly, Year-to-Date & Top Trends
Financial Stocks With Best Up Trends [0-bearish to 100-bullish]: Uniti [100], LendingTree [100], Mercury General[100], Perella Weinberg[100], Broadstone Net[100], LendingClub [100], TPG RE[100], CareTrust REIT[100], Stewart Information[100], Healthcare Realty[100], VICI Properties[100]
Best Financial Stocks Year-to-Date:
ESSA Bancorp[3207.77%], Easterly Government[108.45%], Mr. Cooper[86.58%], Heritage Insurance[75.29%], Root [65.29%], Industrial Logistics[64.89%], Rocket [58.42%], Diversified Healthcare[49.61%], ProAssurance [49.59%], Uniti [47.09%], SoFi Technologies[41.62%] Best Financial Stocks This Week:
Uniti [64.77%], Industrial Logistics[11.36%], LendingTree [7.32%], eXp World[7.27%], EverQuote [6.89%], Camping World[6.84%], First Foundation[6.69%], Diamond Hill[5.46%], Mercury General[5.36%], Cipher Mining[5.27%], AlTi Global[5.13%] Best Financial Stocks Daily:
Uniti [64.77%], Industrial Logistics[11.36%], LendingTree [7.32%], eXp World[7.27%], EverQuote [6.89%], Camping World[6.84%], First Foundation[6.69%], Diamond Hill[5.46%], Mercury General[5.36%], Cipher Mining[5.27%], AlTi Global[5.13%]