
 Login Sign Up


| |||||
 |  | ||||

| 12Stocks.com Market Intelligence |
Best Financial Stocks
| In a hurry? Financial Stocks Lists: Performance Trends Table, Stock Charts
Sort Financial stocks: Daily, Weekly, Year-to-Date, Market Cap & Trends. Filter Financial stocks list by size:All Financial Large Mid-Range Small & MicroCap |
| 12Stocks.com Financial Stocks Performances & Trends Daily | |||||||||
|
|  The overall Smart Investing & Trading Score is 33 (0-bearish to 100-bullish) which puts Financial sector in short term bearish to neutral trend. The Smart Investing & Trading Score from previous trading session is 26 and hence an improvement of trend.
| ||||||||
Here are the Smart Investing & Trading Scores of the most requested Financial stocks at 12Stocks.com (click stock name for detailed review):
|


| 12Stocks.com: Investing in Financial sector with Stocks | |
|
The following table helps investors and traders sort through current performance and trends (as measured by Smart Investing & Trading Score) of various
stocks in the Financial sector. Quick View: Move mouse or cursor over stock symbol (ticker) to view short-term Technical chart and over stock name to view long term chart. Click on  to add stock symbol to your watchlist and to add stock symbol to your watchlist and  to view watchlist. Click on any ticker or stock name for detailed market intelligence report for that stock. to view watchlist. Click on any ticker or stock name for detailed market intelligence report for that stock. |
12Stocks.com Performance of Stocks in Financial Sector
| Ticker | Stock Name | Watchlist | Category | Recent Price | Trend Score | Change % | YTD Change% |
| ILPT | Industrial Logistics |   | REIT - Industrial | 5.98 | 95 | 11.36% | 64.89% |
| IRT | Independence Realty | | REIT | 16.70 | 10 | -0.36% | -15.18% |
| JRVR | James River | | Insurance | 5.52 | 20 | 1.47% | 13.63% |
| PPBI | Pacific Premier | | Regional Banks | 21.73 | 60 | 2.60% | -11.68% |
| SBSI | Southside Bancshares | | Regional Banks | 28.98 | 36 | 1.01% | -7.69% |
| DRH | DiamondRock Hospitality | | REIT | 7.70 | 53 | 1.72% | -13.84% |
| SKWD | Skyward Specialty | | Insurance - Property & Casualty | 49.57 | 25 | 0.36% | -1.92% |
| GTY | Getty Realty | | REIT - Retail | 28.54 | 74 | 1.78% | -3.81% |
| PMT | PennyMac Mortgage | | Mortgage | 12.12 | 42 | 2.71% | -0.58% |
| ALTI | AlTi Global | | Asset Mgmt | 4.10 | 61 | 5.13% | -7.03% |
| FBP | First Ban | | Foreign Banks | 20.44 | 36 | 0.59% | 10.94% |
| EGBN | Eagle Bancorp | | Regional Banks | 16.49 | 25 | 3.32% | -36.26% |
| LKFN | Lakeland | | Regional Banks | 61.84 | 36 | 0.39% | -8.55% |
| FCF | First Commonwealth | | Regional Banks | 16.58 | 68 | 1.53% | -1.26% |
| BRKL | Brookline Bancorp | | S&L | 10.32 | 17 | 1.28% | -11.57% |
| NTB | Bank of N.T. Butterfield & Son | | Foreign Banks | 45.96 | 78 | 2.77% | 27.20% |
| SBCF | Seacoast Banking | | Regional Banks | 28.05 | 61 | 1.48% | 2.62% |
| BUSE | First Busey | | Regional Banks | 22.31 | 53 | 0.81% | -3.10% |
| TCBK | TriCo Bancshares | | Regional Banks | 40.95 | 53 | 1.71% | -5.55% |
| OCFC | OceanFirst | | S&L | 16.32 | 10 | -0.24% | -8.82% |
| UFCS | United Fire | | Insurance | 26.66 | 35 | 2.11% | -5.76% |
| LC | LendingClub | | Credit Services | 16.05 | 100 | 2.95% | -0.86% |
| TRUP | Trupanion | | Insurance | 47.30 | 38 | 2.36% | -1.87% |
| CASH | Meta | | S&L | 74.52 | 17 | -0.36% | 1.35% |
| NXRT | NexPoint Residential | | REIT | 30.55 | 0 | -0.75% | -25.85% |
| For chart view version of above stock list: Chart View ➞ 0 - 25 , 25 - 50 , 50 - 75 , 75 - 100 , 100 - 125 , 125 - 150 , 150 - 175 , 175 - 200 , 200 - 225 | ||
 | Click To Change The Sort Order: By Market Cap or Company Size Performance: Year-to-date, Week and Day |  |
|
Get the most comprehensive stock market coverage daily at 12Stocks.com ➞ Best Stocks Today ➞ Best Stocks Weekly ➞ Best Stocks Year-to-Date ➞ Best Stocks Trends ➞  Best Stocks Today 12Stocks.com Best Nasdaq Stocks ➞ Best S&P 500 Stocks ➞ Best Tech Stocks ➞ Best Biotech Stocks ➞ |
| Detailed Overview of Financial Stocks |
| Financial Technical Overview, Leaders & Laggards, Top Financial ETF Funds & Detailed Financial Stocks List, Charts, Trends & More |
| Financial Sector: Technical Analysis, Trends & YTD Performance | |
| Financial sector is composed of stocks
from banks, brokers, insurance, REITs
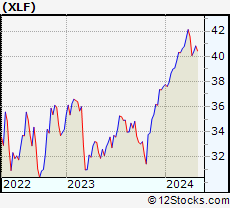
and services subsectors. Financial sector, as represented by XLF, an exchange-traded fund [ETF] that holds basket of Financial stocks (e.g, Bank of America, Goldman Sachs) is up by 7.8% and is currently outperforming the overall market by 0.27% year-to-date. Below is a quick view of Technical charts and trends: |
|
 XLF Weekly Chart |
|
| Long Term Trend: Good | |
| Medium Term Trend: Not Good | |
 XLF Daily Chart |
|
| Short Term Trend: Not Good | |
| Overall Trend Score: 33 | |
| YTD Performance: 7.8% | |
| **Trend Scores & Views Are Only For Educational Purposes And Not For Investing | |
| 12Stocks.com: Top Performing Financial Sector Stocks | ||||||||||||||||||||||||||||||||||||||||||||||||
 The top performing Financial sector stocks year to date are
Now, more recently, over last week, the top performing Financial sector stocks on the move are


|
||||||||||||||||||||||||||||||||||||||||||||||||
| 12Stocks.com: Investing in Financial Sector using Exchange Traded Funds | |
|
The following table shows list of key exchange traded funds (ETF) that
help investors track Financial Index. For detailed view, check out our ETF Funds section of our website. Quick View: Move mouse or cursor over ETF symbol (ticker) to view short-term Technical chart and over ETF name to view long term chart. Click on ticker or stock name for detailed view. Click on to add stock symbol to your watchlist and to view watchlist. |
12Stocks.com List of ETFs that track Financial Index
| Ticker | ETF Name | Watchlist | Recent Price | Smart Investing & Trading Score | Change % | Week % | Year-to-date % |
| XLF | Financial | | 51.91 | 33 | 0.99 | 0.99 | 7.8% |
| IAI | Broker-Dealers & Secs | | 174.97 | 63 | 2.34 | 2.34 | 21.82% |
| KBE | Bank | | 55.98 | 43 | 1.3 | 1.3 | 1.64% |
| FAS | Financial Bull 3X | | 161.82 | 33 | 2.91 | 2.91 | 7.48% |
| FAZ | Financial Bear 3X | | 4.54 | 62 | -2.78 | -2.78 | -27.4% |
| UYG | Financials | | 92.87 | 26 | 1.72 | 1.72 | 9% |
| KIE | Insurance | | 56.42 | 25 | 1.27 | 1.27 | 0.32% |
| 12Stocks.com: Charts, Trends, Fundamental Data and Performances of Financial Stocks | |
|
We now take in-depth look at all Financial stocks including charts, multi-period performances and overall trends (as measured by Smart Investing & Trading Score). One can sort Financial stocks (click link to choose) by Daily, Weekly and by Year-to-Date performances. Also, one can sort by size of the company or by market capitalization. |
| Select Your Default Chart Type: | |||||
| |||||
| Click on stock symbol or name for detailed view. Click on to add stock symbol to your watchlist and to view watchlist. Quick View: Move mouse or cursor over "Daily" to quickly view daily Technical stock chart and over "Weekly" to view weekly Technical stock chart. | |||||

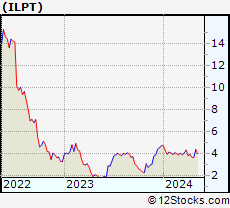 | ILPT Industrial Logistics Properties Trust |
| Sector: Financials | |
| SubSector: REIT - Industrial | |
| MarketCap: 988.549 Millions | |
| Recent Price: 5.98 Smart Investing & Trading Score: 95 | |
| Day Percent Change: 11.36% Day Change: 0.61 | |
| Week Change: 11.36% Year-to-date Change: 64.9% | |
| ILPT Links: Profile News Message Board | |
| Charts:- Daily , Weekly | |
| Add ILPT to Watchlist: View: Get Complete ILPT Trend Analysis ➞ | |
 | IRT Independence Realty Trust, Inc. |
| Sector: Financials | |
| SubSector: REIT - Residential | |
| MarketCap: 980.161 Millions | |
| Recent Price: 16.70 Smart Investing & Trading Score: 10 | |
| Day Percent Change: -0.36% Day Change: -0.06 | |
| Week Change: -0.36% Year-to-date Change: -15.2% | |
| IRT Links: Profile News Message Board | |
| Charts:- Daily , Weekly | |
| Add IRT to Watchlist: View: Get Complete IRT Trend Analysis ➞ | |
 | JRVR James River Group Holdings, Ltd. |
| Sector: Financials | |
| SubSector: Property & Casualty Insurance | |
| MarketCap: 978.312 Millions | |
| Recent Price: 5.52 Smart Investing & Trading Score: 20 | |
| Day Percent Change: 1.47% Day Change: 0.08 | |
| Week Change: 1.47% Year-to-date Change: 13.6% | |
| JRVR Links: Profile News Message Board | |
| Charts:- Daily , Weekly | |
| Add JRVR to Watchlist: View: Get Complete JRVR Trend Analysis ➞ | |
 | PPBI Pacific Premier Bancorp, Inc. |
| Sector: Financials | |
| SubSector: Regional - Pacific Banks | |
| MarketCap: 978.029 Millions | |
| Recent Price: 21.73 Smart Investing & Trading Score: 60 | |
| Day Percent Change: 2.6% Day Change: 0.55 | |
| Week Change: 2.6% Year-to-date Change: -11.7% | |
| PPBI Links: Profile News Message Board | |
| Charts:- Daily , Weekly | |
| Add PPBI to Watchlist: View: Get Complete PPBI Trend Analysis ➞ | |
 | SBSI Southside Bancshares, Inc. |
| Sector: Financials | |
| SubSector: Regional - Mid-Atlantic Banks | |
| MarketCap: 971.259 Millions | |
| Recent Price: 28.98 Smart Investing & Trading Score: 36 | |
| Day Percent Change: 1.01% Day Change: 0.29 | |
| Week Change: 1.01% Year-to-date Change: -7.7% | |
| SBSI Links: Profile News Message Board | |
| Charts:- Daily , Weekly | |
| Add SBSI to Watchlist: View: Get Complete SBSI Trend Analysis ➞ | |
 | DRH DiamondRock Hospitality Company |
| Sector: Financials | |
| SubSector: REIT - Hotel/Motel | |
| MarketCap: 964 Millions | |
| Recent Price: 7.70 Smart Investing & Trading Score: 53 | |
| Day Percent Change: 1.72% Day Change: 0.13 | |
| Week Change: 1.72% Year-to-date Change: -13.8% | |
| DRH Links: Profile News Message Board | |
| Charts:- Daily , Weekly | |
| Add DRH to Watchlist: View: Get Complete DRH Trend Analysis ➞ | |
 | SKWD Skyward Specialty Insurance Group, Inc. |
| Sector: Financials | |
| SubSector: Insurance - Property & Casualty | |
| MarketCap: 936 Millions | |
| Recent Price: 49.57 Smart Investing & Trading Score: 25 | |
| Day Percent Change: 0.36% Day Change: 0.18 | |
| Week Change: 0.36% Year-to-date Change: -1.9% | |
| SKWD Links: Profile News Message Board | |
| Charts:- Daily , Weekly | |
| Add SKWD to Watchlist: View: Get Complete SKWD Trend Analysis ➞ | |
 | GTY Getty Realty Corp. |
| Sector: Financials | |
| SubSector: REIT - Retail | |
| MarketCap: 926.114 Millions | |
| Recent Price: 28.54 Smart Investing & Trading Score: 74 | |
| Day Percent Change: 1.78% Day Change: 0.5 | |
| Week Change: 1.78% Year-to-date Change: -3.8% | |
| GTY Links: Profile News Message Board | |
| Charts:- Daily , Weekly | |
| Add GTY to Watchlist: View: Get Complete GTY Trend Analysis ➞ | |
 | PMT PennyMac Mortgage Investment Trust |
| Sector: Financials | |
| SubSector: Mortgage Investment | |
| MarketCap: 917.639 Millions | |
| Recent Price: 12.12 Smart Investing & Trading Score: 42 | |
| Day Percent Change: 2.71% Day Change: 0.32 | |
| Week Change: 2.71% Year-to-date Change: -0.6% | |
| PMT Links: Profile News Message Board | |
| Charts:- Daily , Weekly | |
| Add PMT to Watchlist: View: Get Complete PMT Trend Analysis ➞ | |
 | ALTI AlTi Global, Inc. |
| Sector: Financials | |
| SubSector: Asset Management | |
| MarketCap: 917 Millions | |
| Recent Price: 4.10 Smart Investing & Trading Score: 61 | |
| Day Percent Change: 5.13% Day Change: 0.2 | |
| Week Change: 5.13% Year-to-date Change: -7.0% | |
| ALTI Links: Profile News Message Board | |
| Charts:- Daily , Weekly | |
| Add ALTI to Watchlist: View: Get Complete ALTI Trend Analysis ➞ | |
 | FBP First BanCorp. |
| Sector: Financials | |
| SubSector: Foreign Regional Banks | |
| MarketCap: 913.079 Millions | |
| Recent Price: 20.44 Smart Investing & Trading Score: 36 | |
| Day Percent Change: 0.59% Day Change: 0.12 | |
| Week Change: 0.59% Year-to-date Change: 10.9% | |
| FBP Links: Profile News Message Board | |
| Charts:- Daily , Weekly | |
| Add FBP to Watchlist: View: Get Complete FBP Trend Analysis ➞ | |
 | EGBN Eagle Bancorp, Inc. |
| Sector: Financials | |
| SubSector: Regional - Mid-Atlantic Banks | |
| MarketCap: 906.559 Millions | |
| Recent Price: 16.49 Smart Investing & Trading Score: 25 | |
| Day Percent Change: 3.32% Day Change: 0.53 | |
| Week Change: 3.32% Year-to-date Change: -36.3% | |
| EGBN Links: Profile News Message Board | |
| Charts:- Daily , Weekly | |
| Add EGBN to Watchlist: View: Get Complete EGBN Trend Analysis ➞ | |
 | LKFN Lakeland Financial Corporation |
| Sector: Financials | |
| SubSector: Regional - Midwest Banks | |
| MarketCap: 903.27 Millions | |
| Recent Price: 61.84 Smart Investing & Trading Score: 36 | |
| Day Percent Change: 0.39% Day Change: 0.24 | |
| Week Change: 0.39% Year-to-date Change: -8.6% | |
| LKFN Links: Profile News Message Board | |
| Charts:- Daily , Weekly | |
| Add LKFN to Watchlist: View: Get Complete LKFN Trend Analysis ➞ | |
 | FCF First Commonwealth Financial Corporation |
| Sector: Financials | |
| SubSector: Regional - Northeast Banks | |
| MarketCap: 900.299 Millions | |
| Recent Price: 16.58 Smart Investing & Trading Score: 68 | |
| Day Percent Change: 1.53% Day Change: 0.25 | |
| Week Change: 1.53% Year-to-date Change: -1.3% | |
| FCF Links: Profile News Message Board | |
| Charts:- Daily , Weekly | |
| Add FCF to Watchlist: View: Get Complete FCF Trend Analysis ➞ | |
 | BRKL Brookline Bancorp, Inc. |
| Sector: Financials | |
| SubSector: Savings & Loans | |
| MarketCap: 894.43 Millions | |
| Recent Price: 10.32 Smart Investing & Trading Score: 17 | |
| Day Percent Change: 1.28% Day Change: 0.13 | |
| Week Change: 1.28% Year-to-date Change: -11.6% | |
| BRKL Links: Profile News Message Board | |
| Charts:- Daily , Weekly | |
| Add BRKL to Watchlist: View: Get Complete BRKL Trend Analysis ➞ | |
 | NTB The Bank of N.T. Butterfield & Son Limited |
| Sector: Financials | |
| SubSector: Foreign Regional Banks | |
| MarketCap: 889.379 Millions | |
| Recent Price: 45.96 Smart Investing & Trading Score: 78 | |
| Day Percent Change: 2.77% Day Change: 1.24 | |
| Week Change: 2.77% Year-to-date Change: 27.2% | |
| NTB Links: Profile News Message Board | |
| Charts:- Daily , Weekly | |
| Add NTB to Watchlist: View: Get Complete NTB Trend Analysis ➞ | |
 | SBCF Seacoast Banking Corporation of Florida |
| Sector: Financials | |
| SubSector: Regional - Mid-Atlantic Banks | |
| MarketCap: 881.559 Millions | |
| Recent Price: 28.05 Smart Investing & Trading Score: 61 | |
| Day Percent Change: 1.48% Day Change: 0.41 | |
| Week Change: 1.48% Year-to-date Change: 2.6% | |
| SBCF Links: Profile News Message Board | |
| Charts:- Daily , Weekly | |
| Add SBCF to Watchlist: View: Get Complete SBCF Trend Analysis ➞ | |
 | BUSE First Busey Corporation |
| Sector: Financials | |
| SubSector: Regional - Midwest Banks | |
| MarketCap: 876.97 Millions | |
| Recent Price: 22.31 Smart Investing & Trading Score: 53 | |
| Day Percent Change: 0.81% Day Change: 0.18 | |
| Week Change: 0.81% Year-to-date Change: -3.1% | |
| BUSE Links: Profile News Message Board | |
| Charts:- Daily , Weekly | |
| Add BUSE to Watchlist: View: Get Complete BUSE Trend Analysis ➞ | |
 | TCBK TriCo Bancshares |
| Sector: Financials | |
| SubSector: Regional - Pacific Banks | |
| MarketCap: 875.129 Millions | |
| Recent Price: 40.95 Smart Investing & Trading Score: 53 | |
| Day Percent Change: 1.71% Day Change: 0.69 | |
| Week Change: 1.71% Year-to-date Change: -5.6% | |
| TCBK Links: Profile News Message Board | |
| Charts:- Daily , Weekly | |
| Add TCBK to Watchlist: View: Get Complete TCBK Trend Analysis ➞ | |
 | OCFC OceanFirst Financial Corp. |
| Sector: Financials | |
| SubSector: Savings & Loans | |
| MarketCap: 867.43 Millions | |
| Recent Price: 16.32 Smart Investing & Trading Score: 10 | |
| Day Percent Change: -0.24% Day Change: -0.04 | |
| Week Change: -0.24% Year-to-date Change: -8.8% | |
| OCFC Links: Profile News Message Board | |
| Charts:- Daily , Weekly | |
| Add OCFC to Watchlist: View: Get Complete OCFC Trend Analysis ➞ | |
 | UFCS United Fire Group, Inc. |
| Sector: Financials | |
| SubSector: Property & Casualty Insurance | |
| MarketCap: 862.812 Millions | |
| Recent Price: 26.66 Smart Investing & Trading Score: 35 | |
| Day Percent Change: 2.11% Day Change: 0.55 | |
| Week Change: 2.11% Year-to-date Change: -5.8% | |
| UFCS Links: Profile News Message Board | |
| Charts:- Daily , Weekly | |
| Add UFCS to Watchlist: View: Get Complete UFCS Trend Analysis ➞ | |
 | LC LendingClub Corporation |
| Sector: Financials | |
| SubSector: Credit Services | |
| MarketCap: 852.308 Millions | |
| Recent Price: 16.05 Smart Investing & Trading Score: 100 | |
| Day Percent Change: 2.95% Day Change: 0.46 | |
| Week Change: 2.95% Year-to-date Change: -0.9% | |
| LC Links: Profile News Message Board | |
| Charts:- Daily , Weekly | |
| Add LC to Watchlist: View: Get Complete LC Trend Analysis ➞ | |
 | TRUP Trupanion, Inc. |
| Sector: Financials | |
| SubSector: Accident & Health Insurance | |
| MarketCap: 852.06 Millions | |
| Recent Price: 47.30 Smart Investing & Trading Score: 38 | |
| Day Percent Change: 2.36% Day Change: 1.09 | |
| Week Change: 2.36% Year-to-date Change: -1.9% | |
| TRUP Links: Profile News Message Board | |
| Charts:- Daily , Weekly | |
| Add TRUP to Watchlist: View: Get Complete TRUP Trend Analysis ➞ | |
 | CASH Meta Financial Group, Inc. |
| Sector: Financials | |
| SubSector: Savings & Loans | |
| MarketCap: 849.33 Millions | |
| Recent Price: 74.52 Smart Investing & Trading Score: 17 | |
| Day Percent Change: -0.36% Day Change: -0.27 | |
| Week Change: -0.36% Year-to-date Change: 1.4% | |
| CASH Links: Profile News Message Board | |
| Charts:- Daily , Weekly | |
| Add CASH to Watchlist: View: Get Complete CASH Trend Analysis ➞ | |
 | NXRT NexPoint Residential Trust, Inc. |
| Sector: Financials | |
| SubSector: REIT - Residential | |
| MarketCap: 839.161 Millions | |
| Recent Price: 30.55 Smart Investing & Trading Score: 0 | |
| Day Percent Change: -0.75% Day Change: -0.23 | |
| Week Change: -0.75% Year-to-date Change: -25.9% | |
| NXRT Links: Profile News Message Board | |
| Charts:- Daily , Weekly | |
| Add NXRT to Watchlist: View: Get Complete NXRT Trend Analysis ➞ | |
| For tabular summary view of above stock list: Summary View ➞ 0 - 25 , 25 - 50 , 50 - 75 , 75 - 100 , 100 - 125 , 125 - 150 , 150 - 175 , 175 - 200 , 200 - 225 | ||
| Click To Change The Sort Order: By Market Cap or Company Size Performance: Year-to-date, Week and Day | |
| Select Chart Type: | ||
|
Best Stocks Today 12Stocks.com |
© 2025 12Stocks.com Terms & Conditions Privacy Contact Us
All Information Provided Only For Education And Not To Be Used For Investing or Trading. See Terms & Conditions


One More Thing ... Get Best Stocks Delivered Daily!
Never Ever Miss A Move With Our Top Ten Stocks Lists
Find Best Stocks In Any Market - Bull or Bear Market
Take A Peek At Our Top Ten Stocks Lists: Daily, Weekly, Year-to-Date & Top Trends
Find Best Stocks In Any Market - Bull or Bear Market
Take A Peek At Our Top Ten Stocks Lists: Daily, Weekly, Year-to-Date & Top Trends
Financial Stocks With Best Up Trends [0-bearish to 100-bullish]: Uniti [100], LendingTree [100], Mercury General[100], Perella Weinberg[100], Broadstone Net[100], LendingClub [100], TPG RE[100], CareTrust REIT[100], Stewart Information[100], Healthcare Realty[100], VICI Properties[100]
Best Financial Stocks Year-to-Date:
ESSA Bancorp[3207.77%], Easterly Government[108.45%], Mr. Cooper[86.58%], Heritage Insurance[75.29%], Root [65.29%], Industrial Logistics[64.89%], Rocket [58.42%], Diversified Healthcare[49.61%], ProAssurance [49.59%], Uniti [47.09%], SoFi Technologies[41.62%] Best Financial Stocks This Week:
Uniti [64.77%], Industrial Logistics[11.36%], LendingTree [7.32%], eXp World[7.27%], EverQuote [6.89%], Camping World[6.84%], First Foundation[6.69%], Diamond Hill[5.46%], Mercury General[5.36%], Cipher Mining[5.27%], AlTi Global[5.13%] Best Financial Stocks Daily:
Uniti [64.77%], Industrial Logistics[11.36%], LendingTree [7.32%], eXp World[7.27%], EverQuote [6.89%], Camping World[6.84%], First Foundation[6.69%], Diamond Hill[5.46%], Mercury General[5.36%], Cipher Mining[5.27%], AlTi Global[5.13%]