
 Login Sign Up


| |||||
 |  | ||||

| 12Stocks.com Market Intelligence |
Best Consumer Staples Stocks
| In a hurry? Consumer Staples Stocks: Performance Trends Table, Stock Charts
Sort Consumer Staples : Daily, Weekly, Year-to-Date, Market Cap & Trends. Filter Consumer Staples stocks list by size: All Large Mid-Range Small |
| 12Stocks.com Consumer Staples Stocks Performances & Trends Daily | |||||||||
|
|  The overall Smart Investing & Trading Score is 77 (0-bearish to 100-bullish) which puts Consumer Staples sector in short term neutral to bullish trend. The Smart Investing & Trading Score from previous trading session is 40 and an improvement of trend continues.
| ||||||||
Here are the Smart Investing & Trading Scores of the most requested Consumer Staples stocks at 12Stocks.com (click stock name for detailed review):
|


| 12Stocks.com: Investing in Consumer Staples sector with Stocks | |
|
The following table helps investors and traders sort through current performance and trends (as measured by Smart Investing & Trading Score) of various
stocks in the Consumer Staples sector. Quick View: Move mouse or cursor over stock symbol (ticker) to view short-term Technical chart and over stock name to view long term chart. Click on  to add stock symbol to your watchlist and to add stock symbol to your watchlist and  to view watchlist. Click on any ticker or stock name for detailed market intelligence report for that stock. to view watchlist. Click on any ticker or stock name for detailed market intelligence report for that stock. |
12Stocks.com Performance of Stocks in Consumer Staples Sector
| Ticker | Stock Name | Watchlist | Category | Recent Price | Smart Investing & Trading Score | Change % | Weekly Change% |
| ISPR | Ispire Technology |   | Tobacco | 2.98 | 93 | 5.30% | 29.57% |
| DNUT | Krispy Kreme | | Grocery Stores | 3.32 | 74 | -3.49% | 25.28% |
| LCUT | Lifetime Brands | | Housewares & Accessories | 5.43 | 100 | 6.68% | 24.83% |
| VRA | Vera Bradley | | Textile - Apparel Footwear & Accessories | 2.57 | 100 | 3.21% | 22.38% |
| SRI | Stoneridge | | Auto Parts | 7.97 | 100 | 2.84% | 20.76% |
| BRCC | BRC | | Packaged Foods | 1.59 | 74 | 1.27% | 20.45% |
| SKIN | Beauty Health | | Household & Household | 2.28 | 100 | 8.06% | 16.92% |
| HELE | Helen of Troy | | Housewares & Accessories | 32.66 | 100 | -1.77% | 15.24% |
| HLF | Herbalife Nutrition | | Household | 9.98 | 100 | 2.57% | 14.32% |
| WHR | Whirlpool | | Appliances | 109.93 | 95 | -0.60% | 14.31% |
| ADNT | Adient | | Auto Parts | 22.38 | 100 | 0.90% | 13.49% |
| PII | Polaris | | Recreational Vehicles | 46.44 | 100 | -0.49% | 13.43% |
| MNRO | Monro | | Auto Parts | 16.63 | 100 | -0.06% | 13.36% |
| SNBR | Sleep Number | | Home Furnishings & Fixtures | 7.60 | 64 | 2.15% | 13.10% |
| CAL | Caleres | | Textile - Apparel Footwear & Accessories | 14.03 | 74 | 1.08% | 11.88% |
| ACCO | ACCO Brands | | Office Supplies | 3.99 | 100 | 2.05% | 11.45% |
| HAIN | Hain Celestial | | Food Wholesale | 1.66 | 67 | 0.00% | 11.41% |
| EL | Estee Lauder | | Household | 88.72 | 100 | 0.16% | 10.78% |
| FIZZ | National Beverage | | Beverages | 46.91 | 100 | 4.59% | 10.66% |
| CPS | Cooper-Standard | | Auto Parts | 24.06 | 100 | -0.46% | 10.47% |
| COTY | Coty | | Household | 5.09 | 87 | 0.00% | 10.41% |
| LIND | Lindblad Expeditions | | Recreational Goods, Other | 12.79 | 100 | 1.19% | 10.35% |
| NUS | Nu Skin | | Household | 8.92 | 100 | 1.13% | 10.26% |
| PVH | PVH | | Textile - Apparel Clothing | 72.44 | 100 | -0.97% | 10.19% |
| LEA | Lear | | Auto Parts | 103.58 | 100 | 0.37% | 9.82% |
| For chart view version of above stock list: Chart View ➞ 0 - 25 , 25 - 50 , 50 - 75 , 75 - 100 , 100 - 125 , 125 - 150 , 150 - 175 , 175 - 200 , 200 - 225 | ||
 | Click To Change The Sort Order: By Market Cap or Company Size Performance: Year-to-date, Week and Day |  |
|
Get the most comprehensive stock market coverage daily at 12Stocks.com ➞ Best Stocks Today ➞ Best Stocks Weekly ➞ Best Stocks Year-to-Date ➞ Best Stocks Trends ➞  Best Stocks Today 12Stocks.com Best Nasdaq Stocks ➞ Best S&P 500 Stocks ➞ Best Tech Stocks ➞ Best Biotech Stocks ➞ |
| Detailed Overview of Consumer Staples Stocks |
| Consumer Staples Technical Overview, Leaders & Laggards, Top Consumer Staples ETF Funds & Detailed Consumer Staples Stocks List, Charts, Trends & More |
| Consumer Staples Sector: Technical Analysis, Trends & YTD Performance | |
| Consumer Staples sector is composed of stocks
from household consumer products, food, farm, cosmetics, tobacco,
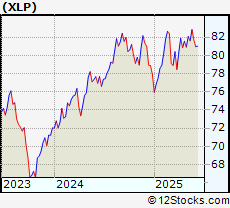
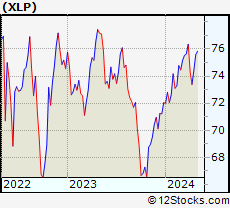
and beverages subsectors. Consumer Staples sector, as represented by XLP, an exchange-traded fund [ETF] that holds basket of Consumer Staples stocks (e.g, Proctor & Gamble, Pepsi) is up by 5.1% and is currently underperforming the overall market by -1.56% year-to-date. Below is a quick view of Technical charts and trends: |
|
 XLP Weekly Chart |
|
| Long Term Trend: Good | |
| Medium Term Trend: Very Good | |
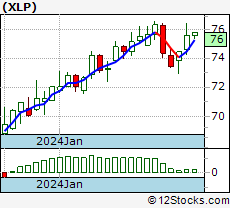
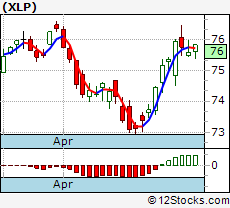 XLP Daily Chart |
|
| Short Term Trend: Very Good | |
| Overall Trend Score: 77 | |
| YTD Performance: 5.1% | |
| **Trend Scores & Views Are Only For Educational Purposes And Not For Investing | |
| 12Stocks.com: Top Performing Consumer Staples Sector Stocks | ||||||||||||||||||||||||||||||||||||||||||||||||
 The top performing Consumer Staples sector stocks year to date are
Now, more recently, over last week, the top performing Consumer Staples sector stocks on the move are


|
||||||||||||||||||||||||||||||||||||||||||||||||
| 12Stocks.com: Investing in Consumer Staples Sector using Exchange Traded Funds | |
|
The following table shows list of key exchange traded funds (ETF) that
help investors track Consumer Staples Index. For detailed view, check out our ETF Funds section of our website. Quick View: Move mouse or cursor over ETF symbol (ticker) to view short-term Technical chart and over ETF name to view long term chart. Click on ticker or stock name for detailed view. Click on to add stock symbol to your watchlist and to view watchlist. |
12Stocks.com List of ETFs that track Consumer Staples Index
| Ticker | ETF Name | Watchlist | Recent Price | Smart Investing & Trading Score | Change % | Week % | Year-to-date % |
| XLP | Consumer Staples | | 82.18 | 77 | -0.05 | 2.02 | 5.1% |
| 12Stocks.com: Charts, Trends, Fundamental Data and Performances of Consumer Staples Stocks | |
|
We now take in-depth look at all Consumer Staples stocks including charts, multi-period performances and overall trends (as measured by Smart Investing & Trading Score). One can sort Consumer Staples stocks (click link to choose) by Daily, Weekly and by Year-to-Date performances. Also, one can sort by size of the company or by market capitalization. |
| Select Your Default Chart Type: | |||||
| |||||
| Click on stock symbol or name for detailed view. Click on to add stock symbol to your watchlist and to view watchlist. Quick View: Move mouse or cursor over "Daily" to quickly view daily Technical stock chart and over "Weekly" to view weekly Technical stock chart. | |||||
 | ISPR Ispire Technology Inc. |
| Sector: Consumer Staples | |
| SubSector: Tobacco | |
| MarketCap: 447 Millions | |
| Recent Price: 2.98 Smart Investing & Trading Score: 93 | |
| Day Percent Change: 5.3% Day Change: 0.15 | |
| Week Change: 29.57% Year-to-date Change: -40.8% | |
| ISPR Links: Profile News Message Board | |
| Charts:- Daily , Weekly | |
| Add ISPR to Watchlist: View: Get Complete ISPR Trend Analysis ➞ | |
 | DNUT Krispy Kreme, Inc. |
| Sector: Consumer Staples | |
| SubSector: Grocery Stores | |
| MarketCap: 2480 Millions | |
| Recent Price: 3.32 Smart Investing & Trading Score: 74 | |
| Day Percent Change: -3.49% Day Change: -0.12 | |
| Week Change: 25.28% Year-to-date Change: -66.2% | |
| DNUT Links: Profile News Message Board | |
| Charts:- Daily , Weekly | |
| Add DNUT to Watchlist: View: Get Complete DNUT Trend Analysis ➞ | |
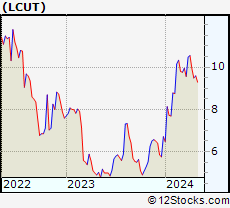 | LCUT Lifetime Brands, Inc. |
| Sector: Consumer Staples | |
| SubSector: Housewares & Accessories | |
| MarketCap: 135.253 Millions | |
| Recent Price: 5.43 Smart Investing & Trading Score: 100 | |
| Day Percent Change: 6.68% Day Change: 0.34 | |
| Week Change: 24.83% Year-to-date Change: -7.5% | |
| LCUT Links: Profile News Message Board | |
| Charts:- Daily , Weekly | |
| Add LCUT to Watchlist: View: Get Complete LCUT Trend Analysis ➞ | |
 | VRA Vera Bradley, Inc. |
| Sector: Consumer Staples | |
| SubSector: Textile - Apparel Footwear & Accessories | |
| MarketCap: 151.17 Millions | |
| Recent Price: 2.57 Smart Investing & Trading Score: 100 | |
| Day Percent Change: 3.21% Day Change: 0.08 | |
| Week Change: 22.38% Year-to-date Change: -34.6% | |
| VRA Links: Profile News Message Board | |
| Charts:- Daily , Weekly | |
| Add VRA to Watchlist: View: Get Complete VRA Trend Analysis ➞ | |
 | SRI Stoneridge, Inc. |
| Sector: Consumer Staples | |
| SubSector: Auto Parts | |
| MarketCap: 451.839 Millions | |
| Recent Price: 7.97 Smart Investing & Trading Score: 100 | |
| Day Percent Change: 2.84% Day Change: 0.22 | |
| Week Change: 20.76% Year-to-date Change: 27.1% | |
| SRI Links: Profile News Message Board | |
| Charts:- Daily , Weekly | |
| Add SRI to Watchlist: View: Get Complete SRI Trend Analysis ➞ | |
 | BRCC BRC Inc. |
| Sector: Consumer Staples | |
| SubSector: Packaged Foods | |
| MarketCap: 1110 Millions | |
| Recent Price: 1.59 Smart Investing & Trading Score: 74 | |
| Day Percent Change: 1.27% Day Change: 0.02 | |
| Week Change: 20.45% Year-to-date Change: -49.8% | |
| BRCC Links: Profile News Message Board | |
| Charts:- Daily , Weekly | |
| Add BRCC to Watchlist: View: Get Complete BRCC Trend Analysis ➞ | |
 | SKIN The Beauty Health Company |
| Sector: Consumer Staples | |
| SubSector: Household & Personal Products | |
| MarketCap: 1070 Millions | |
| Recent Price: 2.28 Smart Investing & Trading Score: 100 | |
| Day Percent Change: 8.06% Day Change: 0.17 | |
| Week Change: 16.92% Year-to-date Change: 43.4% | |
| SKIN Links: Profile News Message Board | |
| Charts:- Daily , Weekly | |
| Add SKIN to Watchlist: View: Get Complete SKIN Trend Analysis ➞ | |
 | HELE Helen of Troy Limited |
| Sector: Consumer Staples | |
| SubSector: Housewares & Accessories | |
| MarketCap: 3199.53 Millions | |
| Recent Price: 32.66 Smart Investing & Trading Score: 100 | |
| Day Percent Change: -1.77% Day Change: -0.59 | |
| Week Change: 15.24% Year-to-date Change: -45.4% | |
| HELE Links: Profile News Message Board | |
| Charts:- Daily , Weekly | |
| Add HELE to Watchlist: View: Get Complete HELE Trend Analysis ➞ | |
 | HLF Herbalife Nutrition Ltd. |
| Sector: Consumer Staples | |
| SubSector: Personal Products | |
| MarketCap: 4884.65 Millions | |
| Recent Price: 9.98 Smart Investing & Trading Score: 100 | |
| Day Percent Change: 2.57% Day Change: 0.25 | |
| Week Change: 14.32% Year-to-date Change: 49.2% | |
| HLF Links: Profile News Message Board | |
| Charts:- Daily , Weekly | |
| Add HLF to Watchlist: View: Get Complete HLF Trend Analysis ➞ | |
 | WHR Whirlpool Corporation |
| Sector: Consumer Staples | |
| SubSector: Appliances | |
| MarketCap: 5015.08 Millions | |
| Recent Price: 109.93 Smart Investing & Trading Score: 95 | |
| Day Percent Change: -0.6% Day Change: -0.66 | |
| Week Change: 14.31% Year-to-date Change: -2.3% | |
| WHR Links: Profile News Message Board | |
| Charts:- Daily , Weekly | |
| Add WHR to Watchlist: View: Get Complete WHR Trend Analysis ➞ | |
 | ADNT Adient plc |
| Sector: Consumer Staples | |
| SubSector: Auto Parts | |
| MarketCap: 1003.39 Millions | |
| Recent Price: 22.38 Smart Investing & Trading Score: 100 | |
| Day Percent Change: 0.9% Day Change: 0.2 | |
| Week Change: 13.49% Year-to-date Change: 29.9% | |
| ADNT Links: Profile News Message Board | |
| Charts:- Daily , Weekly | |
| Add ADNT to Watchlist: View: Get Complete ADNT Trend Analysis ➞ | |
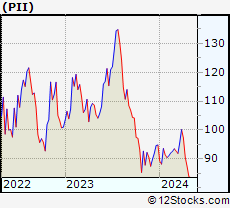 | PII Polaris Inc. |
| Sector: Consumer Staples | |
| SubSector: Recreational Vehicles | |
| MarketCap: 3589.29 Millions | |
| Recent Price: 46.44 Smart Investing & Trading Score: 100 | |
| Day Percent Change: -0.49% Day Change: -0.23 | |
| Week Change: 13.43% Year-to-date Change: -18.2% | |
| PII Links: Profile News Message Board | |
| Charts:- Daily , Weekly | |
| Add PII to Watchlist: View: Get Complete PII Trend Analysis ➞ | |
 | MNRO Monro, Inc. |
| Sector: Consumer Staples | |
| SubSector: Auto Parts | |
| MarketCap: 1514.89 Millions | |
| Recent Price: 16.63 Smart Investing & Trading Score: 100 | |
| Day Percent Change: -0.06% Day Change: -0.01 | |
| Week Change: 13.36% Year-to-date Change: -31.9% | |
| MNRO Links: Profile News Message Board | |
| Charts:- Daily , Weekly | |
| Add MNRO to Watchlist: View: Get Complete MNRO Trend Analysis ➞ | |
 | SNBR Sleep Number Corporation |
| Sector: Consumer Staples | |
| SubSector: Home Furnishings & Fixtures | |
| MarketCap: 692.735 Millions | |
| Recent Price: 7.60 Smart Investing & Trading Score: 64 | |
| Day Percent Change: 2.15% Day Change: 0.16 | |
| Week Change: 13.1% Year-to-date Change: -50.1% | |
| SNBR Links: Profile News Message Board | |
| Charts:- Daily , Weekly | |
| Add SNBR to Watchlist: View: Get Complete SNBR Trend Analysis ➞ | |
 | CAL Caleres, Inc. |
| Sector: Consumer Staples | |
| SubSector: Textile - Apparel Footwear & Accessories | |
| MarketCap: 224.07 Millions | |
| Recent Price: 14.03 Smart Investing & Trading Score: 74 | |
| Day Percent Change: 1.08% Day Change: 0.15 | |
| Week Change: 11.88% Year-to-date Change: -39.2% | |
| CAL Links: Profile News Message Board | |
| Charts:- Daily , Weekly | |
| Add CAL to Watchlist: View: Get Complete CAL Trend Analysis ➞ | |
 | ACCO ACCO Brands Corporation |
| Sector: Consumer Staples | |
| SubSector: Office Supplies | |
| MarketCap: 448.2 Millions | |
| Recent Price: 3.99 Smart Investing & Trading Score: 100 | |
| Day Percent Change: 2.05% Day Change: 0.08 | |
| Week Change: 11.45% Year-to-date Change: -22.8% | |
| ACCO Links: Profile News Message Board | |
| Charts:- Daily , Weekly | |
| Add ACCO to Watchlist: View: Get Complete ACCO Trend Analysis ➞ | |
 | HAIN The Hain Celestial Group, Inc. |
| Sector: Consumer Staples | |
| SubSector: Food Wholesale | |
| MarketCap: 2684.69 Millions | |
| Recent Price: 1.66 Smart Investing & Trading Score: 67 | |
| Day Percent Change: 0% Day Change: 0 | |
| Week Change: 11.41% Year-to-date Change: -73.0% | |
| HAIN Links: Profile News Message Board | |
| Charts:- Daily , Weekly | |
| Add HAIN to Watchlist: View: Get Complete HAIN Trend Analysis ➞ | |
 | EL The Estee Lauder Companies Inc. |
| Sector: Consumer Staples | |
| SubSector: Personal Products | |
| MarketCap: 59521.1 Millions | |
| Recent Price: 88.72 Smart Investing & Trading Score: 100 | |
| Day Percent Change: 0.16% Day Change: 0.14 | |
| Week Change: 10.78% Year-to-date Change: 18.9% | |
| EL Links: Profile News Message Board | |
| Charts:- Daily , Weekly | |
| Add EL to Watchlist: View: Get Complete EL Trend Analysis ➞ | |
 | FIZZ National Beverage Corp. |
| Sector: Consumer Staples | |
| SubSector: Beverages - Soft Drinks | |
| MarketCap: 2031.4 Millions | |
| Recent Price: 46.91 Smart Investing & Trading Score: 100 | |
| Day Percent Change: 4.59% Day Change: 2.06 | |
| Week Change: 10.66% Year-to-date Change: 9.9% | |
| FIZZ Links: Profile News Message Board | |
| Charts:- Daily , Weekly | |
| Add FIZZ to Watchlist: View: Get Complete FIZZ Trend Analysis ➞ | |
 | CPS Cooper-Standard Holdings Inc. |
| Sector: Consumer Staples | |
| SubSector: Auto Parts | |
| MarketCap: 184.339 Millions | |
| Recent Price: 24.06 Smart Investing & Trading Score: 100 | |
| Day Percent Change: -0.46% Day Change: -0.11 | |
| Week Change: 10.47% Year-to-date Change: 77.4% | |
| CPS Links: Profile News Message Board | |
| Charts:- Daily , Weekly | |
| Add CPS to Watchlist: View: Get Complete CPS Trend Analysis ➞ | |
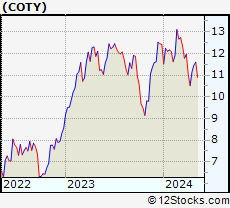 | COTY Coty Inc. |
| Sector: Consumer Staples | |
| SubSector: Personal Products | |
| MarketCap: 4023.65 Millions | |
| Recent Price: 5.09 Smart Investing & Trading Score: 87 | |
| Day Percent Change: 0% Day Change: 0 | |
| Week Change: 10.41% Year-to-date Change: -26.9% | |
| COTY Links: Profile News Message Board | |
| Charts:- Daily , Weekly | |
| Add COTY to Watchlist: View: Get Complete COTY Trend Analysis ➞ | |
 | LIND Lindblad Expeditions Holdings, Inc. |
| Sector: Consumer Staples | |
| SubSector: Recreational Goods, Other | |
| MarketCap: 220.259 Millions | |
| Recent Price: 12.79 Smart Investing & Trading Score: 100 | |
| Day Percent Change: 1.19% Day Change: 0.15 | |
| Week Change: 10.35% Year-to-date Change: 7.8% | |
| LIND Links: Profile News Message Board | |
| Charts:- Daily , Weekly | |
| Add LIND to Watchlist: View: Get Complete LIND Trend Analysis ➞ | |
 | NUS Nu Skin Enterprises, Inc. |
| Sector: Consumer Staples | |
| SubSector: Personal Products | |
| MarketCap: 1230.85 Millions | |
| Recent Price: 8.92 Smart Investing & Trading Score: 100 | |
| Day Percent Change: 1.13% Day Change: 0.1 | |
| Week Change: 10.26% Year-to-date Change: 30.5% | |
| NUS Links: Profile News Message Board | |
| Charts:- Daily , Weekly | |
| Add NUS to Watchlist: View: Get Complete NUS Trend Analysis ➞ | |
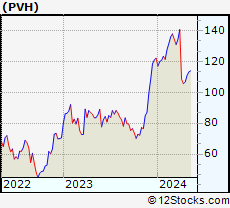 | PVH PVH Corp. |
| Sector: Consumer Staples | |
| SubSector: Textile - Apparel Clothing | |
| MarketCap: 2947.65 Millions | |
| Recent Price: 72.44 Smart Investing & Trading Score: 100 | |
| Day Percent Change: -0.97% Day Change: -0.71 | |
| Week Change: 10.19% Year-to-date Change: -31.5% | |
| PVH Links: Profile News Message Board | |
| Charts:- Daily , Weekly | |
| Add PVH to Watchlist: View: Get Complete PVH Trend Analysis ➞ | |
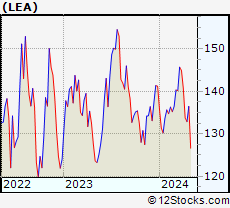 | LEA Lear Corporation |
| Sector: Consumer Staples | |
| SubSector: Auto Parts | |
| MarketCap: 5106.09 Millions | |
| Recent Price: 103.58 Smart Investing & Trading Score: 100 | |
| Day Percent Change: 0.37% Day Change: 0.38 | |
| Week Change: 9.82% Year-to-date Change: 10.3% | |
| LEA Links: Profile News Message Board | |
| Charts:- Daily , Weekly | |
| Add LEA to Watchlist: View: Get Complete LEA Trend Analysis ➞ | |
| For tabular summary view of above stock list: Summary View ➞ 0 - 25 , 25 - 50 , 50 - 75 , 75 - 100 , 100 - 125 , 125 - 150 , 150 - 175 , 175 - 200 , 200 - 225 | ||
| Click To Change The Sort Order: By Market Cap or Company Size Performance: Year-to-date, Week and Day | |
| Select Chart Type: | ||
|
Best Stocks Today 12Stocks.com |
© 2025 12Stocks.com Terms & Conditions Privacy Contact Us
All Information Provided Only For Education And Not To Be Used For Investing or Trading. See Terms & Conditions


One More Thing ... Get Best Stocks Delivered Daily!
Never Ever Miss A Move With Our Top Ten Stocks Lists
Find Best Stocks In Any Market - Bull or Bear Market
Take A Peek At Our Top Ten Stocks Lists: Daily, Weekly, Year-to-Date & Top Trends
Find Best Stocks In Any Market - Bull or Bear Market
Take A Peek At Our Top Ten Stocks Lists: Daily, Weekly, Year-to-Date & Top Trends
Consumer Staples Stocks With Best Up Trends [0-bearish to 100-bullish]: Beauty Health[100], Lifetime Brands[100], National Beverage[100], Vera Bradley[100], Superior [100], Coca-Cola European[100], Cryoport [100], Stoneridge [100], Herbalife Nutrition[100], Goodyear Tire[100], Modine [100]
Best Consumer Staples Stocks Year-to-Date:
Cooper-Standard [77.43%], Celsius [76.77%], Pitney Bowes[59.46%], REV [57.96%], Dana [55.19%], Philip Morris[49.95%], Herbalife Nutrition[49.18%], SpartanNash [46.8%], O-I Glass[44.56%], Beauty Health[43.4%], NACCO Industries[43.27%] Best Consumer Staples Stocks This Week:
Ispire Technology[29.57%], Krispy Kreme[25.28%], Lifetime Brands[24.83%], Vera Bradley[22.38%], Stoneridge [20.76%], BRC [20.45%], Beauty Health[16.92%], Helen of Troy[15.24%], Herbalife Nutrition[14.32%], Whirlpool [14.31%], Adient [13.49%] Best Consumer Staples Stocks Daily:
Beauty Health[8.06%], Lifetime Brands[6.68%], Ispire Technology[5.3%], National Beverage[4.59%], Tapestry [4.3%], Westrock Coffee[4.23%], iRobot [4.05%], Vera Bradley[3.21%], Superior [3.16%], Coca-Cola European[3.14%], Cryoport [2.96%]