
 Login Sign Up


| |||||
 |  | ||||

| 12Stocks.com Market Intelligence |
Best SmallCap Stocks
|
| In a hurry? Small Cap Stock Lists: Performance Trends Table, Stock Charts
Sort Small Cap stocks: Daily, Weekly, Year-to-Date, Market Cap & Trends. Filter Small Cap stocks list by sector: Show all, Tech, Finance, Energy, Staples, Retail, Industrial, Materials, Utilities and HealthCare Filter Small Cap stocks list by size: All Large Medium Small and MicroCap |
| 12Stocks.com Small Cap Stocks Performances & Trends Daily | |||||||||
|
|  The overall Smart Investing & Trading Score is 76 (0-bearish to 100-bullish) which puts Small Cap index in short term neutral to bullish trend. The Smart Investing & Trading Score from previous trading session is 90 and hence a deterioration of trend.
| ||||||||
Here are the Smart Investing & Trading Scores of the most requested small cap stocks at 12Stocks.com (click stock name for detailed review):
|


| 12Stocks.com: Investing in Smallcap Index with Stocks | |
|
The following table helps investors and traders sort through current performance and trends (as measured by Smart Investing & Trading Score) of various
stocks in the Smallcap Index. Quick View: Move mouse or cursor over stock symbol (ticker) to view short-term technical chart and over stock name to view long term chart. Click on  to add stock symbol to your watchlist and to add stock symbol to your watchlist and  to view watchlist. Click on any ticker or stock name for detailed market intelligence report for that stock. to view watchlist. Click on any ticker or stock name for detailed market intelligence report for that stock. |
12Stocks.com Performance of Stocks in Smallcap Index
| Ticker | Stock Name | Watchlist | Category | Recent Price | Smart Investing & Trading Score | Change % | YTD Change% |
| NEOG | Neogen |   | Health Care | 13.67 | 64 | 1.94% | -32.02% |
| GOCO | GoHealth | | Financials | 8.91 | 42 | 0.00% | -32.10% |
| SFIX | Stitch Fix | | Services & Goods | 2.42 | 42 | 1.26% | -32.21% |
| RPD | Rapid7 | | Technology | 38.69 | 42 | -1.10% | -32.24% |
| ATNI | ATN | | Technology | 26.40 | 55 | -0.15% | -32.26% |
| PZZA | Papa John | | Services & Goods | 51.56 | 10 | -1.13% | -32.36% |
| ARRY | Array | | Technology | 11.30 | 76 | -0.40% | -32.77% |
| INNV | InnovAge Holding | | Health Care | 3.82 | 20 | 0.00% | -32.98% |
| FOLD | Amicus | | Health Care | 9.43 | 35 | -0.79% | -33.58% |
| PTLO | Portillos | | Services & Goods | 10.65 | 32 | -2.43% | -33.61% |
| UDMY | Udemy | | Consumer Staples | 9.87 | 28 | -0.20% | -33.67% |
| TWKS | Thoughtworks Holding | | Technology | 3.22 | 83 | 0.31% | -33.74% |
| ALGT | Allegiant Travel | | Transports | 54.26 | 17 | -0.91% | -34.32% |
| CHRS | Coherus BioSciences | | Health Care | 2.17 | 62 | 0.00% | -34.83% |
| OM | Outset Medical | | Health Care | 3.52 | 69 | -0.14% | -35.03% |
| CTKB | Cytek Biosciences | | Health Care | 5.96 | 25 | -3.56% | -35.18% |
| EOSE | Eos Energy | | Industrials | 0.71 | 12 | 0.30% | -35.37% |
| SDGR | Schrodinger | | Health Care | 22.95 | 20 | 0.20% | -35.91% |
| UNIT | Uniti Group | | Financials | 3.69 | 10 | 1.52% | -36.25% |
| EVGO | EVgo | | Services & Goods | 2.29 | 55 | -3.18% | -36.26% |
| AUPH | Aurinia | | Health Care | 5.71 | 74 | -1.04% | -36.48% |
| CBRL | Cracker Barrel | | Services & Goods | 48.63 | 0 | -15.09% | -36.91% |
| FNA | Paragon 28 | | Health Care | 7.79 | 10 | -2.20% | -37.49% |
| ATRC | AtriCure | | Health Care | 22.30 | 37 | -1.46% | -37.52% |
| AUR | Aurora Innovation | | Technology | 2.73 | 26 | -1.26% | -37.91% |
| For chart view version of above stock list: Chart View ➞ 0 - 25 , 25 - 50 , 50 - 75 , 75 - 100 , 100 - 125 , 125 - 150 , 150 - 175 , 175 - 200 , 200 - 225 , 225 - 250 , 250 - 275 , 275 - 300 , 300 - 325 , 325 - 350 , 350 - 375 , 375 - 400 , 400 - 425 , 425 - 450 , 450 - 475 , 475 - 500 , 500 - 525 , 525 - 550 , 550 - 575 , 575 - 600 , 600 - 625 , 625 - 650 , 650 - 675 , 675 - 700 | ||
 | Click To Change The Sort Order: By Market Cap or Company Size Performance: Year-to-date, Week and Day |  |
| Too many stocks? View smallcap stocks filtered by marketcap & sector |
| Marketcap: All SmallCap Stocks (default-no microcap), Large, Mid-Range, Small |
| Smallcap Sector: Tech, Finance, Energy, Staples, Retail, Industrial, Materials, & Medical |
|
Get the most comprehensive stock market coverage daily at 12Stocks.com ➞ Best Stocks Today ➞ Best Stocks Weekly ➞ Best Stocks Year-to-Date ➞ Best Stocks Trends ➞  Best Stocks Today 12Stocks.com Best Nasdaq Stocks ➞ Best S&P 500 Stocks ➞ Best Tech Stocks ➞ Best Biotech Stocks ➞ |
| Detailed Overview of SmallCap Stocks |
| SmallCap Technical Overview, Leaders & Laggards, Top SmallCap ETF Funds & Detailed SmallCap Stocks List, Charts, Trends & More |
| Smallcap: Technical Analysis, Trends & YTD Performance | |
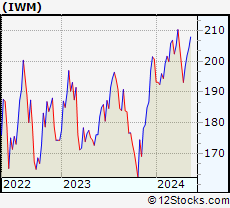
| SmallCap segment as represented by
IWM, an exchange-traded fund [ETF], holds basket of thousands of smallcap stocks from across all major sectors of the US stock market. The smallcap index (contains stocks like Riverbed & Sotheby's) is up by 3.74% and is currently underperforming the overall market by -6.66% year-to-date. Below is a quick view of technical charts and trends: | |
 IWM Weekly Chart |
|
| Long Term Trend: Very Good | |
| Medium Term Trend: Very Good | |
 IWM Daily Chart |
|
| Short Term Trend: Good | |
| Overall Trend Score: 76 | |
| YTD Performance: 3.74% | |
| **Trend Scores & Views Are Only For Educational Purposes And Not For Investing | |
| 12Stocks.com: Top Performing Small Cap Index Stocks | ||||||||||||||||||||||||||||||||||||||||||||||||
 The top performing Small Cap Index stocks year to date are
Now, more recently, over last week, the top performing Small Cap Index stocks on the move are


|
||||||||||||||||||||||||||||||||||||||||||||||||
| 12Stocks.com: Investing in Smallcap Index using Exchange Traded Funds | |
|
The following table shows list of key exchange traded funds (ETF) that
help investors track Smallcap index. The following list also includes leveraged ETF funds that track twice or thrice the daily returns of Smallcap indices. Short or inverse ETF funds move in the opposite direction to the index they track and are useful during market pullbacks or during bear markets. Quick View: Move mouse or cursor over ETF symbol (ticker) to view short-term technical chart and over ETF name to view long term chart. Click on ticker or stock name for detailed view. Click on to add stock symbol to your watchlist and to view watchlist. |
12Stocks.com List of ETFs that track Smallcap Index
| Ticker | ETF Name | Watchlist | Recent Price | Smart Investing & Trading Score | Change % | Week % | Year-to-date % |
| IWM | iShares Russell 2000 | | 208.22 | 76 | 0.14 | 1.92 | 3.74% |
| VTWO | Vanguard Russell 2000 ETF | | 84.23 | 78 | 0.14 | 1.94 | 3.86% |
| IJR | iShares Core S&P Small-Cap | | 110.44 | 76 | -0.17 | 1.34 | 2.03% |
| IWN | iShares Russell 2000 Value | | 158.65 | 76 | -0.11 | 1.57 | 2.13% |
| IWO | iShares Russell 2000 Growth | | 265.60 | 70 | -0.58 | 2.19 | 5.3% |
| IJS | iShares S&P Small-Cap 600 Value | | 101.96 | 76 | -0.06 | 1.43 | -1.08% |
| IJT | iShares S&P Small-Cap 600 Growth | | 131.39 | 71 | 0.08 | 1.18 | 4.99% |
| XSLV | PowerShares S&P SmallCap Low Volatil ETF | | 44.51 | 83 | 0.07 | 0.63 | 0.82% |
| SMLV | SPDR SSGA US Small Cap Low Volatil ETF | | 112.80 | 90 | 0.01 | 1.42 | 0.25% |
| SAA | ProShares Ultra SmallCap600 | | 24.93 | 71 | 0.61 | 2.38 | -0.08% |
| SBB | ProShares Short SmallCap600 | | 15.71 | 18 | 0.01 | -1.52 | -1.37% |
| SDD | ProShares UltraShort SmallCap600 | | 17.72 | 20 | 0.31 | -3.04 | -3.81% |
| 12Stocks.com: Charts, Trends, Fundamental Data and Performances of SmallCap Stocks | |
|
We now take in-depth look at all SmallCap stocks including charts, multi-period performances and overall trends (as measured by Smart Investing & Trading Score). One can sort SmallCap stocks (click link to choose) by Daily, Weekly and by Year-to-Date performances. Also, one can sort by size of the company or by market capitalization. |
| Select Your Default Chart Type: | |||||
| |||||
| Click on stock symbol or name for detailed view. Click on to add stock symbol to your watchlist and to view watchlist. Quick View: Move mouse or cursor over "Daily" to quickly view daily technical stock chart and over "Weekly" to view weekly technical stock chart. | |||||

 | NEOG Neogen Corporation |
| Sector: Health Care | |
| SubSector: Diagnostic Substances | |
| MarketCap: 3234.71 Millions | |
| Recent Price: 13.67 Smart Investing & Trading Score: 64 | |
| Day Percent Change: 1.94% Day Change: 0.26 | |
| Week Change: 10.87% Year-to-date Change: -32.0% | |
| NEOG Links: Profile News Message Board | |
| Charts:- Daily , Weekly | |
| Add NEOG to Watchlist: View: Get Complete NEOG Trend Analysis ➞ | |
 | GOCO GoHealth, Inc. |
| Sector: Financials | |
| SubSector: Insurance Brokers | |
| MarketCap: 44157 Millions | |
| Recent Price: 8.91 Smart Investing & Trading Score: 42 | |
| Day Percent Change: 0.00% Day Change: 0.00 | |
| Week Change: -1.05% Year-to-date Change: -32.1% | |
| GOCO Links: Profile News Message Board | |
| Charts:- Daily , Weekly | |
| Add GOCO to Watchlist: View: Get Complete GOCO Trend Analysis ➞ | |
 | SFIX Stitch Fix, Inc. |
| Sector: Services & Goods | |
| SubSector: Specialty Retail, Other | |
| MarketCap: 1693.64 Millions | |
| Recent Price: 2.42 Smart Investing & Trading Score: 42 | |
| Day Percent Change: 1.26% Day Change: 0.03 | |
| Week Change: 15.24% Year-to-date Change: -32.2% | |
| SFIX Links: Profile News Message Board | |
| Charts:- Daily , Weekly | |
| Add SFIX to Watchlist: View: Get Complete SFIX Trend Analysis ➞ | |
 | RPD Rapid7, Inc. |
| Sector: Technology | |
| SubSector: Application Software | |
| MarketCap: 1981.12 Millions | |
| Recent Price: 38.69 Smart Investing & Trading Score: 42 | |
| Day Percent Change: -1.10% Day Change: -0.43 | |
| Week Change: 2.22% Year-to-date Change: -32.2% | |
| RPD Links: Profile News Message Board | |
| Charts:- Daily , Weekly | |
| Add RPD to Watchlist: View: Get Complete RPD Trend Analysis ➞ | |
 | ATNI ATN International, Inc. |
| Sector: Technology | |
| SubSector: Telecom Services - Domestic | |
| MarketCap: 1014.77 Millions | |
| Recent Price: 26.40 Smart Investing & Trading Score: 55 | |
| Day Percent Change: -0.15% Day Change: -0.04 | |
| Week Change: 6.49% Year-to-date Change: -32.3% | |
| ATNI Links: Profile News Message Board | |
| Charts:- Daily , Weekly | |
| Add ATNI to Watchlist: View: Get Complete ATNI Trend Analysis ➞ | |
 | PZZA Papa John s International, Inc. |
| Sector: Services & Goods | |
| SubSector: Specialty Eateries | |
| MarketCap: 1925.27 Millions | |
| Recent Price: 51.56 Smart Investing & Trading Score: 10 | |
| Day Percent Change: -1.13% Day Change: -0.59 | |
| Week Change: -3.3% Year-to-date Change: -32.4% | |
| PZZA Links: Profile News Message Board | |
| Charts:- Daily , Weekly | |
| Add PZZA to Watchlist: View: Get Complete PZZA Trend Analysis ➞ | |
 | ARRY Array Technologies, Inc. |
| Sector: Technology | |
| SubSector: Solar | |
| MarketCap: 45887 Millions | |
| Recent Price: 11.30 Smart Investing & Trading Score: 76 | |
| Day Percent Change: -0.40% Day Change: -0.04 | |
| Week Change: -11.48% Year-to-date Change: -32.8% | |
| ARRY Links: Profile News Message Board | |
| Charts:- Daily , Weekly | |
| Add ARRY to Watchlist: View: Get Complete ARRY Trend Analysis ➞ | |
 | INNV InnovAge Holding Corp. |
| Sector: Health Care | |
| SubSector: Medical Care Facilities | |
| MarketCap: 1010 Millions | |
| Recent Price: 3.82 Smart Investing & Trading Score: 20 | |
| Day Percent Change: 0.00% Day Change: 0.00 | |
| Week Change: -6.37% Year-to-date Change: -33.0% | |
| INNV Links: Profile News Message Board | |
| Charts:- Daily , Weekly | |
| Add INNV to Watchlist: View: Get Complete INNV Trend Analysis ➞ | |
 | FOLD Amicus Therapeutics, Inc. |
| Sector: Health Care | |
| SubSector: Biotechnology | |
| MarketCap: 2676.75 Millions | |
| Recent Price: 9.43 Smart Investing & Trading Score: 35 | |
| Day Percent Change: -0.79% Day Change: -0.07 | |
| Week Change: 2.11% Year-to-date Change: -33.6% | |
| FOLD Links: Profile News Message Board | |
| Charts:- Daily , Weekly | |
| Add FOLD to Watchlist: View: Get Complete FOLD Trend Analysis ➞ | |
 | PTLO Portillos Inc. |
| Sector: Services & Goods | |
| SubSector: Restaurants | |
| MarketCap: 1590 Millions | |
| Recent Price: 10.65 Smart Investing & Trading Score: 32 | |
| Day Percent Change: -2.43% Day Change: -0.27 | |
| Week Change: 5.39% Year-to-date Change: -33.6% | |
| PTLO Links: Profile News Message Board | |
| Charts:- Daily , Weekly | |
| Add PTLO to Watchlist: View: Get Complete PTLO Trend Analysis ➞ | |
 | UDMY Udemy, Inc. |
| Sector: Consumer Staples | |
| SubSector: Education & Training Services | |
| MarketCap: 1570 Millions | |
| Recent Price: 9.87 Smart Investing & Trading Score: 28 | |
| Day Percent Change: -0.20% Day Change: -0.02 | |
| Week Change: 0% Year-to-date Change: -33.7% | |
| UDMY Links: Profile News Message Board | |
| Charts:- Daily , Weekly | |
| Add UDMY to Watchlist: View: Get Complete UDMY Trend Analysis ➞ | |
 | TWKS Thoughtworks Holding, Inc. |
| Sector: Technology | |
| SubSector: Information Technology Services | |
| MarketCap: 2370 Millions | |
| Recent Price: 3.22 Smart Investing & Trading Score: 83 | |
| Day Percent Change: 0.31% Day Change: 0.01 | |
| Week Change: 10.65% Year-to-date Change: -33.7% | |
| TWKS Links: Profile News Message Board | |
| Charts:- Daily , Weekly | |
| Add TWKS to Watchlist: View: Get Complete TWKS Trend Analysis ➞ | |
 | ALGT Allegiant Travel Company |
| Sector: Transports | |
| SubSector: Regional Airlines | |
| MarketCap: 1317.7 Millions | |
| Recent Price: 54.26 Smart Investing & Trading Score: 17 | |
| Day Percent Change: -0.91% Day Change: -0.50 | |
| Week Change: 1.53% Year-to-date Change: -34.3% | |
| ALGT Links: Profile News Message Board | |
| Charts:- Daily , Weekly | |
| Add ALGT to Watchlist: View: Get Complete ALGT Trend Analysis ➞ | |
 | CHRS Coherus BioSciences, Inc. |
| Sector: Health Care | |
| SubSector: Biotechnology | |
| MarketCap: 1073.45 Millions | |
| Recent Price: 2.17 Smart Investing & Trading Score: 62 | |
| Day Percent Change: 0.00% Day Change: 0.00 | |
| Week Change: 14.21% Year-to-date Change: -34.8% | |
| CHRS Links: Profile News Message Board | |
| Charts:- Daily , Weekly | |
| Add CHRS to Watchlist: View: Get Complete CHRS Trend Analysis ➞ | |
 | OM Outset Medical, Inc. |
| Sector: Health Care | |
| SubSector: Medical Devices | |
| MarketCap: 21787 Millions | |
| Recent Price: 3.52 Smart Investing & Trading Score: 69 | |
| Day Percent Change: -0.14% Day Change: 0.00 | |
| Week Change: 14.5% Year-to-date Change: -35.0% | |
| OM Links: Profile News Message Board | |
| Charts:- Daily , Weekly | |
| Add OM to Watchlist: View: Get Complete OM Trend Analysis ➞ | |
 | CTKB Cytek Biosciences, Inc. |
| Sector: Health Care | |
| SubSector: Medical Devices | |
| MarketCap: 1140 Millions | |
| Recent Price: 5.96 Smart Investing & Trading Score: 25 | |
| Day Percent Change: -3.56% Day Change: -0.22 | |
| Week Change: -5.4% Year-to-date Change: -35.2% | |
| CTKB Links: Profile News Message Board | |
| Charts:- Daily , Weekly | |
| Add CTKB to Watchlist: View: Get Complete CTKB Trend Analysis ➞ | |
 | EOSE Eos Energy Enterprises, Inc. |
| Sector: Industrials | |
| SubSector: Electrical Equipment & Parts | |
| MarketCap: 76627 Millions | |
| Recent Price: 0.71 Smart Investing & Trading Score: 12 | |
| Day Percent Change: 0.30% Day Change: 0.00 | |
| Week Change: -2.37% Year-to-date Change: -35.4% | |
| EOSE Links: Profile News Message Board | |
| Charts:- Daily , Weekly | |
| Add EOSE to Watchlist: View: Get Complete EOSE Trend Analysis ➞ | |
 | SDGR Schrodinger, Inc. |
| Sector: Health Care | |
| SubSector: Health Information Services | |
| MarketCap: 47287 Millions | |
| Recent Price: 22.95 Smart Investing & Trading Score: 20 | |
| Day Percent Change: 0.20% Day Change: 0.05 | |
| Week Change: 1.17% Year-to-date Change: -35.9% | |
| SDGR Links: Profile News Message Board | |
| Charts:- Daily , Weekly | |
| Add SDGR to Watchlist: View: Get Complete SDGR Trend Analysis ➞ | |
 | UNIT Uniti Group Inc. |
| Sector: Financials | |
| SubSector: REIT - Industrial | |
| MarketCap: 1363.09 Millions | |
| Recent Price: 3.69 Smart Investing & Trading Score: 10 | |
| Day Percent Change: 1.52% Day Change: 0.06 | |
| Week Change: -4.78% Year-to-date Change: -36.3% | |
| UNIT Links: Profile News Message Board | |
| Charts:- Daily , Weekly | |
| Add UNIT to Watchlist: View: Get Complete UNIT Trend Analysis ➞ | |
 | EVGO EVgo, Inc. |
| Sector: Services & Goods | |
| SubSector: Specialty Retail | |
| MarketCap: 1140 Millions | |
| Recent Price: 2.29 Smart Investing & Trading Score: 55 | |
| Day Percent Change: -3.18% Day Change: -0.07 | |
| Week Change: 22.85% Year-to-date Change: -36.3% | |
| EVGO Links: Profile News Message Board | |
| Charts:- Daily , Weekly | |
| Add EVGO to Watchlist: View: Get Complete EVGO Trend Analysis ➞ | |
 | AUPH Aurinia Pharmaceuticals Inc. |
| Sector: Health Care | |
| SubSector: Biotechnology | |
| MarketCap: 1319.75 Millions | |
| Recent Price: 5.71 Smart Investing & Trading Score: 74 | |
| Day Percent Change: -1.04% Day Change: -0.06 | |
| Week Change: 13.75% Year-to-date Change: -36.5% | |
| AUPH Links: Profile News Message Board | |
| Charts:- Daily , Weekly | |
| Add AUPH to Watchlist: View: Get Complete AUPH Trend Analysis ➞ | |
 | CBRL Cracker Barrel Old Country Store, Inc. |
| Sector: Services & Goods | |
| SubSector: Restaurants | |
| MarketCap: 1839.6 Millions | |
| Recent Price: 48.63 Smart Investing & Trading Score: 0 | |
| Day Percent Change: -15.09% Day Change: -8.64 | |
| Week Change: -13.58% Year-to-date Change: -36.9% | |
| CBRL Links: Profile News Message Board | |
| Charts:- Daily , Weekly | |
| Add CBRL to Watchlist: View: Get Complete CBRL Trend Analysis ➞ | |
 | FNA Paragon 28, Inc. |
| Sector: Health Care | |
| SubSector: Medical Devices | |
| MarketCap: 1420 Millions | |
| Recent Price: 7.79 Smart Investing & Trading Score: 10 | |
| Day Percent Change: -2.20% Day Change: -0.17 | |
| Week Change: 0.58% Year-to-date Change: -37.5% | |
| FNA Links: Profile News Message Board | |
| Charts:- Daily , Weekly | |
| Add FNA to Watchlist: View: Get Complete FNA Trend Analysis ➞ | |
 | ATRC AtriCure, Inc. |
| Sector: Health Care | |
| SubSector: Medical Instruments & Supplies | |
| MarketCap: 1158.7 Millions | |
| Recent Price: 22.30 Smart Investing & Trading Score: 37 | |
| Day Percent Change: -1.46% Day Change: -0.33 | |
| Week Change: 0% Year-to-date Change: -37.5% | |
| ATRC Links: Profile News Message Board | |
| Charts:- Daily , Weekly | |
| Add ATRC to Watchlist: View: Get Complete ATRC Trend Analysis ➞ | |
 | AUR Aurora Innovation, Inc. |
| Sector: Technology | |
| SubSector: Information Technology Services | |
| MarketCap: 3220 Millions | |
| Recent Price: 2.73 Smart Investing & Trading Score: 26 | |
| Day Percent Change: -1.26% Day Change: -0.04 | |
| Week Change: -15.06% Year-to-date Change: -37.9% | |
| AUR Links: Profile News Message Board | |
| Charts:- Daily , Weekly | |
| Add AUR to Watchlist: View: Get Complete AUR Trend Analysis ➞ | |
| For tabular summary view of above stock list: Summary View ➞ 0 - 25 , 25 - 50 , 50 - 75 , 75 - 100 , 100 - 125 , 125 - 150 , 150 - 175 , 175 - 200 , 200 - 225 , 225 - 250 , 250 - 275 , 275 - 300 , 300 - 325 , 325 - 350 , 350 - 375 , 375 - 400 , 400 - 425 , 425 - 450 , 450 - 475 , 475 - 500 , 500 - 525 , 525 - 550 , 550 - 575 , 575 - 600 , 600 - 625 , 625 - 650 , 650 - 675 , 675 - 700 | ||
| Click To Change The Sort Order: By Market Cap or Company Size Performance: Year-to-date, Week and Day | |
| Select Chart Type: | ||
| Too many stocks? View smallcap stocks filtered by marketcap & sector |
| Marketcap: All SmallCap Stocks (default-no microcap), Large, Mid-Range, Small & MicroCap |
| Sector: Tech, Finance, Energy, Staples, Retail, Industrial, Materials, Utilities & Medical |
|
Best Stocks Today 12Stocks.com |
© 2024 12Stocks.com Terms & Conditions Privacy Contact Us
All Information Provided Only For Education And Not To Be Used For Investing or Trading. See Terms & Conditions


One More Thing ... Get Best Stocks Delivered Daily!
Never Ever Miss A Move With Our Top Ten Stocks Lists
Find Best Stocks In Any Market - Bull or Bear Market
Take A Peek At Our Top Ten Stocks Lists: Daily, Weekly, Year-to-Date & Top Trends
Find Best Stocks In Any Market - Bull or Bear Market
Take A Peek At Our Top Ten Stocks Lists: Daily, Weekly, Year-to-Date & Top Trends
Smallcap Stocks With Best Up Trends [0-bearish to 100-bullish]: Hecla Mining[100], Coeur Mining[100], MicroStrategy [100], Fossil Group[100], Energy Fuels[100], NovaGold Resources[100], Gannett Co[100], Rayonier Advanced[100], Shore Bancshares[100], Arbutus Biopharma[100], Palomar [100]
Best Smallcap Stocks Year-to-Date:
CareMax [471.13%], Bakkt [364.13%], Janux [340.72%], Viking [266.74%], Longboard [233.72%], Super Micro[220.71%], Avidity Biosciences[220.69%], Sweetgreen [180.18%], Novavax [175.1%], Vera [170.54%], Arcutis Bio[169.5%] Best Smallcap Stocks This Week:
Maxeon Solar[49.31%], Novavax [48.7%], MacroGenics [44.71%], Fossil Group[37.51%], Humacyte [37.02%], Workhorse Group[36.06%], ProKidney [34.88%], Allbirds [34.21%], Tellurian [33.56%], MicroStrategy [32.16%], Emergent BioSolutions[31.72%] Best Smallcap Stocks Daily:
Presto Automation[23.56%], Sangamo [10.71%], Children s[10.61%], Hecla Mining[10.56%], Coeur Mining[9.68%], Emergent BioSolutions[8.73%], MicroStrategy [8.35%], Tellurian [7.43%], American Vanguard[7.42%], Fossil Group[6.83%], Energy Fuels[6.67%]