
 Login Sign Up


| |||||
 |  | ||||

| 12Stocks.com Market Intelligence |
Best SmallCap Stocks
|
| In a hurry? Small Cap Stock Lists: Performance Trends Table, Stock Charts
Sort Small Cap stocks: Daily, Weekly, Year-to-Date, Market Cap & Trends. Filter Small Cap stocks list by sector: Show all, Tech, Finance, Energy, Staples, Retail, Industrial, Materials, Utilities and HealthCare Filter Small Cap stocks list by size: All Large Medium Small and MicroCap |
| 12Stocks.com Small Cap Stocks Performances & Trends Daily | |||||||||
|
|  The overall Smart Investing & Trading Score is 83 (0-bearish to 100-bullish) which puts Small Cap index in short term bullish trend. The Smart Investing & Trading Score from previous trading session is 76 and hence an improvement of trend.
| ||||||||
Here are the Smart Investing & Trading Scores of the most requested small cap stocks at 12Stocks.com (click stock name for detailed review):
|


| 12Stocks.com: Investing in Smallcap Index with Stocks | |
|
The following table helps investors and traders sort through current performance and trends (as measured by Smart Investing & Trading Score) of various
stocks in the Smallcap Index. Quick View: Move mouse or cursor over stock symbol (ticker) to view short-term technical chart and over stock name to view long term chart. Click on  to add stock symbol to your watchlist and to add stock symbol to your watchlist and  to view watchlist. Click on any ticker or stock name for detailed market intelligence report for that stock. to view watchlist. Click on any ticker or stock name for detailed market intelligence report for that stock. |
12Stocks.com Performance of Stocks in Smallcap Index
| Ticker | Stock Name | Watchlist | Category | Recent Price | Smart Investing & Trading Score | Change % | YTD Change% |
| BATRA | Liberty Braves |   | Services & Goods | 41.60 | 70 | -1.00% | -2.76% |
| PRLD | Prelude | | Health Care | 4.23 | 44 | 5.75% | -2.76% |
| CRDO | Credo | | Technology | 19.02 | 52 | 0.69% | -2.76% |
| DEI | Douglas Emmett | | Financials | 14.09 | 61 | -0.63% | -2.83% |
| JOE | St. Joe | | Financials | 58.46 | 26 | 0.41% | -2.86% |
| PTVE | Pactiv Evergreen | | Services & Goods | 13.32 | 42 | -1.04% | -2.92% |
| FWRG | First Watch | | Services & Goods | 19.34 | 18 | 2.17% | -2.96% |
| SHO | Sunstone Hotel | | Financials | 10.40 | 52 | -0.10% | -3.08% |
| ENR | Energizer | | Consumer Staples | 30.64 | 68 | 0.52% | -3.28% |
| CNS | Cohen & Steers | | Financials | 73.11 | 57 | -0.27% | -3.46% |
| ESRT | Empire State | | Financials | 9.35 | 25 | -1.99% | -3.51% |
| TGTX | TG | | Health Care | 16.48 | 35 | 0.00% | -3.51% |
| SWI | SolarWinds | | Technology | 12.05 | 64 | -0.74% | -3.52% |
| NUVL | Nuvalent | | Health Care | 70.87 | 30 | -0.01% | -3.57% |
| VIR | Vir | | Health Care | 9.70 | 20 | -0.31% | -3.58% |
| RHP | Ryman Hospitality | | Financials | 106.04 | 40 | 0.64% | -3.65% |
| AWR | American States | | Utilities | 77.47 | 69 | -1.05% | -3.67% |
| DAN | Dana | | Consumer Staples | 14.07 | 90 | 0.29% | -3.70% |
| MFA | MFA Financial | | Financials | 10.85 | 35 | -1.54% | -3.73% |
| ENS | EnerSys | | Industrials | 97.17 | 68 | 0.83% | -3.75% |
| RRR | Red Rock | | Transports | 51.26 | 28 | -0.12% | -3.88% |
| FBRT | Franklin BSP | | Financials | 13.10 | 83 | -0.30% | -3.88% |
| ALIT | Alight | | Technology | 8.18 | 39 | 1.61% | -3.88% |
| PEB | Pebblebrook Hotel | | Financials | 15.33 | 74 | 0.26% | -4.07% |
| NTCT | NetScout Systems | | Technology | 21.05 | 69 | -0.52% | -4.10% |
| For chart view version of above stock list: Chart View ➞ 0 - 25 , 25 - 50 , 50 - 75 , 75 - 100 , 100 - 125 , 125 - 150 , 150 - 175 , 175 - 200 , 200 - 225 , 225 - 250 , 250 - 275 , 275 - 300 , 300 - 325 , 325 - 350 , 350 - 375 , 375 - 400 , 400 - 425 , 425 - 450 , 450 - 475 , 475 - 500 , 500 - 525 , 525 - 550 , 550 - 575 , 575 - 600 , 600 - 625 , 625 - 650 , 650 - 675 , 675 - 700 | ||
 | Click To Change The Sort Order: By Market Cap or Company Size Performance: Year-to-date, Week and Day |  |
| Too many stocks? View smallcap stocks filtered by marketcap & sector |
| Marketcap: All SmallCap Stocks (default-no microcap), Large, Mid-Range, Small |
| Smallcap Sector: Tech, Finance, Energy, Staples, Retail, Industrial, Materials, & Medical |
|
Get the most comprehensive stock market coverage daily at 12Stocks.com ➞ Best Stocks Today ➞ Best Stocks Weekly ➞ Best Stocks Year-to-Date ➞ Best Stocks Trends ➞  Best Stocks Today 12Stocks.com Best Nasdaq Stocks ➞ Best S&P 500 Stocks ➞ Best Tech Stocks ➞ Best Biotech Stocks ➞ |
| Detailed Overview of SmallCap Stocks |
| SmallCap Technical Overview, Leaders & Laggards, Top SmallCap ETF Funds & Detailed SmallCap Stocks List, Charts, Trends & More |
| Smallcap: Technical Analysis, Trends & YTD Performance | |
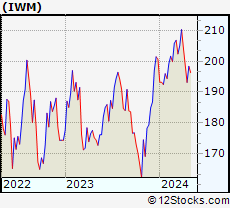
| SmallCap segment as represented by
IWM, an exchange-traded fund [ETF], holds basket of thousands of smallcap stocks from across all major sectors of the US stock market. The smallcap index (contains stocks like Riverbed & Sotheby's) is up by 3.9% and is currently underperforming the overall market by -6.79% year-to-date. Below is a quick view of technical charts and trends: | |
 IWM Weekly Chart |
|
| Long Term Trend: Very Good | |
| Medium Term Trend: Very Good | |
 IWM Daily Chart |
|
| Short Term Trend: Not Good | |
| Overall Trend Score: 83 | |
| YTD Performance: 3.9% | |
| **Trend Scores & Views Are Only For Educational Purposes And Not For Investing | |
| 12Stocks.com: Top Performing Small Cap Index Stocks | ||||||||||||||||||||||||||||||||||||||||||||||||
 The top performing Small Cap Index stocks year to date are
Now, more recently, over last week, the top performing Small Cap Index stocks on the move are


|
||||||||||||||||||||||||||||||||||||||||||||||||
| 12Stocks.com: Investing in Smallcap Index using Exchange Traded Funds | |
|
The following table shows list of key exchange traded funds (ETF) that
help investors track Smallcap index. The following list also includes leveraged ETF funds that track twice or thrice the daily returns of Smallcap indices. Short or inverse ETF funds move in the opposite direction to the index they track and are useful during market pullbacks or during bear markets. Quick View: Move mouse or cursor over ETF symbol (ticker) to view short-term technical chart and over ETF name to view long term chart. Click on ticker or stock name for detailed view. Click on to add stock symbol to your watchlist and to view watchlist. |
12Stocks.com List of ETFs that track Smallcap Index
| Ticker | ETF Name | Watchlist | Recent Price | Smart Investing & Trading Score | Change % | Week % | Year-to-date % |
| IWM | iShares Russell 2000 | | 208.54 | 83 | 0.22 | 0.22 | 3.9% |
| IJR | iShares Core S&P Small-Cap | | 110.25 | 76 | -0.13 | -0.13 | 1.84% |
| IWN | iShares Russell 2000 Value | | 158.19 | 76 | -0.33 | -0.33 | 1.84% |
| VTWO | Vanguard Russell 2000 ETF | | 84.35 | 71 | 0.29 | 0.29 | 4.01% |
| IWO | iShares Russell 2000 Growth | | 267.39 | 76 | 0.84 | 0.84 | 6.01% |
| IJS | iShares S&P Small-Cap 600 Value | | 101.20 | 69 | -0.66 | -0.66 | -1.81% |
| IJT | iShares S&P Small-Cap 600 Growth | | 131.84 | 76 | 0.38 | 0.38 | 5.35% |
| XSLV | PowerShares S&P SmallCap Low Volatil ETF | | 44.34 | 69 | -0.30 | -0.3 | 0.43% |
| SMLV | SPDR SSGA US Small Cap Low Volatil ETF | | 112.98 | 69 | -0.26 | -0.26 | 0.41% |
| SAA | ProShares Ultra SmallCap600 | | 25.10 | 68 | 0.79 | 0.79 | 0.6% |
| SBB | ProShares Short SmallCap600 | | 15.72 | 30 | -0.34 | -0.34 | -1.32% |
| SDD | ProShares UltraShort SmallCap600 | | 17.73 | 40 | -0.61 | -0.61 | -3.78% |
| 12Stocks.com: Charts, Trends, Fundamental Data and Performances of SmallCap Stocks | |
|
We now take in-depth look at all SmallCap stocks including charts, multi-period performances and overall trends (as measured by Smart Investing & Trading Score). One can sort SmallCap stocks (click link to choose) by Daily, Weekly and by Year-to-Date performances. Also, one can sort by size of the company or by market capitalization. |
| Select Your Default Chart Type: | |||||
| |||||
| Click on stock symbol or name for detailed view. Click on to add stock symbol to your watchlist and to view watchlist. Quick View: Move mouse or cursor over "Daily" to quickly view daily technical stock chart and over "Weekly" to view weekly technical stock chart. | |||||

 | BATRA The Liberty Braves Group |
| Sector: Services & Goods | |
| SubSector: Broadcasting - TV | |
| MarketCap: 18873.5 Millions | |
| Recent Price: 41.60 Smart Investing & Trading Score: 70 | |
| Day Percent Change: -1.00% Day Change: -0.42 | |
| Week Change: -1% Year-to-date Change: -2.8% | |
| BATRA Links: Profile News Message Board | |
| Charts:- Daily , Weekly | |
| Add BATRA to Watchlist: View: Get Complete BATRA Trend Analysis ➞ | |
 | PRLD Prelude Therapeutics Incorporated |
| Sector: Health Care | |
| SubSector: Biotechnology | |
| MarketCap: 26087 Millions | |
| Recent Price: 4.23 Smart Investing & Trading Score: 44 | |
| Day Percent Change: 5.75% Day Change: 0.23 | |
| Week Change: 5.75% Year-to-date Change: -2.8% | |
| PRLD Links: Profile News Message Board | |
| Charts:- Daily , Weekly | |
| Add PRLD to Watchlist: View: Get Complete PRLD Trend Analysis ➞ | |
 | CRDO Credo Technology Group Holding Ltd |
| Sector: Technology | |
| SubSector: Communication Equipment | |
| MarketCap: 2590 Millions | |
| Recent Price: 19.02 Smart Investing & Trading Score: 52 | |
| Day Percent Change: 0.69% Day Change: 0.13 | |
| Week Change: 0.69% Year-to-date Change: -2.8% | |
| CRDO Links: Profile News Message Board | |
| Charts:- Daily , Weekly | |
| Add CRDO to Watchlist: View: Get Complete CRDO Trend Analysis ➞ | |
 | DEI Douglas Emmett, Inc. |
| Sector: Financials | |
| SubSector: REIT - Diversified | |
| MarketCap: 4917.83 Millions | |
| Recent Price: 14.09 Smart Investing & Trading Score: 61 | |
| Day Percent Change: -0.63% Day Change: -0.09 | |
| Week Change: -0.63% Year-to-date Change: -2.8% | |
| DEI Links: Profile News Message Board | |
| Charts:- Daily , Weekly | |
| Add DEI to Watchlist: View: Get Complete DEI Trend Analysis ➞ | |
 | JOE The St. Joe Company |
| Sector: Financials | |
| SubSector: Real Estate Development | |
| MarketCap: 1029.39 Millions | |
| Recent Price: 58.46 Smart Investing & Trading Score: 26 | |
| Day Percent Change: 0.41% Day Change: 0.24 | |
| Week Change: 0.41% Year-to-date Change: -2.9% | |
| JOE Links: Profile News Message Board | |
| Charts:- Daily , Weekly | |
| Add JOE to Watchlist: View: Get Complete JOE Trend Analysis ➞ | |
 | PTVE Pactiv Evergreen Inc. |
| Sector: Services & Goods | |
| SubSector: Packaging & Containers | |
| MarketCap: 33427 Millions | |
| Recent Price: 13.32 Smart Investing & Trading Score: 42 | |
| Day Percent Change: -1.04% Day Change: -0.14 | |
| Week Change: -1.04% Year-to-date Change: -2.9% | |
| PTVE Links: Profile News Message Board | |
| Charts:- Daily , Weekly | |
| Add PTVE to Watchlist: View: Get Complete PTVE Trend Analysis ➞ | |
 | FWRG First Watch Restaurant Group, Inc. |
| Sector: Services & Goods | |
| SubSector: Restaurants | |
| MarketCap: 1000 Millions | |
| Recent Price: 19.34 Smart Investing & Trading Score: 18 | |
| Day Percent Change: 2.17% Day Change: 0.41 | |
| Week Change: 2.17% Year-to-date Change: -3.0% | |
| FWRG Links: Profile News Message Board | |
| Charts:- Daily , Weekly | |
| Add FWRG to Watchlist: View: Get Complete FWRG Trend Analysis ➞ | |
 | SHO Sunstone Hotel Investors, Inc. |
| Sector: Financials | |
| SubSector: REIT - Hotel/Motel | |
| MarketCap: 1861.04 Millions | |
| Recent Price: 10.40 Smart Investing & Trading Score: 52 | |
| Day Percent Change: -0.10% Day Change: -0.01 | |
| Week Change: -0.1% Year-to-date Change: -3.1% | |
| SHO Links: Profile News Message Board | |
| Charts:- Daily , Weekly | |
| Add SHO to Watchlist: View: Get Complete SHO Trend Analysis ➞ | |
 | ENR Energizer Holdings, Inc. |
| Sector: Consumer Staples | |
| SubSector: Personal Products | |
| MarketCap: 2469.55 Millions | |
| Recent Price: 30.64 Smart Investing & Trading Score: 68 | |
| Day Percent Change: 0.52% Day Change: 0.16 | |
| Week Change: 0.52% Year-to-date Change: -3.3% | |
| ENR Links: Profile News Message Board | |
| Charts:- Daily , Weekly | |
| Add ENR to Watchlist: View: Get Complete ENR Trend Analysis ➞ | |
 | CNS Cohen & Steers, Inc. |
| Sector: Financials | |
| SubSector: Asset Management | |
| MarketCap: 2082.43 Millions | |
| Recent Price: 73.11 Smart Investing & Trading Score: 57 | |
| Day Percent Change: -0.27% Day Change: -0.20 | |
| Week Change: -0.27% Year-to-date Change: -3.5% | |
| CNS Links: Profile News Message Board | |
| Charts:- Daily , Weekly | |
| Add CNS to Watchlist: View: Get Complete CNS Trend Analysis ➞ | |
 | ESRT Empire State Realty Trust, Inc. |
| Sector: Financials | |
| SubSector: REIT - Diversified | |
| MarketCap: 1632.13 Millions | |
| Recent Price: 9.35 Smart Investing & Trading Score: 25 | |
| Day Percent Change: -1.99% Day Change: -0.19 | |
| Week Change: -1.99% Year-to-date Change: -3.5% | |
| ESRT Links: Profile News Message Board | |
| Charts:- Daily , Weekly | |
| Add ESRT to Watchlist: View: Get Complete ESRT Trend Analysis ➞ | |
 | TGTX TG Therapeutics, Inc. |
| Sector: Health Care | |
| SubSector: Biotechnology | |
| MarketCap: 1022.85 Millions | |
| Recent Price: 16.48 Smart Investing & Trading Score: 35 | |
| Day Percent Change: 0.00% Day Change: 0.00 | |
| Week Change: 0% Year-to-date Change: -3.5% | |
| TGTX Links: Profile News Message Board | |
| Charts:- Daily , Weekly | |
| Add TGTX to Watchlist: View: Get Complete TGTX Trend Analysis ➞ | |
 | SWI SolarWinds Corporation |
| Sector: Technology | |
| SubSector: Application Software | |
| MarketCap: 4524.62 Millions | |
| Recent Price: 12.05 Smart Investing & Trading Score: 64 | |
| Day Percent Change: -0.74% Day Change: -0.09 | |
| Week Change: -0.74% Year-to-date Change: -3.5% | |
| SWI Links: Profile News Message Board | |
| Charts:- Daily , Weekly | |
| Add SWI to Watchlist: View: Get Complete SWI Trend Analysis ➞ | |
 | NUVL Nuvalent, Inc. |
| Sector: Health Care | |
| SubSector: Biotechnology | |
| MarketCap: 2400 Millions | |
| Recent Price: 70.87 Smart Investing & Trading Score: 30 | |
| Day Percent Change: -0.01% Day Change: -0.01 | |
| Week Change: -0.01% Year-to-date Change: -3.6% | |
| NUVL Links: Profile News Message Board | |
| Charts:- Daily , Weekly | |
| Add NUVL to Watchlist: View: Get Complete NUVL Trend Analysis ➞ | |
 | VIR Vir Biotechnology, Inc. |
| Sector: Health Care | |
| SubSector: Biotechnology | |
| MarketCap: 3916.75 Millions | |
| Recent Price: 9.70 Smart Investing & Trading Score: 20 | |
| Day Percent Change: -0.31% Day Change: -0.03 | |
| Week Change: -0.31% Year-to-date Change: -3.6% | |
| VIR Links: Profile News Message Board | |
| Charts:- Daily , Weekly | |
| Add VIR to Watchlist: View: Get Complete VIR Trend Analysis ➞ | |
 | RHP Ryman Hospitality Properties, Inc. |
| Sector: Financials | |
| SubSector: REIT - Hotel/Motel | |
| MarketCap: 1519.74 Millions | |
| Recent Price: 106.04 Smart Investing & Trading Score: 40 | |
| Day Percent Change: 0.64% Day Change: 0.67 | |
| Week Change: 0.64% Year-to-date Change: -3.7% | |
| RHP Links: Profile News Message Board | |
| Charts:- Daily , Weekly | |
| Add RHP to Watchlist: View: Get Complete RHP Trend Analysis ➞ | |
 | AWR American States Water Company |
| Sector: Utilities | |
| SubSector: Water Utilities | |
| MarketCap: 3519.12 Millions | |
| Recent Price: 77.47 Smart Investing & Trading Score: 69 | |
| Day Percent Change: -1.05% Day Change: -0.82 | |
| Week Change: -1.05% Year-to-date Change: -3.7% | |
| AWR Links: Profile News Message Board | |
| Charts:- Daily , Weekly | |
| Add AWR to Watchlist: View: Get Complete AWR Trend Analysis ➞ | |
 | DAN Dana Incorporated |
| Sector: Consumer Staples | |
| SubSector: Auto Parts | |
| MarketCap: 1052.59 Millions | |
| Recent Price: 14.07 Smart Investing & Trading Score: 90 | |
| Day Percent Change: 0.29% Day Change: 0.04 | |
| Week Change: 0.29% Year-to-date Change: -3.7% | |
| DAN Links: Profile News Message Board | |
| Charts:- Daily , Weekly | |
| Add DAN to Watchlist: View: Get Complete DAN Trend Analysis ➞ | |
 | MFA MFA Financial, Inc. |
| Sector: Financials | |
| SubSector: Mortgage Investment | |
| MarketCap: 1869.69 Millions | |
| Recent Price: 10.85 Smart Investing & Trading Score: 35 | |
| Day Percent Change: -1.54% Day Change: -0.17 | |
| Week Change: -1.54% Year-to-date Change: -3.7% | |
| MFA Links: Profile News Message Board | |
| Charts:- Daily , Weekly | |
| Add MFA to Watchlist: View: Get Complete MFA Trend Analysis ➞ | |
 | ENS EnerSys |
| Sector: Industrials | |
| SubSector: Industrial Electrical Equipment | |
| MarketCap: 2068.79 Millions | |
| Recent Price: 97.17 Smart Investing & Trading Score: 68 | |
| Day Percent Change: 0.83% Day Change: 0.80 | |
| Week Change: 0.83% Year-to-date Change: -3.8% | |
| ENS Links: Profile News Message Board | |
| Charts:- Daily , Weekly | |
| Add ENS to Watchlist: View: Get Complete ENS Trend Analysis ➞ | |
 | RRR Red Rock Resorts, Inc. |
| Sector: Transports | |
| SubSector: Rental & Leasing Services | |
| MarketCap: 1144.04 Millions | |
| Recent Price: 51.26 Smart Investing & Trading Score: 28 | |
| Day Percent Change: -0.12% Day Change: -0.06 | |
| Week Change: -0.12% Year-to-date Change: -3.9% | |
| RRR Links: Profile News Message Board | |
| Charts:- Daily , Weekly | |
| Add RRR to Watchlist: View: Get Complete RRR Trend Analysis ➞ | |
 | FBRT Franklin BSP Realty Trust, Inc. |
| Sector: Financials | |
| SubSector: REIT - Mortgage | |
| MarketCap: 1170 Millions | |
| Recent Price: 13.10 Smart Investing & Trading Score: 83 | |
| Day Percent Change: -0.30% Day Change: -0.04 | |
| Week Change: -0.3% Year-to-date Change: -3.9% | |
| FBRT Links: Profile News Message Board | |
| Charts:- Daily , Weekly | |
| Add FBRT to Watchlist: View: Get Complete FBRT Trend Analysis ➞ | |
 | ALIT Alight, Inc. |
| Sector: Technology | |
| SubSector: Software - Application | |
| MarketCap: 5130 Millions | |
| Recent Price: 8.18 Smart Investing & Trading Score: 39 | |
| Day Percent Change: 1.61% Day Change: 0.13 | |
| Week Change: 1.61% Year-to-date Change: -3.9% | |
| ALIT Links: Profile News Message Board | |
| Charts:- Daily , Weekly | |
| Add ALIT to Watchlist: View: Get Complete ALIT Trend Analysis ➞ | |
 | PEB Pebblebrook Hotel Trust |
| Sector: Financials | |
| SubSector: REIT - Hotel/Motel | |
| MarketCap: 1472.84 Millions | |
| Recent Price: 15.33 Smart Investing & Trading Score: 74 | |
| Day Percent Change: 0.26% Day Change: 0.04 | |
| Week Change: 0.26% Year-to-date Change: -4.1% | |
| PEB Links: Profile News Message Board | |
| Charts:- Daily , Weekly | |
| Add PEB to Watchlist: View: Get Complete PEB Trend Analysis ➞ | |
 | NTCT NetScout Systems, Inc. |
| Sector: Technology | |
| SubSector: Business Software & Services | |
| MarketCap: 1657.28 Millions | |
| Recent Price: 21.05 Smart Investing & Trading Score: 69 | |
| Day Percent Change: -0.52% Day Change: -0.11 | |
| Week Change: -0.52% Year-to-date Change: -4.1% | |
| NTCT Links: Profile News Message Board | |
| Charts:- Daily , Weekly | |
| Add NTCT to Watchlist: View: Get Complete NTCT Trend Analysis ➞ | |
| For tabular summary view of above stock list: Summary View ➞ 0 - 25 , 25 - 50 , 50 - 75 , 75 - 100 , 100 - 125 , 125 - 150 , 150 - 175 , 175 - 200 , 200 - 225 , 225 - 250 , 250 - 275 , 275 - 300 , 300 - 325 , 325 - 350 , 350 - 375 , 375 - 400 , 400 - 425 , 425 - 450 , 450 - 475 , 475 - 500 , 500 - 525 , 525 - 550 , 550 - 575 , 575 - 600 , 600 - 625 , 625 - 650 , 650 - 675 , 675 - 700 | ||
| Click To Change The Sort Order: By Market Cap or Company Size Performance: Year-to-date, Week and Day | |
| Select Chart Type: | ||
| Too many stocks? View smallcap stocks filtered by marketcap & sector |
| Marketcap: All SmallCap Stocks (default-no microcap), Large, Mid-Range, Small & MicroCap |
| Sector: Tech, Finance, Energy, Staples, Retail, Industrial, Materials, Utilities & Medical |
|
Best Stocks Today 12Stocks.com |
© 2024 12Stocks.com Terms & Conditions Privacy Contact Us
All Information Provided Only For Education And Not To Be Used For Investing or Trading. See Terms & Conditions


One More Thing ... Get Best Stocks Delivered Daily!
Never Ever Miss A Move With Our Top Ten Stocks Lists
Find Best Stocks In Any Market - Bull or Bear Market
Take A Peek At Our Top Ten Stocks Lists: Daily, Weekly, Year-to-Date & Top Trends
Find Best Stocks In Any Market - Bull or Bear Market
Take A Peek At Our Top Ten Stocks Lists: Daily, Weekly, Year-to-Date & Top Trends
Smallcap Stocks With Best Up Trends [0-bearish to 100-bullish]: NuScale Power[100], Centrus Energy[100], Fossil Group[100], Riot Blockchain[100], MicroStrategy [100], Independent Bank[100], Kosmos Energy[100], EchoStar [100], Heron [100], AZZ [100], Crescent Energy[100]
Best Smallcap Stocks Year-to-Date:
CareMax [497.94%], Janux [347.18%], Viking [262.79%], Alpine Immune[241.23%], Longboard [240.67%], Avidity Biosciences[223.12%], Super Micro[217.96%], Novavax [208.23%], Stoke [206.08%], Sweetgreen [199.38%], Arcutis Bio[189.94%] Best Smallcap Stocks This Week:
Scilex Holding[34.44%], Dyne [27.93%], Comtech Tele[23.04%], Overseas Shipholding[22.74%], PTC [21.08%], Genelux [17.53%], Sutro Biopharma[16.71%], Tellurian [16.41%], Urban One[16.13%], Stoke [15.83%], NuScale Power[14.9%] Best Smallcap Stocks Daily:
Scilex Holding[34.44%], Dyne [27.93%], Comtech Tele[23.04%], Overseas Shipholding[22.74%], PTC [21.08%], Genelux [17.53%], Sutro Biopharma[16.71%], Tellurian [16.41%], Urban One[16.13%], Stoke [15.83%], NuScale Power[14.90%]