
 Login Sign Up


| |||||
 |  | ||||

| 12Stocks.com Market Intelligence |
Best SmallCap Stocks
|
| In a hurry? Small Cap Stock Lists: Performance Trends Table, Stock Charts
Sort Small Cap stocks: Daily, Weekly, Year-to-Date, Market Cap & Trends. Filter Small Cap stocks list by sector: Show all, Tech, Finance, Energy, Staples, Retail, Industrial, Materials, Utilities and HealthCare Filter Small Cap stocks list by size: All Large Medium Small and MicroCap |
| 12Stocks.com Small Cap Stocks Performances & Trends Daily | |||||||||
|
|  The overall Smart Investing & Trading Score is 83 (0-bearish to 100-bullish) which puts Small Cap index in short term bullish trend. The Smart Investing & Trading Score from previous trading session is 76 and hence an improvement of trend.
| ||||||||
Here are the Smart Investing & Trading Scores of the most requested small cap stocks at 12Stocks.com (click stock name for detailed review):
|


| 12Stocks.com: Investing in Smallcap Index with Stocks | |
|
The following table helps investors and traders sort through current performance and trends (as measured by Smart Investing & Trading Score) of various
stocks in the Smallcap Index. Quick View: Move mouse or cursor over stock symbol (ticker) to view short-term technical chart and over stock name to view long term chart. Click on  to add stock symbol to your watchlist and to add stock symbol to your watchlist and  to view watchlist. Click on any ticker or stock name for detailed market intelligence report for that stock. to view watchlist. Click on any ticker or stock name for detailed market intelligence report for that stock. |
12Stocks.com Performance of Stocks in Smallcap Index
| Ticker | Stock Name | Watchlist | Category | Recent Price | Smart Investing & Trading Score | Change % | YTD Change% |
| HALO | Halozyme |   | Health Care | 44.97 | 68 | 0.58% | 21.67% |
| FN | Fabrinet | | Technology | 231.34 | 68 | 0.39% | 21.55% |
| ITGR | Integer | | Health Care | 120.26 | 100 | -0.55% | 21.38% |
| LGND | Ligand | | Health Care | 86.63 | 90 | 0.66% | 21.30% |
| PCVX | Vaxcyte | | Health Care | 75.93 | 95 | 1.82% | 20.97% |
| MGY | Magnolia Oil | | Energy | 25.72 | 76 | 0.94% | 20.81% |
| IE | Ivanhoe Electric | | Materials | 12.20 | 63 | 1.92% | 20.37% |
| GPOR | Gulfport Energy | | Energy | 160.32 | 95 | 1.23% | 20.36% |
| HTLF | Heartland Financial | | Financials | 45.22 | 83 | -0.48% | 20.23% |
| HQY | HealthEquity | | Technology | 79.40 | 64 | 0.24% | 19.76% |
| ALKT | Alkami | | Technology | 28.88 | 100 | 4.22% | 19.49% |
| LAUR | Laureate Education | | Services & Goods | 16.38 | 76 | 0.24% | 19.47% |
| VRNT | Verint Systems | | Technology | 32.29 | 68 | 0.62% | 19.46% |
| HLIO | Helios | | Industrials | 53.88 | 95 | 0.77% | 18.81% |
| LIVN | LivaNova | | Health Care | 61.28 | 36 | -1.10% | 18.44% |
| KAR | KAR Auction | | Services & Goods | 17.54 | 36 | -0.34% | 18.43% |
| LILA | Liberty Latin | | Technology | 8.65 | 85 | -1.14% | 18.33% |
| WRBY | Warby Parker | | Health Care | 16.69 | 95 | 0.97% | 18.33% |
| EE | Excelerate Energy | | Utilities | 18.39 | 59 | -1.39% | 18.19% |
| AVIR | Atea | | Health Care | 3.60 | 40 | -1.37% | 18.03% |
| NSIT | Insight Enterprises | | Technology | 209.09 | 83 | 1.11% | 18.00% |
| NHI | National Health | | Financials | 65.79 | 58 | -1.08% | 17.80% |
| LILAK | Liberty Latin | | Technology | 8.63 | 85 | -1.26% | 17.57% |
| MSGE | Madison Square | | Technology | 37.34 | 35 | 0.70% | 17.38% |
| STEP | StepStone Group | | Financials | 37.37 | 46 | 0.13% | 17.37% |
| For chart view version of above stock list: Chart View ➞ 0 - 25 , 25 - 50 , 50 - 75 , 75 - 100 , 100 - 125 , 125 - 150 , 150 - 175 , 175 - 200 , 200 - 225 , 225 - 250 , 250 - 275 , 275 - 300 , 300 - 325 , 325 - 350 , 350 - 375 , 375 - 400 , 400 - 425 , 425 - 450 , 450 - 475 , 475 - 500 , 500 - 525 , 525 - 550 , 550 - 575 , 575 - 600 , 600 - 625 , 625 - 650 , 650 - 675 , 675 - 700 | ||
 | Click To Change The Sort Order: By Market Cap or Company Size Performance: Year-to-date, Week and Day |  |
| Too many stocks? View smallcap stocks filtered by marketcap & sector |
| Marketcap: All SmallCap Stocks (default-no microcap), Large, Mid-Range, Small |
| Smallcap Sector: Tech, Finance, Energy, Staples, Retail, Industrial, Materials, & Medical |
|
Get the most comprehensive stock market coverage daily at 12Stocks.com ➞ Best Stocks Today ➞ Best Stocks Weekly ➞ Best Stocks Year-to-Date ➞ Best Stocks Trends ➞  Best Stocks Today 12Stocks.com Best Nasdaq Stocks ➞ Best S&P 500 Stocks ➞ Best Tech Stocks ➞ Best Biotech Stocks ➞ |
| Detailed Overview of SmallCap Stocks |
| SmallCap Technical Overview, Leaders & Laggards, Top SmallCap ETF Funds & Detailed SmallCap Stocks List, Charts, Trends & More |
| Smallcap: Technical Analysis, Trends & YTD Performance | |
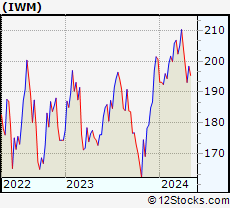
| SmallCap segment as represented by
IWM, an exchange-traded fund [ETF], holds basket of thousands of smallcap stocks from across all major sectors of the US stock market. The smallcap index (contains stocks like Riverbed & Sotheby's) is up by 3.9% and is currently underperforming the overall market by -6.79% year-to-date. Below is a quick view of technical charts and trends: | |
 IWM Weekly Chart |
|
| Long Term Trend: Very Good | |
| Medium Term Trend: Very Good | |
 IWM Daily Chart |
|
| Short Term Trend: Not Good | |
| Overall Trend Score: 83 | |
| YTD Performance: 3.9% | |
| **Trend Scores & Views Are Only For Educational Purposes And Not For Investing | |
| 12Stocks.com: Top Performing Small Cap Index Stocks | ||||||||||||||||||||||||||||||||||||||||||||||||
 The top performing Small Cap Index stocks year to date are
Now, more recently, over last week, the top performing Small Cap Index stocks on the move are


|
||||||||||||||||||||||||||||||||||||||||||||||||
| 12Stocks.com: Investing in Smallcap Index using Exchange Traded Funds | |
|
The following table shows list of key exchange traded funds (ETF) that
help investors track Smallcap index. The following list also includes leveraged ETF funds that track twice or thrice the daily returns of Smallcap indices. Short or inverse ETF funds move in the opposite direction to the index they track and are useful during market pullbacks or during bear markets. Quick View: Move mouse or cursor over ETF symbol (ticker) to view short-term technical chart and over ETF name to view long term chart. Click on ticker or stock name for detailed view. Click on to add stock symbol to your watchlist and to view watchlist. |
12Stocks.com List of ETFs that track Smallcap Index
| Ticker | ETF Name | Watchlist | Recent Price | Smart Investing & Trading Score | Change % | Week % | Year-to-date % |
| IWM | iShares Russell 2000 | | 208.54 | 83 | 0.22 | 0.22 | 3.9% |
| IJR | iShares Core S&P Small-Cap | | 110.22 | 76 | -0.15 | -0.15 | 1.82% |
| IWN | iShares Russell 2000 Value | | 158.19 | 76 | -0.33 | -0.33 | 1.84% |
| VTWO | Vanguard Russell 2000 ETF | | 84.35 | 71 | 0.29 | 0.29 | 4.01% |
| IWO | iShares Russell 2000 Growth | | 267.35 | 81 | 0.83 | 0.83 | 6% |
| IJS | iShares S&P Small-Cap 600 Value | | 101.20 | 43 | -0.66 | -0.66 | -1.81% |
| IJT | iShares S&P Small-Cap 600 Growth | | 131.76 | 83 | 0.32 | 0.32 | 5.29% |
| XSLV | PowerShares S&P SmallCap Low Volatil ETF | | 44.31 | 69 | -0.37 | -0.37 | 0.36% |
| SMLV | SPDR SSGA US Small Cap Low Volatil ETF | | 113.00 | 69 | -0.25 | -0.25 | 0.43% |
| SAA | ProShares Ultra SmallCap600 | | 25.10 | 71 | 0.79 | 0.79 | 0.6% |
| SBB | ProShares Short SmallCap600 | | 15.72 | 18 | -0.34 | -0.34 | -1.32% |
| SDD | ProShares UltraShort SmallCap600 | | 17.73 | 28 | -0.61 | -0.61 | -3.78% |
| 12Stocks.com: Charts, Trends, Fundamental Data and Performances of SmallCap Stocks | |
|
We now take in-depth look at all SmallCap stocks including charts, multi-period performances and overall trends (as measured by Smart Investing & Trading Score). One can sort SmallCap stocks (click link to choose) by Daily, Weekly and by Year-to-Date performances. Also, one can sort by size of the company or by market capitalization. |
| Select Your Default Chart Type: | |||||
| |||||
| Click on stock symbol or name for detailed view. Click on to add stock symbol to your watchlist and to view watchlist. Quick View: Move mouse or cursor over "Daily" to quickly view daily technical stock chart and over "Weekly" to view weekly technical stock chart. | |||||

 | HALO Halozyme Therapeutics, Inc. |
| Sector: Health Care | |
| SubSector: Biotechnology | |
| MarketCap: 2383.75 Millions | |
| Recent Price: 44.97 Smart Investing & Trading Score: 68 | |
| Day Percent Change: 0.58% Day Change: 0.26 | |
| Week Change: 0.58% Year-to-date Change: 21.7% | |
| HALO Links: Profile News Message Board | |
| Charts:- Daily , Weekly | |
| Add HALO to Watchlist: View: Get Complete HALO Trend Analysis ➞ | |
 | FN Fabrinet |
| Sector: Technology | |
| SubSector: Electronic Equipment | |
| MarketCap: 1876 Millions | |
| Recent Price: 231.34 Smart Investing & Trading Score: 68 | |
| Day Percent Change: 0.39% Day Change: 0.89 | |
| Week Change: 0.39% Year-to-date Change: 21.6% | |
| FN Links: Profile News Message Board | |
| Charts:- Daily , Weekly | |
| Add FN to Watchlist: View: Get Complete FN Trend Analysis ➞ | |
 | ITGR Integer Holdings Corporation |
| Sector: Health Care | |
| SubSector: Medical Appliances & Equipment | |
| MarketCap: 1794.8 Millions | |
| Recent Price: 120.26 Smart Investing & Trading Score: 100 | |
| Day Percent Change: -0.55% Day Change: -0.66 | |
| Week Change: -0.55% Year-to-date Change: 21.4% | |
| ITGR Links: Profile News Message Board | |
| Charts:- Daily , Weekly | |
| Add ITGR to Watchlist: View: Get Complete ITGR Trend Analysis ➞ | |
 | LGND Ligand Pharmaceuticals Incorporated |
| Sector: Health Care | |
| SubSector: Biotechnology | |
| MarketCap: 1344.45 Millions | |
| Recent Price: 86.63 Smart Investing & Trading Score: 90 | |
| Day Percent Change: 0.66% Day Change: 0.57 | |
| Week Change: 0.66% Year-to-date Change: 21.3% | |
| LGND Links: Profile News Message Board | |
| Charts:- Daily , Weekly | |
| Add LGND to Watchlist: View: Get Complete LGND Trend Analysis ➞ | |
 | PCVX Vaxcyte, Inc. |
| Sector: Health Care | |
| SubSector: Biotechnology | |
| MarketCap: 13887 Millions | |
| Recent Price: 75.93 Smart Investing & Trading Score: 95 | |
| Day Percent Change: 1.82% Day Change: 1.36 | |
| Week Change: 1.82% Year-to-date Change: 21.0% | |
| PCVX Links: Profile News Message Board | |
| Charts:- Daily , Weekly | |
| Add PCVX to Watchlist: View: Get Complete PCVX Trend Analysis ➞ | |
 | MGY Magnolia Oil & Gas Corporation |
| Sector: Energy | |
| SubSector: Independent Oil & Gas | |
| MarketCap: 1088.93 Millions | |
| Recent Price: 25.72 Smart Investing & Trading Score: 76 | |
| Day Percent Change: 0.94% Day Change: 0.24 | |
| Week Change: 0.94% Year-to-date Change: 20.8% | |
| MGY Links: Profile News Message Board | |
| Charts:- Daily , Weekly | |
| Add MGY to Watchlist: View: Get Complete MGY Trend Analysis ➞ | |
 | IE Ivanhoe Electric Inc. |
| Sector: Materials | |
| SubSector: Copper | |
| MarketCap: 1200 Millions | |
| Recent Price: 12.20 Smart Investing & Trading Score: 63 | |
| Day Percent Change: 1.92% Day Change: 0.23 | |
| Week Change: 1.92% Year-to-date Change: 20.4% | |
| IE Links: Profile News Message Board | |
| Charts:- Daily , Weekly | |
| Add IE to Watchlist: View: Get Complete IE Trend Analysis ➞ | |
 | GPOR Gulfport Energy Corporation |
| Sector: Energy | |
| SubSector: Oil & Gas E&P | |
| MarketCap: 1890 Millions | |
| Recent Price: 160.32 Smart Investing & Trading Score: 95 | |
| Day Percent Change: 1.23% Day Change: 1.95 | |
| Week Change: 1.23% Year-to-date Change: 20.4% | |
| GPOR Links: Profile News Message Board | |
| Charts:- Daily , Weekly | |
| Add GPOR to Watchlist: View: Get Complete GPOR Trend Analysis ➞ | |
 | HTLF Heartland Financial USA, Inc. |
| Sector: Financials | |
| SubSector: Regional - Southwest Banks | |
| MarketCap: 1143.85 Millions | |
| Recent Price: 45.22 Smart Investing & Trading Score: 83 | |
| Day Percent Change: -0.48% Day Change: -0.22 | |
| Week Change: -0.48% Year-to-date Change: 20.2% | |
| HTLF Links: Profile News Message Board | |
| Charts:- Daily , Weekly | |
| Add HTLF to Watchlist: View: Get Complete HTLF Trend Analysis ➞ | |
 | HQY HealthEquity, Inc. |
| Sector: Technology | |
| SubSector: Healthcare Information Services | |
| MarketCap: 3369.75 Millions | |
| Recent Price: 79.40 Smart Investing & Trading Score: 64 | |
| Day Percent Change: 0.24% Day Change: 0.19 | |
| Week Change: 0.24% Year-to-date Change: 19.8% | |
| HQY Links: Profile News Message Board | |
| Charts:- Daily , Weekly | |
| Add HQY to Watchlist: View: Get Complete HQY Trend Analysis ➞ | |
 | ALKT Alkami Technology, Inc. |
| Sector: Technology | |
| SubSector: Software - Application | |
| MarketCap: 1530 Millions | |
| Recent Price: 28.88 Smart Investing & Trading Score: 100 | |
| Day Percent Change: 4.22% Day Change: 1.17 | |
| Week Change: 4.22% Year-to-date Change: 19.5% | |
| ALKT Links: Profile News Message Board | |
| Charts:- Daily , Weekly | |
| Add ALKT to Watchlist: View: Get Complete ALKT Trend Analysis ➞ | |
 | LAUR Laureate Education, Inc. |
| Sector: Services & Goods | |
| SubSector: Education & Training Services | |
| MarketCap: 2258.56 Millions | |
| Recent Price: 16.38 Smart Investing & Trading Score: 76 | |
| Day Percent Change: 0.24% Day Change: 0.04 | |
| Week Change: 0.24% Year-to-date Change: 19.5% | |
| LAUR Links: Profile News Message Board | |
| Charts:- Daily , Weekly | |
| Add LAUR to Watchlist: View: Get Complete LAUR Trend Analysis ➞ | |
 | VRNT Verint Systems Inc. |
| Sector: Technology | |
| SubSector: Business Software & Services | |
| MarketCap: 2902.18 Millions | |
| Recent Price: 32.29 Smart Investing & Trading Score: 68 | |
| Day Percent Change: 0.62% Day Change: 0.20 | |
| Week Change: 0.62% Year-to-date Change: 19.5% | |
| VRNT Links: Profile News Message Board | |
| Charts:- Daily , Weekly | |
| Add VRNT to Watchlist: View: Get Complete VRNT Trend Analysis ➞ | |
 | HLIO Helios Technologies, Inc. |
| Sector: Industrials | |
| SubSector: Diversified Machinery | |
| MarketCap: 1455.66 Millions | |
| Recent Price: 53.88 Smart Investing & Trading Score: 95 | |
| Day Percent Change: 0.77% Day Change: 0.41 | |
| Week Change: 0.77% Year-to-date Change: 18.8% | |
| HLIO Links: Profile News Message Board | |
| Charts:- Daily , Weekly | |
| Add HLIO to Watchlist: View: Get Complete HLIO Trend Analysis ➞ | |
 | LIVN LivaNova PLC |
| Sector: Health Care | |
| SubSector: Medical Appliances & Equipment | |
| MarketCap: 2060.5 Millions | |
| Recent Price: 61.28 Smart Investing & Trading Score: 36 | |
| Day Percent Change: -1.10% Day Change: -0.68 | |
| Week Change: -1.1% Year-to-date Change: 18.4% | |
| LIVN Links: Profile News Message Board | |
| Charts:- Daily , Weekly | |
| Add LIVN to Watchlist: View: Get Complete LIVN Trend Analysis ➞ | |
 | KAR KAR Auction Services, Inc. |
| Sector: Services & Goods | |
| SubSector: Specialty Retail, Other | |
| MarketCap: 1709.54 Millions | |
| Recent Price: 17.54 Smart Investing & Trading Score: 36 | |
| Day Percent Change: -0.34% Day Change: -0.06 | |
| Week Change: -0.34% Year-to-date Change: 18.4% | |
| KAR Links: Profile News Message Board | |
| Charts:- Daily , Weekly | |
| Add KAR to Watchlist: View: Get Complete KAR Trend Analysis ➞ | |
 | LILA Liberty Latin America Ltd. |
| Sector: Technology | |
| SubSector: CATV Systems | |
| MarketCap: 2092.62 Millions | |
| Recent Price: 8.65 Smart Investing & Trading Score: 85 | |
| Day Percent Change: -1.14% Day Change: -0.10 | |
| Week Change: -1.14% Year-to-date Change: 18.3% | |
| LILA Links: Profile News Message Board | |
| Charts:- Daily , Weekly | |
| Add LILA to Watchlist: View: Get Complete LILA Trend Analysis ➞ | |
 | WRBY Warby Parker Inc. |
| Sector: Health Care | |
| SubSector: Medical Instruments & Supplies | |
| MarketCap: 1380 Millions | |
| Recent Price: 16.69 Smart Investing & Trading Score: 95 | |
| Day Percent Change: 0.97% Day Change: 0.16 | |
| Week Change: 0.97% Year-to-date Change: 18.3% | |
| WRBY Links: Profile News Message Board | |
| Charts:- Daily , Weekly | |
| Add WRBY to Watchlist: View: Get Complete WRBY Trend Analysis ➞ | |
 | EE Excelerate Energy, Inc. |
| Sector: Utilities | |
| SubSector: Utilities - Renewable | |
| MarketCap: 2140 Millions | |
| Recent Price: 18.39 Smart Investing & Trading Score: 59 | |
| Day Percent Change: -1.39% Day Change: -0.26 | |
| Week Change: -1.39% Year-to-date Change: 18.2% | |
| EE Links: Profile News Message Board | |
| Charts:- Daily , Weekly | |
| Add EE to Watchlist: View: Get Complete EE Trend Analysis ➞ | |
 | AVIR Atea Pharmaceuticals, Inc. |
| Sector: Health Care | |
| SubSector: Biotechnology | |
| MarketCap: 22587 Millions | |
| Recent Price: 3.60 Smart Investing & Trading Score: 40 | |
| Day Percent Change: -1.37% Day Change: -0.05 | |
| Week Change: -1.37% Year-to-date Change: 18.0% | |
| AVIR Links: Profile News Message Board | |
| Charts:- Daily , Weekly | |
| Add AVIR to Watchlist: View: Get Complete AVIR Trend Analysis ➞ | |
 | NSIT Insight Enterprises, Inc. |
| Sector: Technology | |
| SubSector: Information Technology Services | |
| MarketCap: 1498.48 Millions | |
| Recent Price: 209.09 Smart Investing & Trading Score: 83 | |
| Day Percent Change: 1.11% Day Change: 2.30 | |
| Week Change: 1.11% Year-to-date Change: 18.0% | |
| NSIT Links: Profile News Message Board | |
| Charts:- Daily , Weekly | |
| Add NSIT to Watchlist: View: Get Complete NSIT Trend Analysis ➞ | |
 | NHI National Health Investors, Inc. |
| Sector: Financials | |
| SubSector: REIT - Healthcare Facilities | |
| MarketCap: 2156.54 Millions | |
| Recent Price: 65.79 Smart Investing & Trading Score: 58 | |
| Day Percent Change: -1.08% Day Change: -0.72 | |
| Week Change: -1.08% Year-to-date Change: 17.8% | |
| NHI Links: Profile News Message Board | |
| Charts:- Daily , Weekly | |
| Add NHI to Watchlist: View: Get Complete NHI Trend Analysis ➞ | |
 | LILAK Liberty Latin America Ltd. |
| Sector: Technology | |
| SubSector: CATV Systems | |
| MarketCap: 1210.32 Millions | |
| Recent Price: 8.63 Smart Investing & Trading Score: 85 | |
| Day Percent Change: -1.26% Day Change: -0.11 | |
| Week Change: -1.26% Year-to-date Change: 17.6% | |
| LILAK Links: Profile News Message Board | |
| Charts:- Daily , Weekly | |
| Add LILAK to Watchlist: View: Get Complete LILAK Trend Analysis ➞ | |
 | MSGE Madison Square Garden Entertainment Corp. |
| Sector: Technology | |
| SubSector: Entertainment | |
| MarketCap: 18837 Millions | |
| Recent Price: 37.34 Smart Investing & Trading Score: 35 | |
| Day Percent Change: 0.70% Day Change: 0.26 | |
| Week Change: 0.7% Year-to-date Change: 17.4% | |
| MSGE Links: Profile News Message Board | |
| Charts:- Daily , Weekly | |
| Add MSGE to Watchlist: View: Get Complete MSGE Trend Analysis ➞ | |
 | STEP StepStone Group Inc. |
| Sector: Financials | |
| SubSector: Asset Management | |
| MarketCap: 30757 Millions | |
| Recent Price: 37.37 Smart Investing & Trading Score: 46 | |
| Day Percent Change: 0.13% Day Change: 0.05 | |
| Week Change: 0.13% Year-to-date Change: 17.4% | |
| STEP Links: Profile News Message Board | |
| Charts:- Daily , Weekly | |
| Add STEP to Watchlist: View: Get Complete STEP Trend Analysis ➞ | |
| For tabular summary view of above stock list: Summary View ➞ 0 - 25 , 25 - 50 , 50 - 75 , 75 - 100 , 100 - 125 , 125 - 150 , 150 - 175 , 175 - 200 , 200 - 225 , 225 - 250 , 250 - 275 , 275 - 300 , 300 - 325 , 325 - 350 , 350 - 375 , 375 - 400 , 400 - 425 , 425 - 450 , 450 - 475 , 475 - 500 , 500 - 525 , 525 - 550 , 550 - 575 , 575 - 600 , 600 - 625 , 625 - 650 , 650 - 675 , 675 - 700 | ||
| Click To Change The Sort Order: By Market Cap or Company Size Performance: Year-to-date, Week and Day | |
| Select Chart Type: | ||
| Too many stocks? View smallcap stocks filtered by marketcap & sector |
| Marketcap: All SmallCap Stocks (default-no microcap), Large, Mid-Range, Small & MicroCap |
| Sector: Tech, Finance, Energy, Staples, Retail, Industrial, Materials, Utilities & Medical |
|
Best Stocks Today 12Stocks.com |
© 2024 12Stocks.com Terms & Conditions Privacy Contact Us
All Information Provided Only For Education And Not To Be Used For Investing or Trading. See Terms & Conditions


One More Thing ... Get Best Stocks Delivered Daily!
Never Ever Miss A Move With Our Top Ten Stocks Lists
Find Best Stocks In Any Market - Bull or Bear Market
Take A Peek At Our Top Ten Stocks Lists: Daily, Weekly, Year-to-Date & Top Trends
Find Best Stocks In Any Market - Bull or Bear Market
Take A Peek At Our Top Ten Stocks Lists: Daily, Weekly, Year-to-Date & Top Trends
Smallcap Stocks With Best Up Trends [0-bearish to 100-bullish]: Overseas Shipholding[100], PTC [100], Stoke [100], NuScale Power[100], NextDecade [100], Centrus Energy[100], Humacyte [100], Fossil Group[100], MicroStrategy [100], Riot Blockchain[100], Reneo [100]
Best Smallcap Stocks Year-to-Date:
CareMax [489.69%], Janux [346.63%], Viking [262.79%], Alpine Immune[241.23%], Longboard [241.08%], Avidity Biosciences[223.45%], Super Micro[218%], Novavax [208.13%], Stoke [206.08%], Sweetgreen [199.38%], Arcutis Bio[189.47%] Best Smallcap Stocks This Week:
Scilex Holding[34.44%], Dyne [27.82%], Comtech Tele[23.04%], Overseas Shipholding[22.74%], PTC [21.23%], Genelux [17.81%], Sutro Biopharma[16.71%], InnovAge Holding[16.49%], Tellurian [16.41%], Atara Bio[16.39%], Stoke [15.83%] Best Smallcap Stocks Daily:
Scilex Holding[34.44%], Dyne [27.82%], Comtech Tele[23.04%], Overseas Shipholding[22.74%], PTC [21.23%], Genelux [17.81%], Sutro Biopharma[16.71%], InnovAge Holding[16.49%], Tellurian [16.41%], Atara Bio[16.39%], Stoke [15.83%]