
 Login Sign Up


| |||||
 |  | ||||

| 12Stocks.com Market Intelligence |
Best SmallCap Stocks
|
| In a hurry? Small Cap Stock Lists: Performance Trends Table, Stock Charts
Sort Small Cap stocks: Daily, Weekly, Year-to-Date, Market Cap & Trends. Filter Small Cap stocks list by sector: Show all, Tech, Finance, Energy, Staples, Retail, Industrial, Materials, Utilities and HealthCare Filter Small Cap stocks list by size: All Large Medium Small and MicroCap |
| 12Stocks.com Small Cap Stocks Performances & Trends Daily | |||||||||
|
|  The overall Smart Investing & Trading Score is 83 (0-bearish to 100-bullish) which puts Small Cap index in short term bullish trend. The Smart Investing & Trading Score from previous trading session is 76 and hence an improvement of trend.
| ||||||||
Here are the Smart Investing & Trading Scores of the most requested small cap stocks at 12Stocks.com (click stock name for detailed review):
|


| 12Stocks.com: Investing in Smallcap Index with Stocks | |
|
The following table helps investors and traders sort through current performance and trends (as measured by Smart Investing & Trading Score) of various
stocks in the Smallcap Index. Quick View: Move mouse or cursor over stock symbol (ticker) to view short-term technical chart and over stock name to view long term chart. Click on  to add stock symbol to your watchlist and to add stock symbol to your watchlist and  to view watchlist. Click on any ticker or stock name for detailed market intelligence report for that stock. to view watchlist. Click on any ticker or stock name for detailed market intelligence report for that stock. |
12Stocks.com Performance of Stocks in Smallcap Index
| Ticker | Stock Name | Watchlist | Category | Recent Price | Smart Investing & Trading Score | Change % | YTD Change% |
| CWST | Casella Waste |   | Industrials | 100.26 | 100 | 1.74% | 17.32% |
| KBH | KB Home | | Industrials | 73.25 | 75 | 0.27% | 17.28% |
| MTX | Minerals | | Materials | 83.58 | 95 | -0.26% | 17.21% |
| DO | Diamond Offshore | | Energy | 15.25 | 100 | 2.83% | 16.68% |
| IBP | Installed Building | | Industrials | 213.12 | 0 | 0.61% | 16.57% |
| TTMI | TTM | | Technology | 18.42 | 83 | 0.66% | 16.51% |
| SGHC | Super Group | | Services & Goods | 3.72 | 100 | 3.33% | 16.43% |
| SLG | SL Green | | Financials | 52.58 | 46 | -0.77% | 16.40% |
| AIT | Applied Industrial | | Services & Goods | 200.99 | 88 | 2.03% | 16.39% |
| SWTX | SpringWorks | | Health Care | 42.46 | 10 | -5.31% | 16.33% |
| COMP | Compass | | Technology | 4.33 | 75 | 0.70% | 16.24% |
| URBN | Urban Outfitters | | Services & Goods | 41.46 | 46 | 0.63% | 16.17% |
| SEMR | Semrush | | Technology | 16.10 | 90 | 2.29% | 15.91% |
| GATX | GATX | | Transports | 139.06 | 95 | 1.33% | 15.67% |
| TRN | Trinity Industries | | Transports | 30.75 | 71 | -0.93% | 15.64% |
| LANC | Lancaster Colony | | Consumer Staples | 192.07 | 22 | 0.29% | 15.43% |
| HASI | Hannon Armstrong | | Financials | 31.75 | 61 | -0.41% | 15.12% |
| SXT | Sensient | | Materials | 75.65 | 73 | -0.43% | 14.62% |
| KTB | Kontoor Brands | | Consumer Staples | 71.22 | 100 | 1.50% | 14.10% |
| FSS | Federal Signal | | Industrials | 87.54 | 83 | 1.35% | 14.07% |
| AMK | AssetMark Financial | | Financials | 34.04 | 25 | 0.29% | 13.66% |
| CMC | Commercial Metals | | Materials | 56.77 | 51 | -1.44% | 13.45% |
| CTRE | CareTrust REIT | | Financials | 25.37 | 100 | 1.16% | 13.36% |
| ALVR | AlloVir | | Health Care | 0.77 | 73 | -0.84% | 13.12% |
| PBF | PBF Energy | | Energy | 49.72 | 51 | -3.40% | 13.10% |
| For chart view version of above stock list: Chart View ➞ 0 - 25 , 25 - 50 , 50 - 75 , 75 - 100 , 100 - 125 , 125 - 150 , 150 - 175 , 175 - 200 , 200 - 225 , 225 - 250 , 250 - 275 , 275 - 300 , 300 - 325 , 325 - 350 , 350 - 375 , 375 - 400 , 400 - 425 , 425 - 450 , 450 - 475 , 475 - 500 , 500 - 525 , 525 - 550 , 550 - 575 , 575 - 600 , 600 - 625 , 625 - 650 , 650 - 675 , 675 - 700 | ||
 | Click To Change The Sort Order: By Market Cap or Company Size Performance: Year-to-date, Week and Day |  |
| Too many stocks? View smallcap stocks filtered by marketcap & sector |
| Marketcap: All SmallCap Stocks (default-no microcap), Large, Mid-Range, Small |
| Smallcap Sector: Tech, Finance, Energy, Staples, Retail, Industrial, Materials, & Medical |
|
Get the most comprehensive stock market coverage daily at 12Stocks.com ➞ Best Stocks Today ➞ Best Stocks Weekly ➞ Best Stocks Year-to-Date ➞ Best Stocks Trends ➞  Best Stocks Today 12Stocks.com Best Nasdaq Stocks ➞ Best S&P 500 Stocks ➞ Best Tech Stocks ➞ Best Biotech Stocks ➞ |
| Detailed Overview of SmallCap Stocks |
| SmallCap Technical Overview, Leaders & Laggards, Top SmallCap ETF Funds & Detailed SmallCap Stocks List, Charts, Trends & More |
| Smallcap: Technical Analysis, Trends & YTD Performance | |
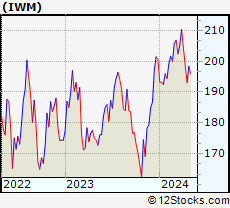
| SmallCap segment as represented by
IWM, an exchange-traded fund [ETF], holds basket of thousands of smallcap stocks from across all major sectors of the US stock market. The smallcap index (contains stocks like Riverbed & Sotheby's) is up by 3.9% and is currently underperforming the overall market by -6.79% year-to-date. Below is a quick view of technical charts and trends: | |
 IWM Weekly Chart |
|
| Long Term Trend: Very Good | |
| Medium Term Trend: Very Good | |
 IWM Daily Chart |
|
| Short Term Trend: Not Good | |
| Overall Trend Score: 83 | |
| YTD Performance: 3.9% | |
| **Trend Scores & Views Are Only For Educational Purposes And Not For Investing | |
| 12Stocks.com: Top Performing Small Cap Index Stocks | ||||||||||||||||||||||||||||||||||||||||||||||||
 The top performing Small Cap Index stocks year to date are
Now, more recently, over last week, the top performing Small Cap Index stocks on the move are


|
||||||||||||||||||||||||||||||||||||||||||||||||
| 12Stocks.com: Investing in Smallcap Index using Exchange Traded Funds | |
|
The following table shows list of key exchange traded funds (ETF) that
help investors track Smallcap index. The following list also includes leveraged ETF funds that track twice or thrice the daily returns of Smallcap indices. Short or inverse ETF funds move in the opposite direction to the index they track and are useful during market pullbacks or during bear markets. Quick View: Move mouse or cursor over ETF symbol (ticker) to view short-term technical chart and over ETF name to view long term chart. Click on ticker or stock name for detailed view. Click on to add stock symbol to your watchlist and to view watchlist. |
12Stocks.com List of ETFs that track Smallcap Index
| Ticker | ETF Name | Watchlist | Recent Price | Smart Investing & Trading Score | Change % | Week % | Year-to-date % |
| IWM | iShares Russell 2000 | | 208.54 | 83 | 0.22 | 0.22 | 3.9% |
| IJR | iShares Core S&P Small-Cap | | 110.22 | 76 | -0.15 | -0.15 | 1.82% |
| IWN | iShares Russell 2000 Value | | 158.19 | 76 | -0.33 | -0.33 | 1.84% |
| VTWO | Vanguard Russell 2000 ETF | | 84.35 | 71 | 0.29 | 0.29 | 4.01% |
| IWO | iShares Russell 2000 Growth | | 267.35 | 81 | 0.83 | 0.83 | 6% |
| IJS | iShares S&P Small-Cap 600 Value | | 101.20 | 43 | -0.66 | -0.66 | -1.81% |
| IJT | iShares S&P Small-Cap 600 Growth | | 131.76 | 83 | 0.32 | 0.32 | 5.29% |
| XSLV | PowerShares S&P SmallCap Low Volatil ETF | | 44.31 | 69 | -0.37 | -0.37 | 0.36% |
| SMLV | SPDR SSGA US Small Cap Low Volatil ETF | | 113.00 | 69 | -0.25 | -0.25 | 0.43% |
| SAA | ProShares Ultra SmallCap600 | | 25.10 | 71 | 0.79 | 0.79 | 0.6% |
| SBB | ProShares Short SmallCap600 | | 15.72 | 18 | -0.34 | -0.34 | -1.32% |
| SDD | ProShares UltraShort SmallCap600 | | 17.73 | 28 | -0.61 | -0.61 | -3.78% |
| 12Stocks.com: Charts, Trends, Fundamental Data and Performances of SmallCap Stocks | |
|
We now take in-depth look at all SmallCap stocks including charts, multi-period performances and overall trends (as measured by Smart Investing & Trading Score). One can sort SmallCap stocks (click link to choose) by Daily, Weekly and by Year-to-Date performances. Also, one can sort by size of the company or by market capitalization. |
| Select Your Default Chart Type: | |||||
| |||||
| Click on stock symbol or name for detailed view. Click on to add stock symbol to your watchlist and to view watchlist. Quick View: Move mouse or cursor over "Daily" to quickly view daily technical stock chart and over "Weekly" to view weekly technical stock chart. | |||||

 | CWST Casella Waste Systems, Inc. |
| Sector: Industrials | |
| SubSector: Waste Management | |
| MarketCap: 2093.38 Millions | |
| Recent Price: 100.26 Smart Investing & Trading Score: 100 | |
| Day Percent Change: 1.74% Day Change: 1.71 | |
| Week Change: 1.74% Year-to-date Change: 17.3% | |
| CWST Links: Profile News Message Board | |
| Charts:- Daily , Weekly | |
| Add CWST to Watchlist: View: Get Complete CWST Trend Analysis ➞ | |
 | KBH KB Home |
| Sector: Industrials | |
| SubSector: Residential Construction | |
| MarketCap: 1249.66 Millions | |
| Recent Price: 73.25 Smart Investing & Trading Score: 75 | |
| Day Percent Change: 0.27% Day Change: 0.20 | |
| Week Change: 0.27% Year-to-date Change: 17.3% | |
| KBH Links: Profile News Message Board | |
| Charts:- Daily , Weekly | |
| Add KBH to Watchlist: View: Get Complete KBH Trend Analysis ➞ | |
 | MTX Minerals Technologies Inc. |
| Sector: Materials | |
| SubSector: Chemicals - Major Diversified | |
| MarketCap: 1155.36 Millions | |
| Recent Price: 83.58 Smart Investing & Trading Score: 95 | |
| Day Percent Change: -0.26% Day Change: -0.22 | |
| Week Change: -0.26% Year-to-date Change: 17.2% | |
| MTX Links: Profile News Message Board | |
| Charts:- Daily , Weekly | |
| Add MTX to Watchlist: View: Get Complete MTX Trend Analysis ➞ | |
 | DO Diamond Offshore Drilling, Inc. |
| Sector: Energy | |
| SubSector: Oil & Gas Drilling | |
| MarketCap: 1340 Millions | |
| Recent Price: 15.25 Smart Investing & Trading Score: 100 | |
| Day Percent Change: 2.83% Day Change: 0.42 | |
| Week Change: 2.83% Year-to-date Change: 16.7% | |
| DO Links: Profile News Message Board | |
| Charts:- Daily , Weekly | |
| Add DO to Watchlist: View: Get Complete DO Trend Analysis ➞ | |
 | IBP Installed Building Products, Inc. |
| Sector: Industrials | |
| SubSector: General Building Materials | |
| MarketCap: 1284.23 Millions | |
| Recent Price: 213.12 Smart Investing & Trading Score: 0 | |
| Day Percent Change: 0.61% Day Change: 1.29 | |
| Week Change: 0.61% Year-to-date Change: 16.6% | |
| IBP Links: Profile News Message Board | |
| Charts:- Daily , Weekly | |
| Add IBP to Watchlist: View: Get Complete IBP Trend Analysis ➞ | |
 | TTMI TTM Technologies, Inc. |
| Sector: Technology | |
| SubSector: Printed Circuit Boards | |
| MarketCap: 1028.35 Millions | |
| Recent Price: 18.42 Smart Investing & Trading Score: 83 | |
| Day Percent Change: 0.66% Day Change: 0.12 | |
| Week Change: 0.66% Year-to-date Change: 16.5% | |
| TTMI Links: Profile News Message Board | |
| Charts:- Daily , Weekly | |
| Add TTMI to Watchlist: View: Get Complete TTMI Trend Analysis ➞ | |
 | SGHC Super Group (SGHC) Limited |
| Sector: Services & Goods | |
| SubSector: Gambling | |
| MarketCap: 1390 Millions | |
| Recent Price: 3.72 Smart Investing & Trading Score: 100 | |
| Day Percent Change: 3.33% Day Change: 0.12 | |
| Week Change: 3.33% Year-to-date Change: 16.4% | |
| SGHC Links: Profile News Message Board | |
| Charts:- Daily , Weekly | |
| Add SGHC to Watchlist: View: Get Complete SGHC Trend Analysis ➞ | |
 | SLG SL Green Realty Corp. |
| Sector: Financials | |
| SubSector: REIT - Retail | |
| MarketCap: 4048.14 Millions | |
| Recent Price: 52.58 Smart Investing & Trading Score: 46 | |
| Day Percent Change: -0.77% Day Change: -0.41 | |
| Week Change: -0.77% Year-to-date Change: 16.4% | |
| SLG Links: Profile News Message Board | |
| Charts:- Daily , Weekly | |
| Add SLG to Watchlist: View: Get Complete SLG Trend Analysis ➞ | |
 | AIT Applied Industrial Technologies, Inc. |
| Sector: Services & Goods | |
| SubSector: Industrial Equipment Wholesale | |
| MarketCap: 1531.58 Millions | |
| Recent Price: 200.99 Smart Investing & Trading Score: 88 | |
| Day Percent Change: 2.03% Day Change: 4.00 | |
| Week Change: 2.03% Year-to-date Change: 16.4% | |
| AIT Links: Profile News Message Board | |
| Charts:- Daily , Weekly | |
| Add AIT to Watchlist: View: Get Complete AIT Trend Analysis ➞ | |
 | SWTX SpringWorks Therapeutics, Inc. |
| Sector: Health Care | |
| SubSector: Biotechnology | |
| MarketCap: 1311.85 Millions | |
| Recent Price: 42.46 Smart Investing & Trading Score: 10 | |
| Day Percent Change: -5.31% Day Change: -2.38 | |
| Week Change: -5.31% Year-to-date Change: 16.3% | |
| SWTX Links: Profile News Message Board | |
| Charts:- Daily , Weekly | |
| Add SWTX to Watchlist: View: Get Complete SWTX Trend Analysis ➞ | |
 | COMP Compass, Inc. |
| Sector: Technology | |
| SubSector: Software - Application | |
| MarketCap: 1580 Millions | |
| Recent Price: 4.33 Smart Investing & Trading Score: 75 | |
| Day Percent Change: 0.70% Day Change: 0.03 | |
| Week Change: 0.7% Year-to-date Change: 16.2% | |
| COMP Links: Profile News Message Board | |
| Charts:- Daily , Weekly | |
| Add COMP to Watchlist: View: Get Complete COMP Trend Analysis ➞ | |
 | URBN Urban Outfitters, Inc. |
| Sector: Services & Goods | |
| SubSector: Apparel Stores | |
| MarketCap: 1638.08 Millions | |
| Recent Price: 41.46 Smart Investing & Trading Score: 46 | |
| Day Percent Change: 0.63% Day Change: 0.26 | |
| Week Change: 0.63% Year-to-date Change: 16.2% | |
| URBN Links: Profile News Message Board | |
| Charts:- Daily , Weekly | |
| Add URBN to Watchlist: View: Get Complete URBN Trend Analysis ➞ | |
 | SEMR Semrush Holdings, Inc. |
| Sector: Technology | |
| SubSector: Software - Application | |
| MarketCap: 1330 Millions | |
| Recent Price: 16.10 Smart Investing & Trading Score: 90 | |
| Day Percent Change: 2.29% Day Change: 0.36 | |
| Week Change: 2.29% Year-to-date Change: 15.9% | |
| SEMR Links: Profile News Message Board | |
| Charts:- Daily , Weekly | |
| Add SEMR to Watchlist: View: Get Complete SEMR Trend Analysis ➞ | |
 | GATX GATX Corporation |
| Sector: Transports | |
| SubSector: Rental & Leasing Services | |
| MarketCap: 2080.34 Millions | |
| Recent Price: 139.06 Smart Investing & Trading Score: 95 | |
| Day Percent Change: 1.33% Day Change: 1.82 | |
| Week Change: 1.33% Year-to-date Change: 15.7% | |
| GATX Links: Profile News Message Board | |
| Charts:- Daily , Weekly | |
| Add GATX to Watchlist: View: Get Complete GATX Trend Analysis ➞ | |
 | TRN Trinity Industries, Inc. |
| Sector: Transports | |
| SubSector: Railroads | |
| MarketCap: 2058.22 Millions | |
| Recent Price: 30.75 Smart Investing & Trading Score: 71 | |
| Day Percent Change: -0.93% Day Change: -0.29 | |
| Week Change: -0.93% Year-to-date Change: 15.6% | |
| TRN Links: Profile News Message Board | |
| Charts:- Daily , Weekly | |
| Add TRN to Watchlist: View: Get Complete TRN Trend Analysis ➞ | |
 | LANC Lancaster Colony Corporation |
| Sector: Consumer Staples | |
| SubSector: Food - Major Diversified | |
| MarketCap: 4060.83 Millions | |
| Recent Price: 192.07 Smart Investing & Trading Score: 22 | |
| Day Percent Change: 0.29% Day Change: 0.56 | |
| Week Change: 0.29% Year-to-date Change: 15.4% | |
| LANC Links: Profile News Message Board | |
| Charts:- Daily , Weekly | |
| Add LANC to Watchlist: View: Get Complete LANC Trend Analysis ➞ | |
 | HASI Hannon Armstrong Sustainable Infrastructure Capital, Inc. |
| Sector: Financials | |
| SubSector: REIT - Diversified | |
| MarketCap: 1405.93 Millions | |
| Recent Price: 31.75 Smart Investing & Trading Score: 61 | |
| Day Percent Change: -0.41% Day Change: -0.13 | |
| Week Change: -0.41% Year-to-date Change: 15.1% | |
| HASI Links: Profile News Message Board | |
| Charts:- Daily , Weekly | |
| Add HASI to Watchlist: View: Get Complete HASI Trend Analysis ➞ | |
 | SXT Sensient Technologies Corporation |
| Sector: Materials | |
| SubSector: Specialty Chemicals | |
| MarketCap: 1961.37 Millions | |
| Recent Price: 75.65 Smart Investing & Trading Score: 73 | |
| Day Percent Change: -0.43% Day Change: -0.33 | |
| Week Change: -0.43% Year-to-date Change: 14.6% | |
| SXT Links: Profile News Message Board | |
| Charts:- Daily , Weekly | |
| Add SXT to Watchlist: View: Get Complete SXT Trend Analysis ➞ | |
 | KTB Kontoor Brands, Inc. |
| Sector: Consumer Staples | |
| SubSector: Textile - Apparel Clothing | |
| MarketCap: 1668.65 Millions | |
| Recent Price: 71.22 Smart Investing & Trading Score: 100 | |
| Day Percent Change: 1.50% Day Change: 1.05 | |
| Week Change: 1.5% Year-to-date Change: 14.1% | |
| KTB Links: Profile News Message Board | |
| Charts:- Daily , Weekly | |
| Add KTB to Watchlist: View: Get Complete KTB Trend Analysis ➞ | |
 | FSS Federal Signal Corporation |
| Sector: Industrials | |
| SubSector: Pollution & Treatment Controls | |
| MarketCap: 1694.05 Millions | |
| Recent Price: 87.54 Smart Investing & Trading Score: 83 | |
| Day Percent Change: 1.35% Day Change: 1.17 | |
| Week Change: 1.35% Year-to-date Change: 14.1% | |
| FSS Links: Profile News Message Board | |
| Charts:- Daily , Weekly | |
| Add FSS to Watchlist: View: Get Complete FSS Trend Analysis ➞ | |
 | AMK AssetMark Financial Holdings, Inc. |
| Sector: Financials | |
| SubSector: Asset Management | |
| MarketCap: 1296.33 Millions | |
| Recent Price: 34.04 Smart Investing & Trading Score: 25 | |
| Day Percent Change: 0.29% Day Change: 0.10 | |
| Week Change: 0.29% Year-to-date Change: 13.7% | |
| AMK Links: Profile News Message Board | |
| Charts:- Daily , Weekly | |
| Add AMK to Watchlist: View: Get Complete AMK Trend Analysis ➞ | |
 | CMC Commercial Metals Company |
| Sector: Materials | |
| SubSector: Steel & Iron | |
| MarketCap: 1724.78 Millions | |
| Recent Price: 56.77 Smart Investing & Trading Score: 51 | |
| Day Percent Change: -1.44% Day Change: -0.83 | |
| Week Change: -1.44% Year-to-date Change: 13.5% | |
| CMC Links: Profile News Message Board | |
| Charts:- Daily , Weekly | |
| Add CMC to Watchlist: View: Get Complete CMC Trend Analysis ➞ | |
 | CTRE CareTrust REIT, Inc. |
| Sector: Financials | |
| SubSector: REIT - Healthcare Facilities | |
| MarketCap: 1507.94 Millions | |
| Recent Price: 25.37 Smart Investing & Trading Score: 100 | |
| Day Percent Change: 1.16% Day Change: 0.29 | |
| Week Change: 1.16% Year-to-date Change: 13.4% | |
| CTRE Links: Profile News Message Board | |
| Charts:- Daily , Weekly | |
| Add CTRE to Watchlist: View: Get Complete CTRE Trend Analysis ➞ | |
 | ALVR AlloVir, Inc. |
| Sector: Health Care | |
| SubSector: Biotechnology | |
| MarketCap: 25787 Millions | |
| Recent Price: 0.77 Smart Investing & Trading Score: 73 | |
| Day Percent Change: -0.84% Day Change: -0.01 | |
| Week Change: -0.84% Year-to-date Change: 13.1% | |
| ALVR Links: Profile News Message Board | |
| Charts:- Daily , Weekly | |
| Add ALVR to Watchlist: View: Get Complete ALVR Trend Analysis ➞ | |
 | PBF PBF Energy Inc |
| Sector: Energy | |
| SubSector: Oil & Gas Refining & Marketing | |
| MarketCap: 1118.54 Millions | |
| Recent Price: 49.72 Smart Investing & Trading Score: 51 | |
| Day Percent Change: -3.40% Day Change: -1.75 | |
| Week Change: -3.4% Year-to-date Change: 13.1% | |
| PBF Links: Profile News Message Board | |
| Charts:- Daily , Weekly | |
| Add PBF to Watchlist: View: Get Complete PBF Trend Analysis ➞ | |
| For tabular summary view of above stock list: Summary View ➞ 0 - 25 , 25 - 50 , 50 - 75 , 75 - 100 , 100 - 125 , 125 - 150 , 150 - 175 , 175 - 200 , 200 - 225 , 225 - 250 , 250 - 275 , 275 - 300 , 300 - 325 , 325 - 350 , 350 - 375 , 375 - 400 , 400 - 425 , 425 - 450 , 450 - 475 , 475 - 500 , 500 - 525 , 525 - 550 , 550 - 575 , 575 - 600 , 600 - 625 , 625 - 650 , 650 - 675 , 675 - 700 | ||
| Click To Change The Sort Order: By Market Cap or Company Size Performance: Year-to-date, Week and Day | |
| Select Chart Type: | ||
| Too many stocks? View smallcap stocks filtered by marketcap & sector |
| Marketcap: All SmallCap Stocks (default-no microcap), Large, Mid-Range, Small & MicroCap |
| Sector: Tech, Finance, Energy, Staples, Retail, Industrial, Materials, Utilities & Medical |
|
Best Stocks Today 12Stocks.com |
© 2024 12Stocks.com Terms & Conditions Privacy Contact Us
All Information Provided Only For Education And Not To Be Used For Investing or Trading. See Terms & Conditions


One More Thing ... Get Best Stocks Delivered Daily!
Never Ever Miss A Move With Our Top Ten Stocks Lists
Find Best Stocks In Any Market - Bull or Bear Market
Take A Peek At Our Top Ten Stocks Lists: Daily, Weekly, Year-to-Date & Top Trends
Find Best Stocks In Any Market - Bull or Bear Market
Take A Peek At Our Top Ten Stocks Lists: Daily, Weekly, Year-to-Date & Top Trends
Smallcap Stocks With Best Up Trends [0-bearish to 100-bullish]: Overseas Shipholding[100], PTC [100], Stoke [100], NuScale Power[100], NextDecade [100], Centrus Energy[100], Humacyte [100], Fossil Group[100], MicroStrategy [100], Riot Blockchain[100], Reneo [100]
Best Smallcap Stocks Year-to-Date:
CareMax [489.69%], Janux [346.63%], Viking [262.79%], Alpine Immune[241.23%], Longboard [241.08%], Avidity Biosciences[223.45%], Super Micro[218%], Novavax [208.13%], Stoke [206.08%], Sweetgreen [199.38%], Arcutis Bio[189.47%] Best Smallcap Stocks This Week:
Scilex Holding[34.44%], Dyne [27.82%], Comtech Tele[23.04%], Overseas Shipholding[22.74%], PTC [21.23%], Genelux [17.81%], Sutro Biopharma[16.71%], InnovAge Holding[16.49%], Tellurian [16.41%], Atara Bio[16.39%], Stoke [15.83%] Best Smallcap Stocks Daily:
Scilex Holding[34.44%], Dyne [27.82%], Comtech Tele[23.04%], Overseas Shipholding[22.74%], PTC [21.23%], Genelux [17.81%], Sutro Biopharma[16.71%], InnovAge Holding[16.49%], Tellurian [16.41%], Atara Bio[16.39%], Stoke [15.83%]