
 Login Sign Up


| |||||
 |  | ||||

| 12Stocks.com Market Intelligence |
Best SmallCap Stocks
|
| In a hurry? Small Cap Stock Lists: Performance Trends Table, Stock Charts
Sort Small Cap stocks: Daily, Weekly, Year-to-Date, Market Cap & Trends. Filter Small Cap stocks list by sector: Show all, Tech, Finance, Energy, Staples, Retail, Industrial, Materials, Utilities and HealthCare Filter Small Cap stocks list by size: All Large Medium Small and MicroCap |
| 12Stocks.com Small Cap Stocks Performances & Trends Daily | |||||||||
|
|  The overall Smart Investing & Trading Score is 83 (0-bearish to 100-bullish) which puts Small Cap index in short term bullish trend. The Smart Investing & Trading Score from previous trading session is 76 and hence an improvement of trend.
| ||||||||
Here are the Smart Investing & Trading Scores of the most requested small cap stocks at 12Stocks.com (click stock name for detailed review):
|


| 12Stocks.com: Investing in Smallcap Index with Stocks | |
|
The following table helps investors and traders sort through current performance and trends (as measured by Smart Investing & Trading Score) of various
stocks in the Smallcap Index. Quick View: Move mouse or cursor over stock symbol (ticker) to view short-term technical chart and over stock name to view long term chart. Click on  to add stock symbol to your watchlist and to add stock symbol to your watchlist and  to view watchlist. Click on any ticker or stock name for detailed market intelligence report for that stock. to view watchlist. Click on any ticker or stock name for detailed market intelligence report for that stock. |
12Stocks.com Performance of Stocks in Smallcap Index
| Ticker | Stock Name | Watchlist | Category | Recent Price | Smart Investing & Trading Score | Change % | YTD Change% |
| HCSG | Healthcare Services |   | Services & Goods | 11.45 | 42 | -0.78% | 10.41% |
| DORM | Dorman Products | | Consumer Staples | 92.05 | 47 | 0.79% | 10.36% |
| MTSI | MACOM | | Technology | 102.38 | 56 | 1.52% | 10.15% |
| BCO | Brink s | | Services & Goods | 96.68 | 83 | -0.33% | 9.93% |
| EXPO | Exponent | | Services & Goods | 96.77 | 95 | 1.67% | 9.92% |
| IBOC | Bancshares | | Financials | 59.67 | 51 | -1.68% | 9.85% |
| DK | Delek US | | Energy | 28.34 | 80 | -1.12% | 9.84% |
| ICFI | ICF | | Services & Goods | 147.23 | 15 | -1.72% | 9.80% |
| MMSI | Merit Medical | | Health Care | 83.06 | 75 | 1.43% | 9.35% |
| ZUO | Zuora | | Technology | 10.26 | 51 | -1.54% | 9.15% |
| GHC | Graham | | Services & Goods | 759.82 | 75 | -0.27% | 9.09% |
| CHRD | Chord Energy | | Energy | 181.90 | 76 | 0.73% | 9.01% |
| MBC | MasterBrand | | Services & Goods | 16.26 | 0 | -0.31% | 8.94% |
| OSIS | OSI Systems | | Industrials | 140.57 | 88 | 0.93% | 8.93% |
| TRMK | Trustmark | | Financials | 30.32 | 43 | -1.46% | 8.75% |
| DAWN | Day One | | Health Care | 15.97 | 5 | -1.24% | 8.71% |
| ALTR | Altair Engineering | | Technology | 91.47 | 81 | 1.07% | 8.70% |
| LMND | Lemonade | | Financials | 17.51 | 63 | -2.56% | 8.56% |
| HBI | Hanesbrands | | Consumer Staples | 4.84 | 30 | -3.78% | 8.52% |
| ACDC | ProFrac Holding | | Energy | 9.23 | 100 | 2.50% | 8.52% |
| ULCC | Frontier Group | | Industrials | 5.88 | 25 | -0.59% | 8.38% |
| OTTR | Otter Tail | | Utilities | 91.93 | 69 | -0.25% | 8.19% |
| EPC | Edgewell Personal | | Consumer Staples | 39.63 | 56 | -1.86% | 8.19% |
| CVCO | Cavco Industries | | Industrials | 374.68 | 35 | 0.13% | 8.10% |
| NGVT | Ingevity | | Materials | 51.03 | 36 | -4.71% | 8.07% |
| For chart view version of above stock list: Chart View ➞ 0 - 25 , 25 - 50 , 50 - 75 , 75 - 100 , 100 - 125 , 125 - 150 , 150 - 175 , 175 - 200 , 200 - 225 , 225 - 250 , 250 - 275 , 275 - 300 , 300 - 325 , 325 - 350 , 350 - 375 , 375 - 400 , 400 - 425 , 425 - 450 , 450 - 475 , 475 - 500 , 500 - 525 , 525 - 550 , 550 - 575 , 575 - 600 , 600 - 625 , 625 - 650 , 650 - 675 , 675 - 700 | ||
 | Click To Change The Sort Order: By Market Cap or Company Size Performance: Year-to-date, Week and Day |  |
| Too many stocks? View smallcap stocks filtered by marketcap & sector |
| Marketcap: All SmallCap Stocks (default-no microcap), Large, Mid-Range, Small |
| Smallcap Sector: Tech, Finance, Energy, Staples, Retail, Industrial, Materials, & Medical |
|
Get the most comprehensive stock market coverage daily at 12Stocks.com ➞ Best Stocks Today ➞ Best Stocks Weekly ➞ Best Stocks Year-to-Date ➞ Best Stocks Trends ➞  Best Stocks Today 12Stocks.com Best Nasdaq Stocks ➞ Best S&P 500 Stocks ➞ Best Tech Stocks ➞ Best Biotech Stocks ➞ |
| Detailed Overview of SmallCap Stocks |
| SmallCap Technical Overview, Leaders & Laggards, Top SmallCap ETF Funds & Detailed SmallCap Stocks List, Charts, Trends & More |
| Smallcap: Technical Analysis, Trends & YTD Performance | |
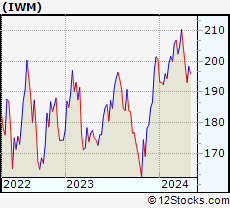
| SmallCap segment as represented by
IWM, an exchange-traded fund [ETF], holds basket of thousands of smallcap stocks from across all major sectors of the US stock market. The smallcap index (contains stocks like Riverbed & Sotheby's) is up by 3.9% and is currently underperforming the overall market by -6.79% year-to-date. Below is a quick view of technical charts and trends: | |
 IWM Weekly Chart |
|
| Long Term Trend: Very Good | |
| Medium Term Trend: Very Good | |
 IWM Daily Chart |
|
| Short Term Trend: Not Good | |
| Overall Trend Score: 83 | |
| YTD Performance: 3.9% | |
| **Trend Scores & Views Are Only For Educational Purposes And Not For Investing | |
| 12Stocks.com: Top Performing Small Cap Index Stocks | ||||||||||||||||||||||||||||||||||||||||||||||||
 The top performing Small Cap Index stocks year to date are
Now, more recently, over last week, the top performing Small Cap Index stocks on the move are


|
||||||||||||||||||||||||||||||||||||||||||||||||
| 12Stocks.com: Investing in Smallcap Index using Exchange Traded Funds | |
|
The following table shows list of key exchange traded funds (ETF) that
help investors track Smallcap index. The following list also includes leveraged ETF funds that track twice or thrice the daily returns of Smallcap indices. Short or inverse ETF funds move in the opposite direction to the index they track and are useful during market pullbacks or during bear markets. Quick View: Move mouse or cursor over ETF symbol (ticker) to view short-term technical chart and over ETF name to view long term chart. Click on ticker or stock name for detailed view. Click on to add stock symbol to your watchlist and to view watchlist. |
12Stocks.com List of ETFs that track Smallcap Index
| Ticker | ETF Name | Watchlist | Recent Price | Smart Investing & Trading Score | Change % | Week % | Year-to-date % |
| IWM | iShares Russell 2000 | | 208.54 | 83 | 0.22 | 0.22 | 3.9% |
| IJR | iShares Core S&P Small-Cap | | 110.22 | 76 | -0.15 | -0.15 | 1.82% |
| IWN | iShares Russell 2000 Value | | 158.19 | 76 | -0.33 | -0.33 | 1.84% |
| VTWO | Vanguard Russell 2000 ETF | | 84.35 | 71 | 0.29 | 0.29 | 4.01% |
| IWO | iShares Russell 2000 Growth | | 267.35 | 81 | 0.83 | 0.83 | 6% |
| IJS | iShares S&P Small-Cap 600 Value | | 101.20 | 43 | -0.66 | -0.66 | -1.81% |
| IJT | iShares S&P Small-Cap 600 Growth | | 131.76 | 83 | 0.32 | 0.32 | 5.29% |
| XSLV | PowerShares S&P SmallCap Low Volatil ETF | | 44.31 | 69 | -0.37 | -0.37 | 0.36% |
| SMLV | SPDR SSGA US Small Cap Low Volatil ETF | | 113.00 | 69 | -0.25 | -0.25 | 0.43% |
| SAA | ProShares Ultra SmallCap600 | | 25.10 | 71 | 0.79 | 0.79 | 0.6% |
| SBB | ProShares Short SmallCap600 | | 15.72 | 18 | -0.34 | -0.34 | -1.32% |
| SDD | ProShares UltraShort SmallCap600 | | 17.73 | 28 | -0.61 | -0.61 | -3.78% |
| 12Stocks.com: Charts, Trends, Fundamental Data and Performances of SmallCap Stocks | |
|
We now take in-depth look at all SmallCap stocks including charts, multi-period performances and overall trends (as measured by Smart Investing & Trading Score). One can sort SmallCap stocks (click link to choose) by Daily, Weekly and by Year-to-Date performances. Also, one can sort by size of the company or by market capitalization. |
| Select Your Default Chart Type: | |||||
| |||||
| Click on stock symbol or name for detailed view. Click on to add stock symbol to your watchlist and to view watchlist. Quick View: Move mouse or cursor over "Daily" to quickly view daily technical stock chart and over "Weekly" to view weekly technical stock chart. | |||||

 | HCSG Healthcare Services Group, Inc. |
| Sector: Services & Goods | |
| SubSector: Business Services | |
| MarketCap: 1758.32 Millions | |
| Recent Price: 11.45 Smart Investing & Trading Score: 42 | |
| Day Percent Change: -0.78% Day Change: -0.09 | |
| Week Change: -0.78% Year-to-date Change: 10.4% | |
| HCSG Links: Profile News Message Board | |
| Charts:- Daily , Weekly | |
| Add HCSG to Watchlist: View: Get Complete HCSG Trend Analysis ➞ | |
 | DORM Dorman Products, Inc. |
| Sector: Consumer Staples | |
| SubSector: Auto Parts | |
| MarketCap: 2028.79 Millions | |
| Recent Price: 92.05 Smart Investing & Trading Score: 47 | |
| Day Percent Change: 0.79% Day Change: 0.72 | |
| Week Change: 0.79% Year-to-date Change: 10.4% | |
| DORM Links: Profile News Message Board | |
| Charts:- Daily , Weekly | |
| Add DORM to Watchlist: View: Get Complete DORM Trend Analysis ➞ | |
 | MTSI MACOM Technology Solutions Holdings, Inc. |
| Sector: Technology | |
| SubSector: Semiconductor - Broad Line | |
| MarketCap: 1214.42 Millions | |
| Recent Price: 102.38 Smart Investing & Trading Score: 56 | |
| Day Percent Change: 1.52% Day Change: 1.53 | |
| Week Change: 1.52% Year-to-date Change: 10.2% | |
| MTSI Links: Profile News Message Board | |
| Charts:- Daily , Weekly | |
| Add MTSI to Watchlist: View: Get Complete MTSI Trend Analysis ➞ | |
 | BCO The Brink s Company |
| Sector: Services & Goods | |
| SubSector: Security & Protection Services | |
| MarketCap: 2544.73 Millions | |
| Recent Price: 96.68 Smart Investing & Trading Score: 83 | |
| Day Percent Change: -0.33% Day Change: -0.32 | |
| Week Change: -0.33% Year-to-date Change: 9.9% | |
| BCO Links: Profile News Message Board | |
| Charts:- Daily , Weekly | |
| Add BCO to Watchlist: View: Get Complete BCO Trend Analysis ➞ | |
 | EXPO Exponent, Inc. |
| Sector: Services & Goods | |
| SubSector: Management Services | |
| MarketCap: 3605.95 Millions | |
| Recent Price: 96.77 Smart Investing & Trading Score: 95 | |
| Day Percent Change: 1.67% Day Change: 1.59 | |
| Week Change: 1.67% Year-to-date Change: 9.9% | |
| EXPO Links: Profile News Message Board | |
| Charts:- Daily , Weekly | |
| Add EXPO to Watchlist: View: Get Complete EXPO Trend Analysis ➞ | |
 | IBOC International Bancshares Corporation |
| Sector: Financials | |
| SubSector: Regional - Southwest Banks | |
| MarketCap: 1159.45 Millions | |
| Recent Price: 59.67 Smart Investing & Trading Score: 51 | |
| Day Percent Change: -1.68% Day Change: -1.02 | |
| Week Change: -1.68% Year-to-date Change: 9.9% | |
| IBOC Links: Profile News Message Board | |
| Charts:- Daily , Weekly | |
| Add IBOC to Watchlist: View: Get Complete IBOC Trend Analysis ➞ | |
 | DK Delek US Holdings, Inc. |
| Sector: Energy | |
| SubSector: Oil & Gas Refining & Marketing | |
| MarketCap: 1328.54 Millions | |
| Recent Price: 28.34 Smart Investing & Trading Score: 80 | |
| Day Percent Change: -1.12% Day Change: -0.32 | |
| Week Change: -1.12% Year-to-date Change: 9.8% | |
| DK Links: Profile News Message Board | |
| Charts:- Daily , Weekly | |
| Add DK to Watchlist: View: Get Complete DK Trend Analysis ➞ | |
 | ICFI ICF International, Inc. |
| Sector: Services & Goods | |
| SubSector: Management Services | |
| MarketCap: 1218.75 Millions | |
| Recent Price: 147.23 Smart Investing & Trading Score: 15 | |
| Day Percent Change: -1.72% Day Change: -2.57 | |
| Week Change: -1.72% Year-to-date Change: 9.8% | |
| ICFI Links: Profile News Message Board | |
| Charts:- Daily , Weekly | |
| Add ICFI to Watchlist: View: Get Complete ICFI Trend Analysis ➞ | |
 | MMSI Merit Medical Systems, Inc. |
| Sector: Health Care | |
| SubSector: Medical Instruments & Supplies | |
| MarketCap: 1719.2 Millions | |
| Recent Price: 83.06 Smart Investing & Trading Score: 75 | |
| Day Percent Change: 1.43% Day Change: 1.17 | |
| Week Change: 1.43% Year-to-date Change: 9.4% | |
| MMSI Links: Profile News Message Board | |
| Charts:- Daily , Weekly | |
| Add MMSI to Watchlist: View: Get Complete MMSI Trend Analysis ➞ | |
 | ZUO Zuora, Inc. |
| Sector: Technology | |
| SubSector: Application Software | |
| MarketCap: 1063.22 Millions | |
| Recent Price: 10.26 Smart Investing & Trading Score: 51 | |
| Day Percent Change: -1.54% Day Change: -0.16 | |
| Week Change: -1.54% Year-to-date Change: 9.2% | |
| ZUO Links: Profile News Message Board | |
| Charts:- Daily , Weekly | |
| Add ZUO to Watchlist: View: Get Complete ZUO Trend Analysis ➞ | |
 | GHC Graham Holdings Company |
| Sector: Services & Goods | |
| SubSector: Education & Training Services | |
| MarketCap: 1871.06 Millions | |
| Recent Price: 759.82 Smart Investing & Trading Score: 75 | |
| Day Percent Change: -0.27% Day Change: -2.05 | |
| Week Change: -0.27% Year-to-date Change: 9.1% | |
| GHC Links: Profile News Message Board | |
| Charts:- Daily , Weekly | |
| Add GHC to Watchlist: View: Get Complete GHC Trend Analysis ➞ | |
 | CHRD Chord Energy Corporation |
| Sector: Energy | |
| SubSector: Oil & Gas E&P | |
| MarketCap: 6280 Millions | |
| Recent Price: 181.90 Smart Investing & Trading Score: 76 | |
| Day Percent Change: 0.73% Day Change: 1.31 | |
| Week Change: 0.73% Year-to-date Change: 9.0% | |
| CHRD Links: Profile News Message Board | |
| Charts:- Daily , Weekly | |
| Add CHRD to Watchlist: View: Get Complete CHRD Trend Analysis ➞ | |
 | MBC MasterBrand, Inc. |
| Sector: Services & Goods | |
| SubSector: Furnishings, Fixtures & Appliances | |
| MarketCap: 1480 Millions | |
| Recent Price: 16.26 Smart Investing & Trading Score: 0 | |
| Day Percent Change: -0.31% Day Change: -0.05 | |
| Week Change: -0.31% Year-to-date Change: 8.9% | |
| MBC Links: Profile News Message Board | |
| Charts:- Daily , Weekly | |
| Add MBC to Watchlist: View: Get Complete MBC Trend Analysis ➞ | |
 | OSIS OSI Systems, Inc. |
| Sector: Industrials | |
| SubSector: Industrial Electrical Equipment | |
| MarketCap: 1100.39 Millions | |
| Recent Price: 140.57 Smart Investing & Trading Score: 88 | |
| Day Percent Change: 0.93% Day Change: 1.30 | |
| Week Change: 0.93% Year-to-date Change: 8.9% | |
| OSIS Links: Profile News Message Board | |
| Charts:- Daily , Weekly | |
| Add OSIS to Watchlist: View: Get Complete OSIS Trend Analysis ➞ | |
 | TRMK Trustmark Corporation |
| Sector: Financials | |
| SubSector: Regional - Southeast Banks | |
| MarketCap: 1630.15 Millions | |
| Recent Price: 30.32 Smart Investing & Trading Score: 43 | |
| Day Percent Change: -1.46% Day Change: -0.45 | |
| Week Change: -1.46% Year-to-date Change: 8.8% | |
| TRMK Links: Profile News Message Board | |
| Charts:- Daily , Weekly | |
| Add TRMK to Watchlist: View: Get Complete TRMK Trend Analysis ➞ | |
 | DAWN Day One Biopharmaceuticals, Inc. |
| Sector: Health Care | |
| SubSector: Biotechnology | |
| MarketCap: 1040 Millions | |
| Recent Price: 15.97 Smart Investing & Trading Score: 5 | |
| Day Percent Change: -1.24% Day Change: -0.20 | |
| Week Change: -1.24% Year-to-date Change: 8.7% | |
| DAWN Links: Profile News Message Board | |
| Charts:- Daily , Weekly | |
| Add DAWN to Watchlist: View: Get Complete DAWN Trend Analysis ➞ | |
 | ALTR Altair Engineering Inc. |
| Sector: Technology | |
| SubSector: Semiconductor - Specialized | |
| MarketCap: 2072.2 Millions | |
| Recent Price: 91.47 Smart Investing & Trading Score: 81 | |
| Day Percent Change: 1.07% Day Change: 0.97 | |
| Week Change: 1.07% Year-to-date Change: 8.7% | |
| ALTR Links: Profile News Message Board | |
| Charts:- Daily , Weekly | |
| Add ALTR to Watchlist: View: Get Complete ALTR Trend Analysis ➞ | |
 | LMND Lemonade, Inc. |
| Sector: Financials | |
| SubSector: Insurance Property & Casualty | |
| MarketCap: 56457 Millions | |
| Recent Price: 17.51 Smart Investing & Trading Score: 63 | |
| Day Percent Change: -2.56% Day Change: -0.46 | |
| Week Change: -2.56% Year-to-date Change: 8.6% | |
| LMND Links: Profile News Message Board | |
| Charts:- Daily , Weekly | |
| Add LMND to Watchlist: View: Get Complete LMND Trend Analysis ➞ | |
 | HBI Hanesbrands Inc. |
| Sector: Consumer Staples | |
| SubSector: Textile - Apparel Clothing | |
| MarketCap: 3559.75 Millions | |
| Recent Price: 4.84 Smart Investing & Trading Score: 30 | |
| Day Percent Change: -3.78% Day Change: -0.19 | |
| Week Change: -3.78% Year-to-date Change: 8.5% | |
| HBI Links: Profile News Message Board | |
| Charts:- Daily , Weekly | |
| Add HBI to Watchlist: View: Get Complete HBI Trend Analysis ➞ | |
 | ACDC ProFrac Holding Corp. |
| Sector: Energy | |
| SubSector: Oil & Gas Equipment & Services | |
| MarketCap: 1830 Millions | |
| Recent Price: 9.23 Smart Investing & Trading Score: 100 | |
| Day Percent Change: 2.50% Day Change: 0.22 | |
| Week Change: 2.5% Year-to-date Change: 8.5% | |
| ACDC Links: Profile News Message Board | |
| Charts:- Daily , Weekly | |
| Add ACDC to Watchlist: View: Get Complete ACDC Trend Analysis ➞ | |
 | ULCC Frontier Group Holdings, Inc. |
| Sector: Industrials | |
| SubSector: Airlines | |
| MarketCap: 2160 Millions | |
| Recent Price: 5.88 Smart Investing & Trading Score: 25 | |
| Day Percent Change: -0.59% Day Change: -0.04 | |
| Week Change: -0.59% Year-to-date Change: 8.4% | |
| ULCC Links: Profile News Message Board | |
| Charts:- Daily , Weekly | |
| Add ULCC to Watchlist: View: Get Complete ULCC Trend Analysis ➞ | |
 | OTTR Otter Tail Corporation |
| Sector: Utilities | |
| SubSector: Diversified Utilities | |
| MarketCap: 1728.2 Millions | |
| Recent Price: 91.93 Smart Investing & Trading Score: 69 | |
| Day Percent Change: -0.25% Day Change: -0.23 | |
| Week Change: -0.25% Year-to-date Change: 8.2% | |
| OTTR Links: Profile News Message Board | |
| Charts:- Daily , Weekly | |
| Add OTTR to Watchlist: View: Get Complete OTTR Trend Analysis ➞ | |
 | EPC Edgewell Personal Care Company |
| Sector: Consumer Staples | |
| SubSector: Personal Products | |
| MarketCap: 1605.95 Millions | |
| Recent Price: 39.63 Smart Investing & Trading Score: 56 | |
| Day Percent Change: -1.86% Day Change: -0.75 | |
| Week Change: -1.86% Year-to-date Change: 8.2% | |
| EPC Links: Profile News Message Board | |
| Charts:- Daily , Weekly | |
| Add EPC to Watchlist: View: Get Complete EPC Trend Analysis ➞ | |
 | CVCO Cavco Industries, Inc. |
| Sector: Industrials | |
| SubSector: Residential Construction | |
| MarketCap: 1375.86 Millions | |
| Recent Price: 374.68 Smart Investing & Trading Score: 35 | |
| Day Percent Change: 0.13% Day Change: 0.47 | |
| Week Change: 0.13% Year-to-date Change: 8.1% | |
| CVCO Links: Profile News Message Board | |
| Charts:- Daily , Weekly | |
| Add CVCO to Watchlist: View: Get Complete CVCO Trend Analysis ➞ | |
 | NGVT Ingevity Corporation |
| Sector: Materials | |
| SubSector: Specialty Chemicals | |
| MarketCap: 1325.47 Millions | |
| Recent Price: 51.03 Smart Investing & Trading Score: 36 | |
| Day Percent Change: -4.71% Day Change: -2.52 | |
| Week Change: -4.71% Year-to-date Change: 8.1% | |
| NGVT Links: Profile News Message Board | |
| Charts:- Daily , Weekly | |
| Add NGVT to Watchlist: View: Get Complete NGVT Trend Analysis ➞ | |
| For tabular summary view of above stock list: Summary View ➞ 0 - 25 , 25 - 50 , 50 - 75 , 75 - 100 , 100 - 125 , 125 - 150 , 150 - 175 , 175 - 200 , 200 - 225 , 225 - 250 , 250 - 275 , 275 - 300 , 300 - 325 , 325 - 350 , 350 - 375 , 375 - 400 , 400 - 425 , 425 - 450 , 450 - 475 , 475 - 500 , 500 - 525 , 525 - 550 , 550 - 575 , 575 - 600 , 600 - 625 , 625 - 650 , 650 - 675 , 675 - 700 | ||
| Click To Change The Sort Order: By Market Cap or Company Size Performance: Year-to-date, Week and Day | |
| Select Chart Type: | ||
| Too many stocks? View smallcap stocks filtered by marketcap & sector |
| Marketcap: All SmallCap Stocks (default-no microcap), Large, Mid-Range, Small & MicroCap |
| Sector: Tech, Finance, Energy, Staples, Retail, Industrial, Materials, Utilities & Medical |
|
Best Stocks Today 12Stocks.com |
© 2024 12Stocks.com Terms & Conditions Privacy Contact Us
All Information Provided Only For Education And Not To Be Used For Investing or Trading. See Terms & Conditions


One More Thing ... Get Best Stocks Delivered Daily!
Never Ever Miss A Move With Our Top Ten Stocks Lists
Find Best Stocks In Any Market - Bull or Bear Market
Take A Peek At Our Top Ten Stocks Lists: Daily, Weekly, Year-to-Date & Top Trends
Find Best Stocks In Any Market - Bull or Bear Market
Take A Peek At Our Top Ten Stocks Lists: Daily, Weekly, Year-to-Date & Top Trends
Smallcap Stocks With Best Up Trends [0-bearish to 100-bullish]: Overseas Shipholding[100], PTC [100], Stoke [100], NuScale Power[100], NextDecade [100], Centrus Energy[100], Humacyte [100], Fossil Group[100], MicroStrategy [100], Riot Blockchain[100], Reneo [100]
Best Smallcap Stocks Year-to-Date:
CareMax [489.69%], Janux [346.63%], Viking [262.79%], Alpine Immune[241.23%], Longboard [241.08%], Avidity Biosciences[223.45%], Super Micro[218%], Novavax [208.13%], Stoke [206.08%], Sweetgreen [199.38%], Arcutis Bio[189.47%] Best Smallcap Stocks This Week:
Scilex Holding[34.44%], Dyne [27.82%], Comtech Tele[23.04%], Overseas Shipholding[22.74%], PTC [21.23%], Genelux [17.81%], Sutro Biopharma[16.71%], InnovAge Holding[16.49%], Tellurian [16.41%], Atara Bio[16.39%], Stoke [15.83%] Best Smallcap Stocks Daily:
Scilex Holding[34.44%], Dyne [27.82%], Comtech Tele[23.04%], Overseas Shipholding[22.74%], PTC [21.23%], Genelux [17.81%], Sutro Biopharma[16.71%], InnovAge Holding[16.49%], Tellurian [16.41%], Atara Bio[16.39%], Stoke [15.83%]