
 Login Sign Up


| |||||
 |  | ||||

| 12Stocks.com Market Intelligence |
Best SmallCap Stocks
|
| In a hurry? Small Cap Stock Lists: Performance Trends Table, Stock Charts
Sort Small Cap stocks: Daily, Weekly, Year-to-Date, Market Cap & Trends. Filter Small Cap stocks list by sector: Show all, Tech, Finance, Energy, Staples, Retail, Industrial, Materials, Utilities and HealthCare Filter Small Cap stocks list by size: All Large Medium Small and MicroCap |
| 12Stocks.com Small Cap Stocks Performances & Trends Daily | |||||||||
|
|  The overall Smart Investing & Trading Score is 88 (0-bearish to 100-bullish) which puts Small Cap index in short term bullish trend. The Smart Investing & Trading Score from previous trading session is 56 and hence an improvement of trend.
| ||||||||
Here are the Smart Investing & Trading Scores of the most requested small cap stocks at 12Stocks.com (click stock name for detailed review):
|


| 12Stocks.com: Investing in Smallcap Index with Stocks | |
|
The following table helps investors and traders sort through current performance and trends (as measured by Smart Investing & Trading Score) of various
stocks in the Smallcap Index. Quick View: Move mouse or cursor over stock symbol (ticker) to view short-term technical chart and over stock name to view long term chart. Click on  to add stock symbol to your watchlist and to add stock symbol to your watchlist and  to view watchlist. Click on any ticker or stock name for detailed market intelligence report for that stock. to view watchlist. Click on any ticker or stock name for detailed market intelligence report for that stock. |
12Stocks.com Performance of Stocks in Smallcap Index
| Ticker | Stock Name | Watchlist | Category | Recent Price | Smart Investing & Trading Score | Change % | YTD Change% |
| ALIT | Alight |   | Technology | 9.21 | 68 | 1.10% | 8.23% |
| PSMT | PriceSmart | | Services & Goods | 81.97 | 90 | 0.59% | 8.17% |
| ACIW | ACI Worldwide | | Technology | 33.10 | 85 | -0.60% | 8.17% |
| TMHC | Taylor Morrison | | Industrials | 57.70 | 80 | 0.24% | 8.15% |
| CVCO | Cavco Industries | | Industrials | 374.47 | 70 | 0.50% | 8.03% |
| FATE | Fate | | Health Care | 4.04 | 22 | 6.32% | 8.02% |
| JAMF | Jamf Holding | | Technology | 19.51 | 61 | -0.20% | 7.97% |
| NGVT | Ingevity | | Materials | 50.95 | 100 | 5.03% | 7.90% |
| ICFI | ICF | | Services & Goods | 144.37 | 83 | 1.75% | 7.67% |
| MIR | Mirion | | Industrials | 11.02 | 38 | -0.63% | 7.41% |
| TRMK | Trustmark | | Financials | 29.92 | 95 | -0.43% | 7.32% |
| LZ | LegalZoom.com | | Industrials | 12.17 | 56 | -2.52% | 7.18% |
| SQSP | Squarespace | | Technology | 35.56 | 48 | 0.08% | 7.14% |
| BGS | B&G Foods | | Consumer Staples | 11.24 | 83 | 1.63% | 7.05% |
| HAE | Haemonetics | | Health Care | 91.50 | 100 | 0.56% | 7.01% |
| NNI | Nelnet | | Financials | 94.38 | 75 | -0.46% | 6.98% |
| AIT | Applied Industrial | | Services & Goods | 184.73 | 43 | 2.12% | 6.97% |
| FELE | Franklin Electric | | Industrials | 103.24 | 83 | 0.46% | 6.82% |
| TPH | TRI Pointe | | Industrials | 37.78 | 100 | -0.26% | 6.72% |
| ZUO | Zuora | | Technology | 10.02 | 75 | 0.70% | 6.60% |
| FCFS | FirstCash | | Financials | 115.35 | 20 | -0.31% | 6.42% |
| DORM | Dorman Products | | Consumer Staples | 88.76 | 61 | -0.53% | 6.41% |
| HLMN | Hillman Solutions | | Industrials | 9.83 | 55 | 0.82% | 6.33% |
| JBLU | JetBlue Airways | | Transports | 5.90 | 43 | 2.08% | 6.31% |
| CWST | Casella Waste | | Industrials | 90.82 | 36 | 0.84% | 6.27% |
| For chart view version of above stock list: Chart View ➞ 0 - 25 , 25 - 50 , 50 - 75 , 75 - 100 , 100 - 125 , 125 - 150 , 150 - 175 , 175 - 200 , 200 - 225 , 225 - 250 , 250 - 275 , 275 - 300 , 300 - 325 , 325 - 350 , 350 - 375 , 375 - 400 , 400 - 425 , 425 - 450 , 450 - 475 , 475 - 500 , 500 - 525 , 525 - 550 , 550 - 575 , 575 - 600 , 600 - 625 , 625 - 650 , 650 - 675 , 675 - 700 | ||
 | Click To Change The Sort Order: By Market Cap or Company Size Performance: Year-to-date, Week and Day |  |
| Too many stocks? View smallcap stocks filtered by marketcap & sector |
| Marketcap: All SmallCap Stocks (default-no microcap), Large, Mid-Range, Small |
| Smallcap Sector: Tech, Finance, Energy, Staples, Retail, Industrial, Materials, & Medical |
|
Get the most comprehensive stock market coverage daily at 12Stocks.com ➞ Best Stocks Today ➞ Best Stocks Weekly ➞ Best Stocks Year-to-Date ➞ Best Stocks Trends ➞  Best Stocks Today 12Stocks.com Best Nasdaq Stocks ➞ Best S&P 500 Stocks ➞ Best Tech Stocks ➞ Best Biotech Stocks ➞ |
| Detailed Overview of SmallCap Stocks |
| SmallCap Technical Overview, Leaders & Laggards, Top SmallCap ETF Funds & Detailed SmallCap Stocks List, Charts, Trends & More |
| Smallcap: Technical Analysis, Trends & YTD Performance | |
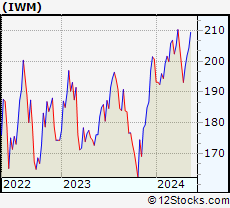
| SmallCap segment as represented by
IWM, an exchange-traded fund [ETF], holds basket of thousands of smallcap stocks from across all major sectors of the US stock market. The smallcap index (contains stocks like Riverbed & Sotheby's) is down by -0.37% and is currently underperforming the overall market by -6.93% year-to-date. Below is a quick view of technical charts and trends: | |
 IWM Weekly Chart |
|
| Long Term Trend: Very Good | |
| Medium Term Trend: Good | |
 IWM Daily Chart |
|
| Short Term Trend: Very Good | |
| Overall Trend Score: 88 | |
| YTD Performance: -0.37% | |
| **Trend Scores & Views Are Only For Educational Purposes And Not For Investing | |
| 12Stocks.com: Top Performing Small Cap Index Stocks | ||||||||||||||||||||||||||||||||||||||||||||||||
 The top performing Small Cap Index stocks year to date are
Now, more recently, over last week, the top performing Small Cap Index stocks on the move are


|
||||||||||||||||||||||||||||||||||||||||||||||||
| 12Stocks.com: Investing in Smallcap Index using Exchange Traded Funds | |
|
The following table shows list of key exchange traded funds (ETF) that
help investors track Smallcap index. The following list also includes leveraged ETF funds that track twice or thrice the daily returns of Smallcap indices. Short or inverse ETF funds move in the opposite direction to the index they track and are useful during market pullbacks or during bear markets. Quick View: Move mouse or cursor over ETF symbol (ticker) to view short-term technical chart and over ETF name to view long term chart. Click on ticker or stock name for detailed view. Click on to add stock symbol to your watchlist and to view watchlist. |
12Stocks.com List of ETFs that track Smallcap Index
| Ticker | ETF Name | Watchlist | Recent Price | Smart Investing & Trading Score | Change % | Week % | Year-to-date % |
| IWM | iShares Russell 2000 | | 199.96 | 88 | 0.79 | 0.79 | -0.37% |
| IJR | iShares Core S&P Small-Cap | | 106.41 | 93 | 0.72 | 0.72 | -1.7% |
| VTWO | Vanguard Russell 2000 ETF | | 80.78 | 88 | 0.70 | 0.7 | -0.39% |
| IWN | iShares Russell 2000 Value | | 152.05 | 93 | 0.60 | 0.6 | -2.11% |
| IWO | iShares Russell 2000 Growth | | 255.74 | 78 | 1.05 | 1.05 | 1.4% |
| IJS | iShares S&P Small-Cap 600 Value | | 97.95 | 70 | 0.78 | 0.78 | -4.97% |
| IJT | iShares S&P Small-Cap 600 Growth | | 126.96 | 88 | 0.69 | 0.69 | 1.45% |
| XSLV | PowerShares S&P SmallCap Low Volatil ETF | | 42.87 | 80 | 0.35 | 0.35 | -2.9% |
| SMLV | SPDR SSGA US Small Cap Low Volatil ETF | | 107.77 | 68 | 0.23 | 0.23 | -4.22% |
| SAA | ProShares Ultra SmallCap600 | | 23.27 | 88 | 1.00 | 1 | -6.73% |
| SBB | ProShares Short SmallCap600 | | 16.28 | 8 | -0.64 | -0.64 | 2.2% |
| SDD | ProShares UltraShort SmallCap600 | | 19.09 | 15 | -1.34 | -1.34 | 3.6% |
| 12Stocks.com: Charts, Trends, Fundamental Data and Performances of SmallCap Stocks | |
|
We now take in-depth look at all SmallCap stocks including charts, multi-period performances and overall trends (as measured by Smart Investing & Trading Score). One can sort SmallCap stocks (click link to choose) by Daily, Weekly and by Year-to-Date performances. Also, one can sort by size of the company or by market capitalization. |
| Select Your Default Chart Type: | |||||
| |||||
| Click on stock symbol or name for detailed view. Click on to add stock symbol to your watchlist and to view watchlist. Quick View: Move mouse or cursor over "Daily" to quickly view daily technical stock chart and over "Weekly" to view weekly technical stock chart. | |||||

 | ALIT Alight, Inc. |
| Sector: Technology | |
| SubSector: Software - Application | |
| MarketCap: 5130 Millions | |
| Recent Price: 9.21 Smart Investing & Trading Score: 68 | |
| Day Percent Change: 1.10% Day Change: 0.10 | |
| Week Change: 1.1% Year-to-date Change: 8.2% | |
| ALIT Links: Profile News Message Board | |
| Charts:- Daily , Weekly | |
| Add ALIT to Watchlist: View: Get Complete ALIT Trend Analysis ➞ | |
 | PSMT PriceSmart, Inc. |
| Sector: Services & Goods | |
| SubSector: Discount, Variety Stores | |
| MarketCap: 1655.72 Millions | |
| Recent Price: 81.97 Smart Investing & Trading Score: 90 | |
| Day Percent Change: 0.59% Day Change: 0.48 | |
| Week Change: 0.59% Year-to-date Change: 8.2% | |
| PSMT Links: Profile News Message Board | |
| Charts:- Daily , Weekly | |
| Add PSMT to Watchlist: View: Get Complete PSMT Trend Analysis ➞ | |
 | ACIW ACI Worldwide, Inc. |
| Sector: Technology | |
| SubSector: Technical & System Software | |
| MarketCap: 2645.7 Millions | |
| Recent Price: 33.10 Smart Investing & Trading Score: 85 | |
| Day Percent Change: -0.60% Day Change: -0.20 | |
| Week Change: -0.6% Year-to-date Change: 8.2% | |
| ACIW Links: Profile News Message Board | |
| Charts:- Daily , Weekly | |
| Add ACIW to Watchlist: View: Get Complete ACIW Trend Analysis ➞ | |
 | TMHC Taylor Morrison Home Corporation |
| Sector: Industrials | |
| SubSector: Residential Construction | |
| MarketCap: 1336.76 Millions | |
| Recent Price: 57.70 Smart Investing & Trading Score: 80 | |
| Day Percent Change: 0.24% Day Change: 0.14 | |
| Week Change: 0.24% Year-to-date Change: 8.2% | |
| TMHC Links: Profile News Message Board | |
| Charts:- Daily , Weekly | |
| Add TMHC to Watchlist: View: Get Complete TMHC Trend Analysis ➞ | |
 | CVCO Cavco Industries, Inc. |
| Sector: Industrials | |
| SubSector: Residential Construction | |
| MarketCap: 1375.86 Millions | |
| Recent Price: 374.47 Smart Investing & Trading Score: 70 | |
| Day Percent Change: 0.50% Day Change: 1.86 | |
| Week Change: 0.5% Year-to-date Change: 8.0% | |
| CVCO Links: Profile News Message Board | |
| Charts:- Daily , Weekly | |
| Add CVCO to Watchlist: View: Get Complete CVCO Trend Analysis ➞ | |
 | FATE Fate Therapeutics, Inc. |
| Sector: Health Care | |
| SubSector: Biotechnology | |
| MarketCap: 2022.45 Millions | |
| Recent Price: 4.04 Smart Investing & Trading Score: 22 | |
| Day Percent Change: 6.32% Day Change: 0.24 | |
| Week Change: 6.32% Year-to-date Change: 8.0% | |
| FATE Links: Profile News Message Board | |
| Charts:- Daily , Weekly | |
| Add FATE to Watchlist: View: Get Complete FATE Trend Analysis ➞ | |
 | JAMF Jamf Holding Corp. |
| Sector: Technology | |
| SubSector: Software Application | |
| MarketCap: 36987 Millions | |
| Recent Price: 19.51 Smart Investing & Trading Score: 61 | |
| Day Percent Change: -0.20% Day Change: -0.04 | |
| Week Change: -0.2% Year-to-date Change: 8.0% | |
| JAMF Links: Profile News Message Board | |
| Charts:- Daily , Weekly | |
| Add JAMF to Watchlist: View: Get Complete JAMF Trend Analysis ➞ | |
 | NGVT Ingevity Corporation |
| Sector: Materials | |
| SubSector: Specialty Chemicals | |
| MarketCap: 1325.47 Millions | |
| Recent Price: 50.95 Smart Investing & Trading Score: 100 | |
| Day Percent Change: 5.03% Day Change: 2.44 | |
| Week Change: 5.03% Year-to-date Change: 7.9% | |
| NGVT Links: Profile News Message Board | |
| Charts:- Daily , Weekly | |
| Add NGVT to Watchlist: View: Get Complete NGVT Trend Analysis ➞ | |
 | ICFI ICF International, Inc. |
| Sector: Services & Goods | |
| SubSector: Management Services | |
| MarketCap: 1218.75 Millions | |
| Recent Price: 144.37 Smart Investing & Trading Score: 83 | |
| Day Percent Change: 1.75% Day Change: 2.48 | |
| Week Change: 1.75% Year-to-date Change: 7.7% | |
| ICFI Links: Profile News Message Board | |
| Charts:- Daily , Weekly | |
| Add ICFI to Watchlist: View: Get Complete ICFI Trend Analysis ➞ | |
 | MIR Mirion Technologies, Inc. |
| Sector: Industrials | |
| SubSector: Specialty Industrial Machinery | |
| MarketCap: 1920 Millions | |
| Recent Price: 11.02 Smart Investing & Trading Score: 38 | |
| Day Percent Change: -0.63% Day Change: -0.07 | |
| Week Change: -0.63% Year-to-date Change: 7.4% | |
| MIR Links: Profile News Message Board | |
| Charts:- Daily , Weekly | |
| Add MIR to Watchlist: View: Get Complete MIR Trend Analysis ➞ | |
 | TRMK Trustmark Corporation |
| Sector: Financials | |
| SubSector: Regional - Southeast Banks | |
| MarketCap: 1630.15 Millions | |
| Recent Price: 29.92 Smart Investing & Trading Score: 95 | |
| Day Percent Change: -0.43% Day Change: -0.13 | |
| Week Change: -0.43% Year-to-date Change: 7.3% | |
| TRMK Links: Profile News Message Board | |
| Charts:- Daily , Weekly | |
| Add TRMK to Watchlist: View: Get Complete TRMK Trend Analysis ➞ | |
 | LZ LegalZoom.com, Inc. |
| Sector: Industrials | |
| SubSector: Specialty Business Services | |
| MarketCap: 2330 Millions | |
| Recent Price: 12.17 Smart Investing & Trading Score: 56 | |
| Day Percent Change: -2.52% Day Change: -0.31 | |
| Week Change: -2.52% Year-to-date Change: 7.2% | |
| LZ Links: Profile News Message Board | |
| Charts:- Daily , Weekly | |
| Add LZ to Watchlist: View: Get Complete LZ Trend Analysis ➞ | |
 | SQSP Squarespace, Inc. |
| Sector: Technology | |
| SubSector: Software - Infrastructure | |
| MarketCap: 4150 Millions | |
| Recent Price: 35.56 Smart Investing & Trading Score: 48 | |
| Day Percent Change: 0.08% Day Change: 0.03 | |
| Week Change: 0.08% Year-to-date Change: 7.1% | |
| SQSP Links: Profile News Message Board | |
| Charts:- Daily , Weekly | |
| Add SQSP to Watchlist: View: Get Complete SQSP Trend Analysis ➞ | |
 | BGS B&G Foods, Inc. |
| Sector: Consumer Staples | |
| SubSector: Processed & Packaged Goods | |
| MarketCap: 1456.08 Millions | |
| Recent Price: 11.24 Smart Investing & Trading Score: 83 | |
| Day Percent Change: 1.63% Day Change: 0.18 | |
| Week Change: 1.63% Year-to-date Change: 7.1% | |
| BGS Links: Profile News Message Board | |
| Charts:- Daily , Weekly | |
| Add BGS to Watchlist: View: Get Complete BGS Trend Analysis ➞ | |
 | HAE Haemonetics Corporation |
| Sector: Health Care | |
| SubSector: Medical Instruments & Supplies | |
| MarketCap: 4500.7 Millions | |
| Recent Price: 91.50 Smart Investing & Trading Score: 100 | |
| Day Percent Change: 0.56% Day Change: 0.51 | |
| Week Change: 0.56% Year-to-date Change: 7.0% | |
| HAE Links: Profile News Message Board | |
| Charts:- Daily , Weekly | |
| Add HAE to Watchlist: View: Get Complete HAE Trend Analysis ➞ | |
 | NNI Nelnet, Inc. |
| Sector: Financials | |
| SubSector: Credit Services | |
| MarketCap: 1664.38 Millions | |
| Recent Price: 94.38 Smart Investing & Trading Score: 75 | |
| Day Percent Change: -0.46% Day Change: -0.44 | |
| Week Change: -0.46% Year-to-date Change: 7.0% | |
| NNI Links: Profile News Message Board | |
| Charts:- Daily , Weekly | |
| Add NNI to Watchlist: View: Get Complete NNI Trend Analysis ➞ | |
 | AIT Applied Industrial Technologies, Inc. |
| Sector: Services & Goods | |
| SubSector: Industrial Equipment Wholesale | |
| MarketCap: 1531.58 Millions | |
| Recent Price: 184.73 Smart Investing & Trading Score: 43 | |
| Day Percent Change: 2.12% Day Change: 3.84 | |
| Week Change: 2.12% Year-to-date Change: 7.0% | |
| AIT Links: Profile News Message Board | |
| Charts:- Daily , Weekly | |
| Add AIT to Watchlist: View: Get Complete AIT Trend Analysis ➞ | |
 | FELE Franklin Electric Co., Inc. |
| Sector: Industrials | |
| SubSector: Industrial Electrical Equipment | |
| MarketCap: 2397.89 Millions | |
| Recent Price: 103.24 Smart Investing & Trading Score: 83 | |
| Day Percent Change: 0.46% Day Change: 0.47 | |
| Week Change: 0.46% Year-to-date Change: 6.8% | |
| FELE Links: Profile News Message Board | |
| Charts:- Daily , Weekly | |
| Add FELE to Watchlist: View: Get Complete FELE Trend Analysis ➞ | |
 | TPH TRI Pointe Group, Inc. |
| Sector: Industrials | |
| SubSector: Residential Construction | |
| MarketCap: 1140.06 Millions | |
| Recent Price: 37.78 Smart Investing & Trading Score: 100 | |
| Day Percent Change: -0.26% Day Change: -0.10 | |
| Week Change: -0.26% Year-to-date Change: 6.7% | |
| TPH Links: Profile News Message Board | |
| Charts:- Daily , Weekly | |
| Add TPH to Watchlist: View: Get Complete TPH Trend Analysis ➞ | |
 | ZUO Zuora, Inc. |
| Sector: Technology | |
| SubSector: Application Software | |
| MarketCap: 1063.22 Millions | |
| Recent Price: 10.02 Smart Investing & Trading Score: 75 | |
| Day Percent Change: 0.70% Day Change: 0.07 | |
| Week Change: 0.7% Year-to-date Change: 6.6% | |
| ZUO Links: Profile News Message Board | |
| Charts:- Daily , Weekly | |
| Add ZUO to Watchlist: View: Get Complete ZUO Trend Analysis ➞ | |
 | FCFS FirstCash, Inc. |
| Sector: Financials | |
| SubSector: Credit Services | |
| MarketCap: 2795.48 Millions | |
| Recent Price: 115.35 Smart Investing & Trading Score: 20 | |
| Day Percent Change: -0.31% Day Change: -0.36 | |
| Week Change: -0.31% Year-to-date Change: 6.4% | |
| FCFS Links: Profile News Message Board | |
| Charts:- Daily , Weekly | |
| Add FCFS to Watchlist: View: Get Complete FCFS Trend Analysis ➞ | |
 | DORM Dorman Products, Inc. |
| Sector: Consumer Staples | |
| SubSector: Auto Parts | |
| MarketCap: 2028.79 Millions | |
| Recent Price: 88.76 Smart Investing & Trading Score: 61 | |
| Day Percent Change: -0.53% Day Change: -0.47 | |
| Week Change: -0.53% Year-to-date Change: 6.4% | |
| DORM Links: Profile News Message Board | |
| Charts:- Daily , Weekly | |
| Add DORM to Watchlist: View: Get Complete DORM Trend Analysis ➞ | |
 | HLMN Hillman Solutions Corp. |
| Sector: Industrials | |
| SubSector: Tools & Accessories | |
| MarketCap: 1720 Millions | |
| Recent Price: 9.83 Smart Investing & Trading Score: 55 | |
| Day Percent Change: 0.82% Day Change: 0.08 | |
| Week Change: 0.82% Year-to-date Change: 6.3% | |
| HLMN Links: Profile News Message Board | |
| Charts:- Daily , Weekly | |
| Add HLMN to Watchlist: View: Get Complete HLMN Trend Analysis ➞ | |
 | JBLU JetBlue Airways Corporation |
| Sector: Transports | |
| SubSector: Regional Airlines | |
| MarketCap: 2383.1 Millions | |
| Recent Price: 5.90 Smart Investing & Trading Score: 43 | |
| Day Percent Change: 2.08% Day Change: 0.12 | |
| Week Change: 2.08% Year-to-date Change: 6.3% | |
| JBLU Links: Profile News Message Board | |
| Charts:- Daily , Weekly | |
| Add JBLU to Watchlist: View: Get Complete JBLU Trend Analysis ➞ | |
 | CWST Casella Waste Systems, Inc. |
| Sector: Industrials | |
| SubSector: Waste Management | |
| MarketCap: 2093.38 Millions | |
| Recent Price: 90.82 Smart Investing & Trading Score: 36 | |
| Day Percent Change: 0.84% Day Change: 0.76 | |
| Week Change: 0.84% Year-to-date Change: 6.3% | |
| CWST Links: Profile News Message Board | |
| Charts:- Daily , Weekly | |
| Add CWST to Watchlist: View: Get Complete CWST Trend Analysis ➞ | |
| For tabular summary view of above stock list: Summary View ➞ 0 - 25 , 25 - 50 , 50 - 75 , 75 - 100 , 100 - 125 , 125 - 150 , 150 - 175 , 175 - 200 , 200 - 225 , 225 - 250 , 250 - 275 , 275 - 300 , 300 - 325 , 325 - 350 , 350 - 375 , 375 - 400 , 400 - 425 , 425 - 450 , 450 - 475 , 475 - 500 , 500 - 525 , 525 - 550 , 550 - 575 , 575 - 600 , 600 - 625 , 625 - 650 , 650 - 675 , 675 - 700 | ||
| Click To Change The Sort Order: By Market Cap or Company Size Performance: Year-to-date, Week and Day | |
| Select Chart Type: | ||
| Too many stocks? View smallcap stocks filtered by marketcap & sector |
| Marketcap: All SmallCap Stocks (default-no microcap), Large, Mid-Range, Small & MicroCap |
| Sector: Tech, Finance, Energy, Staples, Retail, Industrial, Materials, Utilities & Medical |
|
Best Stocks Today 12Stocks.com |
© 2024 12Stocks.com Terms & Conditions Privacy Contact Us
All Information Provided Only For Education And Not To Be Used For Investing or Trading. See Terms & Conditions


One More Thing ... Get Best Stocks Delivered Daily!
Never Ever Miss A Move With Our Top Ten Stocks Lists
Find Best Stocks In Any Market - Bull or Bear Market
Take A Peek At Our Top Ten Stocks Lists: Daily, Weekly, Year-to-Date & Top Trends
Find Best Stocks In Any Market - Bull or Bear Market
Take A Peek At Our Top Ten Stocks Lists: Daily, Weekly, Year-to-Date & Top Trends
Smallcap Stocks With Best Up Trends [0-bearish to 100-bullish]: Bakkt [100], Deciphera [100], Phibro Animal[100], Heartland Financial[100], PTC [100], Sight Sciences[100], Richardson Electronics[100], Fulton Financial[100], TPI Composites[100], Cullinan Oncology[100], Lands [100]
Best Smallcap Stocks Year-to-Date:
CareMax [580.41%], Janux [421.92%], Bakkt [346.64%], Viking [305.75%], Longboard [247.46%], Alpine Immune[239.81%], Super Micro[213.22%], Avidity Biosciences[173.23%], Arcutis Bio[171.83%], Vera [167.31%], Cullinan Oncology[166.01%] Best Smallcap Stocks This Week:
Deciphera [72.56%], Phibro Animal[31.81%], Vaxxinity [31.65%], Zevia PBC[20.94%], Velo3D [19.97%], Acrivon [18.2%], Janux [18.18%], MultiPlan [15.53%], Heartland Financial[15.15%], Codexis [14.66%], Eyenovia [13.37%] Best Smallcap Stocks Daily:
Bakkt [2391.87%], Deciphera [72.56%], Phibro Animal[31.81%], Vaxxinity [31.65%], Zevia PBC[20.94%], Velo3D [19.97%], Acrivon [18.20%], Janux [18.18%], MultiPlan [15.53%], Heartland Financial[15.15%], Codexis [14.66%]