
 Login Sign Up


| |||||
 |  | ||||

| 12Stocks.com Market Intelligence |
Best SmallCap Stocks
|
| In a hurry? Small Cap Stock Lists: Performance Trends Table, Stock Charts
Sort Small Cap stocks: Daily, Weekly, Year-to-Date, Market Cap & Trends. Filter Small Cap stocks list by sector: Show all, Tech, Finance, Energy, Staples, Retail, Industrial, Materials, Utilities and HealthCare Filter Small Cap stocks list by size: All Large Medium Small and MicroCap |
| 12Stocks.com Small Cap Stocks Performances & Trends Daily | |||||||||
|
|  The overall Smart Investing & Trading Score is 88 (0-bearish to 100-bullish) which puts Small Cap index in short term bullish trend. The Smart Investing & Trading Score from previous trading session is 56 and hence an improvement of trend.
| ||||||||
Here are the Smart Investing & Trading Scores of the most requested small cap stocks at 12Stocks.com (click stock name for detailed review):
|


| 12Stocks.com: Investing in Smallcap Index with Stocks | |
|
The following table helps investors and traders sort through current performance and trends (as measured by Smart Investing & Trading Score) of various
stocks in the Smallcap Index. Quick View: Move mouse or cursor over stock symbol (ticker) to view short-term technical chart and over stock name to view long term chart. Click on  to add stock symbol to your watchlist and to add stock symbol to your watchlist and  to view watchlist. Click on any ticker or stock name for detailed market intelligence report for that stock. to view watchlist. Click on any ticker or stock name for detailed market intelligence report for that stock. |
12Stocks.com Performance of Stocks in Smallcap Index
| Ticker | Stock Name | Watchlist | Category | Recent Price | Smart Investing & Trading Score | Change % | YTD Change% |
| JELD | JELD-WEN Holding |   | Industrials | 21.00 | 93 | -1.87% | 11.23% |
| DDS | Dillard s | | Services & Goods | 448.40 | 93 | -0.13% | 11.09% |
| FSS | Federal Signal | | Industrials | 85.18 | 95 | 1.55% | 11.00% |
| BRCC | BRC | | Consumer Staples | 4.04 | 36 | -1.70% | 10.99% |
| LMND | Lemonade | | Financials | 17.89 | 100 | -0.33% | 10.91% |
| ATRI | Atrion | | Health Care | 420.00 | 80 | 6.33% | 10.88% |
| KOD | Kodiak Sciences | | Health Care | 3.37 | 17 | 2.74% | 10.86% |
| STER | Sterling Check | | Technology | 15.44 | 78 | 0.85% | 10.84% |
| CHRD | Chord Energy | | Energy | 184.34 | 61 | -0.71% | 10.47% |
| IE | Ivanhoe Electric | | Materials | 11.19 | 100 | 4.78% | 10.41% |
| KIND | Nextdoor | | Services & Goods | 2.04 | 38 | 0.99% | 10.27% |
| CTRE | CareTrust REIT | | Financials | 24.67 | 100 | 1.48% | 10.23% |
| EE | Excelerate Energy | | Utilities | 17.15 | 95 | -0.35% | 10.22% |
| SXT | Sensient | | Materials | 72.68 | 100 | 3.30% | 10.12% |
| CMC | Commercial Metals | | Materials | 54.87 | 76 | 2.60% | 9.65% |
| LAUR | Laureate Education | | Services & Goods | 15.00 | 100 | 1.35% | 9.41% |
| HTLF | Heartland Financial | | Financials | 41.13 | 100 | 15.15% | 9.36% |
| BDC | Belden | | Industrials | 84.44 | 68 | 1.25% | 9.31% |
| CVI | CVR Energy | | Energy | 33.12 | 10 | -0.30% | 9.31% |
| EIG | Employers | | Financials | 43.06 | 53 | -2.16% | 9.29% |
| FORM | FormFactor | | Technology | 45.53 | 85 | 1.74% | 9.16% |
| MGEE | MGE Energy | | Utilities | 78.50 | 83 | 1.16% | 8.56% |
| LIVN | LivaNova | | Health Care | 56.17 | 93 | 1.15% | 8.56% |
| B | Barnes Group | | Industrials | 35.39 | 61 | 2.67% | 8.46% |
| HGV | Hilton Grand | | Services & Goods | 43.50 | 51 | -1.89% | 8.26% |
| For chart view version of above stock list: Chart View ➞ 0 - 25 , 25 - 50 , 50 - 75 , 75 - 100 , 100 - 125 , 125 - 150 , 150 - 175 , 175 - 200 , 200 - 225 , 225 - 250 , 250 - 275 , 275 - 300 , 300 - 325 , 325 - 350 , 350 - 375 , 375 - 400 , 400 - 425 , 425 - 450 , 450 - 475 , 475 - 500 , 500 - 525 , 525 - 550 , 550 - 575 , 575 - 600 , 600 - 625 , 625 - 650 , 650 - 675 , 675 - 700 | ||
 | Click To Change The Sort Order: By Market Cap or Company Size Performance: Year-to-date, Week and Day |  |
| Too many stocks? View smallcap stocks filtered by marketcap & sector |
| Marketcap: All SmallCap Stocks (default-no microcap), Large, Mid-Range, Small |
| Smallcap Sector: Tech, Finance, Energy, Staples, Retail, Industrial, Materials, & Medical |
|
Get the most comprehensive stock market coverage daily at 12Stocks.com ➞ Best Stocks Today ➞ Best Stocks Weekly ➞ Best Stocks Year-to-Date ➞ Best Stocks Trends ➞  Best Stocks Today 12Stocks.com Best Nasdaq Stocks ➞ Best S&P 500 Stocks ➞ Best Tech Stocks ➞ Best Biotech Stocks ➞ |
| Detailed Overview of SmallCap Stocks |
| SmallCap Technical Overview, Leaders & Laggards, Top SmallCap ETF Funds & Detailed SmallCap Stocks List, Charts, Trends & More |
| Smallcap: Technical Analysis, Trends & YTD Performance | |
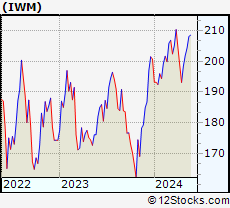
| SmallCap segment as represented by
IWM, an exchange-traded fund [ETF], holds basket of thousands of smallcap stocks from across all major sectors of the US stock market. The smallcap index (contains stocks like Riverbed & Sotheby's) is down by -0.37% and is currently underperforming the overall market by -6.93% year-to-date. Below is a quick view of technical charts and trends: | |
 IWM Weekly Chart |
|
| Long Term Trend: Very Good | |
| Medium Term Trend: Good | |
 IWM Daily Chart |
|
| Short Term Trend: Very Good | |
| Overall Trend Score: 88 | |
| YTD Performance: -0.37% | |
| **Trend Scores & Views Are Only For Educational Purposes And Not For Investing | |
| 12Stocks.com: Top Performing Small Cap Index Stocks | ||||||||||||||||||||||||||||||||||||||||||||||||
 The top performing Small Cap Index stocks year to date are
Now, more recently, over last week, the top performing Small Cap Index stocks on the move are


|
||||||||||||||||||||||||||||||||||||||||||||||||
| 12Stocks.com: Investing in Smallcap Index using Exchange Traded Funds | |
|
The following table shows list of key exchange traded funds (ETF) that
help investors track Smallcap index. The following list also includes leveraged ETF funds that track twice or thrice the daily returns of Smallcap indices. Short or inverse ETF funds move in the opposite direction to the index they track and are useful during market pullbacks or during bear markets. Quick View: Move mouse or cursor over ETF symbol (ticker) to view short-term technical chart and over ETF name to view long term chart. Click on ticker or stock name for detailed view. Click on to add stock symbol to your watchlist and to view watchlist. |
12Stocks.com List of ETFs that track Smallcap Index
| Ticker | ETF Name | Watchlist | Recent Price | Smart Investing & Trading Score | Change % | Week % | Year-to-date % |
| IWM | iShares Russell 2000 | | 199.96 | 88 | 0.79 | 0.79 | -0.37% |
| IJR | iShares Core S&P Small-Cap | | 106.41 | 93 | 0.72 | 0.72 | -1.7% |
| VTWO | Vanguard Russell 2000 ETF | | 80.78 | 88 | 0.70 | 0.7 | -0.39% |
| IWN | iShares Russell 2000 Value | | 152.05 | 93 | 0.60 | 0.6 | -2.11% |
| IWO | iShares Russell 2000 Growth | | 255.74 | 88 | 1.05 | 1.05 | 1.4% |
| IJS | iShares S&P Small-Cap 600 Value | | 97.95 | 75 | 0.78 | 0.78 | -4.97% |
| IJT | iShares S&P Small-Cap 600 Growth | | 126.96 | 95 | 0.69 | 0.69 | 1.45% |
| XSLV | PowerShares S&P SmallCap Low Volatil ETF | | 42.87 | 80 | 0.35 | 0.35 | -2.9% |
| SMLV | SPDR SSGA US Small Cap Low Volatil ETF | | 107.77 | 68 | 0.23 | 0.23 | -4.22% |
| SAA | ProShares Ultra SmallCap600 | | 23.27 | 95 | 1.00 | 1 | -6.73% |
| SBB | ProShares Short SmallCap600 | | 16.28 | 8 | -0.64 | -0.64 | 2.2% |
| SDD | ProShares UltraShort SmallCap600 | | 19.09 | 10 | -1.34 | -1.34 | 3.6% |
| 12Stocks.com: Charts, Trends, Fundamental Data and Performances of SmallCap Stocks | |
|
We now take in-depth look at all SmallCap stocks including charts, multi-period performances and overall trends (as measured by Smart Investing & Trading Score). One can sort SmallCap stocks (click link to choose) by Daily, Weekly and by Year-to-Date performances. Also, one can sort by size of the company or by market capitalization. |
| Select Your Default Chart Type: | |||||
| |||||
| Click on stock symbol or name for detailed view. Click on to add stock symbol to your watchlist and to view watchlist. Quick View: Move mouse or cursor over "Daily" to quickly view daily technical stock chart and over "Weekly" to view weekly technical stock chart. | |||||

 | JELD JELD-WEN Holding, Inc. |
| Sector: Industrials | |
| SubSector: General Building Materials | |
| MarketCap: 1022.53 Millions | |
| Recent Price: 21.00 Smart Investing & Trading Score: 93 | |
| Day Percent Change: -1.87% Day Change: -0.40 | |
| Week Change: -1.87% Year-to-date Change: 11.2% | |
| JELD Links: Profile News Message Board | |
| Charts:- Daily , Weekly | |
| Add JELD to Watchlist: View: Get Complete JELD Trend Analysis ➞ | |
 | DDS Dillard s, Inc. |
| Sector: Services & Goods | |
| SubSector: Department Stores | |
| MarketCap: 1170.82 Millions | |
| Recent Price: 448.40 Smart Investing & Trading Score: 93 | |
| Day Percent Change: -0.13% Day Change: -0.57 | |
| Week Change: -0.13% Year-to-date Change: 11.1% | |
| DDS Links: Profile News Message Board | |
| Charts:- Daily , Weekly | |
| Add DDS to Watchlist: View: Get Complete DDS Trend Analysis ➞ | |
 | FSS Federal Signal Corporation |
| Sector: Industrials | |
| SubSector: Pollution & Treatment Controls | |
| MarketCap: 1694.05 Millions | |
| Recent Price: 85.18 Smart Investing & Trading Score: 95 | |
| Day Percent Change: 1.55% Day Change: 1.30 | |
| Week Change: 1.55% Year-to-date Change: 11.0% | |
| FSS Links: Profile News Message Board | |
| Charts:- Daily , Weekly | |
| Add FSS to Watchlist: View: Get Complete FSS Trend Analysis ➞ | |
 | BRCC BRC Inc. |
| Sector: Consumer Staples | |
| SubSector: Packaged Foods | |
| MarketCap: 1110 Millions | |
| Recent Price: 4.04 Smart Investing & Trading Score: 36 | |
| Day Percent Change: -1.70% Day Change: -0.07 | |
| Week Change: -1.7% Year-to-date Change: 11.0% | |
| BRCC Links: Profile News Message Board | |
| Charts:- Daily , Weekly | |
| Add BRCC to Watchlist: View: Get Complete BRCC Trend Analysis ➞ | |
 | LMND Lemonade, Inc. |
| Sector: Financials | |
| SubSector: Insurance Property & Casualty | |
| MarketCap: 56457 Millions | |
| Recent Price: 17.89 Smart Investing & Trading Score: 100 | |
| Day Percent Change: -0.33% Day Change: -0.06 | |
| Week Change: -0.33% Year-to-date Change: 10.9% | |
| LMND Links: Profile News Message Board | |
| Charts:- Daily , Weekly | |
| Add LMND to Watchlist: View: Get Complete LMND Trend Analysis ➞ | |
 | ATRI Atrion Corporation |
| Sector: Health Care | |
| SubSector: Medical Instruments & Supplies | |
| MarketCap: 1234.6 Millions | |
| Recent Price: 420.00 Smart Investing & Trading Score: 80 | |
| Day Percent Change: 6.33% Day Change: 24.99 | |
| Week Change: 6.33% Year-to-date Change: 10.9% | |
| ATRI Links: Profile News Message Board | |
| Charts:- Daily , Weekly | |
| Add ATRI to Watchlist: View: Get Complete ATRI Trend Analysis ➞ | |
 | KOD Kodiak Sciences Inc. |
| Sector: Health Care | |
| SubSector: Biotechnology | |
| MarketCap: 2132.15 Millions | |
| Recent Price: 3.37 Smart Investing & Trading Score: 17 | |
| Day Percent Change: 2.74% Day Change: 0.09 | |
| Week Change: 2.74% Year-to-date Change: 10.9% | |
| KOD Links: Profile News Message Board | |
| Charts:- Daily , Weekly | |
| Add KOD to Watchlist: View: Get Complete KOD Trend Analysis ➞ | |
 | STER Sterling Check Corp. |
| Sector: Technology | |
| SubSector: Software - Infrastructure | |
| MarketCap: 1180 Millions | |
| Recent Price: 15.44 Smart Investing & Trading Score: 78 | |
| Day Percent Change: 0.85% Day Change: 0.13 | |
| Week Change: 0.85% Year-to-date Change: 10.8% | |
| STER Links: Profile News Message Board | |
| Charts:- Daily , Weekly | |
| Add STER to Watchlist: View: Get Complete STER Trend Analysis ➞ | |
 | CHRD Chord Energy Corporation |
| Sector: Energy | |
| SubSector: Oil & Gas E&P | |
| MarketCap: 6280 Millions | |
| Recent Price: 184.34 Smart Investing & Trading Score: 61 | |
| Day Percent Change: -0.71% Day Change: -1.32 | |
| Week Change: -0.71% Year-to-date Change: 10.5% | |
| CHRD Links: Profile News Message Board | |
| Charts:- Daily , Weekly | |
| Add CHRD to Watchlist: View: Get Complete CHRD Trend Analysis ➞ | |
 | IE Ivanhoe Electric Inc. |
| Sector: Materials | |
| SubSector: Copper | |
| MarketCap: 1200 Millions | |
| Recent Price: 11.19 Smart Investing & Trading Score: 100 | |
| Day Percent Change: 4.78% Day Change: 0.51 | |
| Week Change: 4.78% Year-to-date Change: 10.4% | |
| IE Links: Profile News Message Board | |
| Charts:- Daily , Weekly | |
| Add IE to Watchlist: View: Get Complete IE Trend Analysis ➞ | |
 | KIND Nextdoor Holdings, Inc. |
| Sector: Services & Goods | |
| SubSector: Internet Content & Information | |
| MarketCap: 1170 Millions | |
| Recent Price: 2.04 Smart Investing & Trading Score: 38 | |
| Day Percent Change: 0.99% Day Change: 0.02 | |
| Week Change: 0.99% Year-to-date Change: 10.3% | |
| KIND Links: Profile News Message Board | |
| Charts:- Daily , Weekly | |
| Add KIND to Watchlist: View: Get Complete KIND Trend Analysis ➞ | |
 | CTRE CareTrust REIT, Inc. |
| Sector: Financials | |
| SubSector: REIT - Healthcare Facilities | |
| MarketCap: 1507.94 Millions | |
| Recent Price: 24.67 Smart Investing & Trading Score: 100 | |
| Day Percent Change: 1.48% Day Change: 0.36 | |
| Week Change: 1.48% Year-to-date Change: 10.2% | |
| CTRE Links: Profile News Message Board | |
| Charts:- Daily , Weekly | |
| Add CTRE to Watchlist: View: Get Complete CTRE Trend Analysis ➞ | |
 | EE Excelerate Energy, Inc. |
| Sector: Utilities | |
| SubSector: Utilities - Renewable | |
| MarketCap: 2140 Millions | |
| Recent Price: 17.15 Smart Investing & Trading Score: 95 | |
| Day Percent Change: -0.35% Day Change: -0.06 | |
| Week Change: -0.35% Year-to-date Change: 10.2% | |
| EE Links: Profile News Message Board | |
| Charts:- Daily , Weekly | |
| Add EE to Watchlist: View: Get Complete EE Trend Analysis ➞ | |
 | SXT Sensient Technologies Corporation |
| Sector: Materials | |
| SubSector: Specialty Chemicals | |
| MarketCap: 1961.37 Millions | |
| Recent Price: 72.68 Smart Investing & Trading Score: 100 | |
| Day Percent Change: 3.30% Day Change: 2.32 | |
| Week Change: 3.3% Year-to-date Change: 10.1% | |
| SXT Links: Profile News Message Board | |
| Charts:- Daily , Weekly | |
| Add SXT to Watchlist: View: Get Complete SXT Trend Analysis ➞ | |
 | CMC Commercial Metals Company |
| Sector: Materials | |
| SubSector: Steel & Iron | |
| MarketCap: 1724.78 Millions | |
| Recent Price: 54.87 Smart Investing & Trading Score: 76 | |
| Day Percent Change: 2.60% Day Change: 1.39 | |
| Week Change: 2.6% Year-to-date Change: 9.7% | |
| CMC Links: Profile News Message Board | |
| Charts:- Daily , Weekly | |
| Add CMC to Watchlist: View: Get Complete CMC Trend Analysis ➞ | |
 | LAUR Laureate Education, Inc. |
| Sector: Services & Goods | |
| SubSector: Education & Training Services | |
| MarketCap: 2258.56 Millions | |
| Recent Price: 15.00 Smart Investing & Trading Score: 100 | |
| Day Percent Change: 1.35% Day Change: 0.20 | |
| Week Change: 1.35% Year-to-date Change: 9.4% | |
| LAUR Links: Profile News Message Board | |
| Charts:- Daily , Weekly | |
| Add LAUR to Watchlist: View: Get Complete LAUR Trend Analysis ➞ | |
 | HTLF Heartland Financial USA, Inc. |
| Sector: Financials | |
| SubSector: Regional - Southwest Banks | |
| MarketCap: 1143.85 Millions | |
| Recent Price: 41.13 Smart Investing & Trading Score: 100 | |
| Day Percent Change: 15.15% Day Change: 5.41 | |
| Week Change: 15.15% Year-to-date Change: 9.4% | |
| HTLF Links: Profile News Message Board | |
| Charts:- Daily , Weekly | |
| Add HTLF to Watchlist: View: Get Complete HTLF Trend Analysis ➞ | |
 | BDC Belden Inc. |
| Sector: Industrials | |
| SubSector: Industrial Electrical Equipment | |
| MarketCap: 1490.59 Millions | |
| Recent Price: 84.44 Smart Investing & Trading Score: 68 | |
| Day Percent Change: 1.25% Day Change: 1.04 | |
| Week Change: 1.25% Year-to-date Change: 9.3% | |
| BDC Links: Profile News Message Board | |
| Charts:- Daily , Weekly | |
| Add BDC to Watchlist: View: Get Complete BDC Trend Analysis ➞ | |
 | CVI CVR Energy, Inc. |
| Sector: Energy | |
| SubSector: Oil & Gas Refining & Marketing | |
| MarketCap: 2482.14 Millions | |
| Recent Price: 33.12 Smart Investing & Trading Score: 10 | |
| Day Percent Change: -0.30% Day Change: -0.10 | |
| Week Change: -0.3% Year-to-date Change: 9.3% | |
| CVI Links: Profile News Message Board | |
| Charts:- Daily , Weekly | |
| Add CVI to Watchlist: View: Get Complete CVI Trend Analysis ➞ | |
 | EIG Employers Holdings, Inc. |
| Sector: Financials | |
| SubSector: Accident & Health Insurance | |
| MarketCap: 1202.6 Millions | |
| Recent Price: 43.06 Smart Investing & Trading Score: 53 | |
| Day Percent Change: -2.16% Day Change: -0.95 | |
| Week Change: -2.16% Year-to-date Change: 9.3% | |
| EIG Links: Profile News Message Board | |
| Charts:- Daily , Weekly | |
| Add EIG to Watchlist: View: Get Complete EIG Trend Analysis ➞ | |
 | FORM FormFactor, Inc. |
| Sector: Technology | |
| SubSector: Semiconductor - Broad Line | |
| MarketCap: 1426.42 Millions | |
| Recent Price: 45.53 Smart Investing & Trading Score: 85 | |
| Day Percent Change: 1.74% Day Change: 0.78 | |
| Week Change: 1.74% Year-to-date Change: 9.2% | |
| FORM Links: Profile News Message Board | |
| Charts:- Daily , Weekly | |
| Add FORM to Watchlist: View: Get Complete FORM Trend Analysis ➞ | |
 | MGEE MGE Energy, Inc. |
| Sector: Utilities | |
| SubSector: Diversified Utilities | |
| MarketCap: 2608.3 Millions | |
| Recent Price: 78.50 Smart Investing & Trading Score: 83 | |
| Day Percent Change: 1.16% Day Change: 0.90 | |
| Week Change: 1.16% Year-to-date Change: 8.6% | |
| MGEE Links: Profile News Message Board | |
| Charts:- Daily , Weekly | |
| Add MGEE to Watchlist: View: Get Complete MGEE Trend Analysis ➞ | |
 | LIVN LivaNova PLC |
| Sector: Health Care | |
| SubSector: Medical Appliances & Equipment | |
| MarketCap: 2060.5 Millions | |
| Recent Price: 56.17 Smart Investing & Trading Score: 93 | |
| Day Percent Change: 1.15% Day Change: 0.64 | |
| Week Change: 1.15% Year-to-date Change: 8.6% | |
| LIVN Links: Profile News Message Board | |
| Charts:- Daily , Weekly | |
| Add LIVN to Watchlist: View: Get Complete LIVN Trend Analysis ➞ | |
 | B Barnes Group Inc. |
| Sector: Industrials | |
| SubSector: Industrial Equipment & Components | |
| MarketCap: 2189.79 Millions | |
| Recent Price: 35.39 Smart Investing & Trading Score: 61 | |
| Day Percent Change: 2.67% Day Change: 0.92 | |
| Week Change: 2.67% Year-to-date Change: 8.5% | |
| B Links: Profile News Message Board | |
| Charts:- Daily , Weekly | |
| Add B to Watchlist: View: Get Complete B Trend Analysis ➞ | |
 | HGV Hilton Grand Vacations Inc. |
| Sector: Services & Goods | |
| SubSector: Resorts & Casinos | |
| MarketCap: 1333.04 Millions | |
| Recent Price: 43.50 Smart Investing & Trading Score: 51 | |
| Day Percent Change: -1.89% Day Change: -0.84 | |
| Week Change: -1.89% Year-to-date Change: 8.3% | |
| HGV Links: Profile News Message Board | |
| Charts:- Daily , Weekly | |
| Add HGV to Watchlist: View: Get Complete HGV Trend Analysis ➞ | |
| For tabular summary view of above stock list: Summary View ➞ 0 - 25 , 25 - 50 , 50 - 75 , 75 - 100 , 100 - 125 , 125 - 150 , 150 - 175 , 175 - 200 , 200 - 225 , 225 - 250 , 250 - 275 , 275 - 300 , 300 - 325 , 325 - 350 , 350 - 375 , 375 - 400 , 400 - 425 , 425 - 450 , 450 - 475 , 475 - 500 , 500 - 525 , 525 - 550 , 550 - 575 , 575 - 600 , 600 - 625 , 625 - 650 , 650 - 675 , 675 - 700 | ||
| Click To Change The Sort Order: By Market Cap or Company Size Performance: Year-to-date, Week and Day | |
| Select Chart Type: | ||
| Too many stocks? View smallcap stocks filtered by marketcap & sector |
| Marketcap: All SmallCap Stocks (default-no microcap), Large, Mid-Range, Small & MicroCap |
| Sector: Tech, Finance, Energy, Staples, Retail, Industrial, Materials, Utilities & Medical |
|
Best Stocks Today 12Stocks.com |
© 2024 12Stocks.com Terms & Conditions Privacy Contact Us
All Information Provided Only For Education And Not To Be Used For Investing or Trading. See Terms & Conditions


One More Thing ... Get Best Stocks Delivered Daily!
Never Ever Miss A Move With Our Top Ten Stocks Lists
Find Best Stocks In Any Market - Bull or Bear Market
Take A Peek At Our Top Ten Stocks Lists: Daily, Weekly, Year-to-Date & Top Trends
Find Best Stocks In Any Market - Bull or Bear Market
Take A Peek At Our Top Ten Stocks Lists: Daily, Weekly, Year-to-Date & Top Trends
Smallcap Stocks With Best Up Trends [0-bearish to 100-bullish]: Bakkt [100], Deciphera [100], Phibro Animal[100], Heartland Financial[100], PTC [100], Day One[100], Richardson Electronics[100], Fulton Financial[100], Cullinan Oncology[100], Lands [100], TransMedics Group[100]
Best Smallcap Stocks Year-to-Date:
CareMax [580.41%], Janux [421.92%], Bakkt [346.64%], Viking [305.75%], Longboard [247.46%], Alpine Immune[239.81%], Super Micro[213.22%], Avidity Biosciences[173.23%], Arcutis Bio[171.83%], Vera [167.31%], Cullinan Oncology[166.01%] Best Smallcap Stocks This Week:
Deciphera [72.56%], Phibro Animal[31.81%], Vaxxinity [31.65%], Zevia PBC[20.94%], Velo3D [19.97%], Acrivon [18.2%], Janux [18.18%], MultiPlan [15.53%], Heartland Financial[15.15%], Codexis [14.66%], Eyenovia [13.37%] Best Smallcap Stocks Daily:
Bakkt [2391.87%], Deciphera [72.56%], Phibro Animal[31.81%], Vaxxinity [31.65%], Zevia PBC[20.94%], Velo3D [19.97%], Acrivon [18.20%], Janux [18.18%], MultiPlan [15.53%], Heartland Financial[15.15%], Codexis [14.66%]