
 Login Sign Up


| |||||
 |  | ||||

| 12Stocks.com Market Intelligence |
Best SmallCap Stocks
|
| In a hurry? Small Cap Stock Lists: Performance Trends Table, Stock Charts
Sort Small Cap stocks: Daily, Weekly, Year-to-Date, Market Cap & Trends. Filter Small Cap stocks list by sector: Show all, Tech, Finance, Energy, Staples, Retail, Industrial, Materials, Utilities and HealthCare Filter Small Cap stocks list by size: All Large Medium Small and MicroCap |
| 12Stocks.com Small Cap Stocks Performances & Trends Daily | |||||||||
|
|  The overall Smart Investing & Trading Score is 88 (0-bearish to 100-bullish) which puts Small Cap index in short term bullish trend. The Smart Investing & Trading Score from previous trading session is 56 and hence an improvement of trend.
| ||||||||
Here are the Smart Investing & Trading Scores of the most requested small cap stocks at 12Stocks.com (click stock name for detailed review):
|


| 12Stocks.com: Investing in Smallcap Index with Stocks | |
|
The following table helps investors and traders sort through current performance and trends (as measured by Smart Investing & Trading Score) of various
stocks in the Smallcap Index. Quick View: Move mouse or cursor over stock symbol (ticker) to view short-term technical chart and over stock name to view long term chart. Click on  to add stock symbol to your watchlist and to add stock symbol to your watchlist and  to view watchlist. Click on any ticker or stock name for detailed market intelligence report for that stock. to view watchlist. Click on any ticker or stock name for detailed market intelligence report for that stock. |
12Stocks.com Performance of Stocks in Smallcap Index
| Ticker | Stock Name | Watchlist | Category | Recent Price | Smart Investing & Trading Score | Change % | YTD Change% |
| OM | Outset Medical |   | Health Care | 2.63 | 74 | 9.58% | -51.39% |
| TWKS | Thoughtworks Holding | | Technology | 2.36 | 42 | -1.26% | -51.44% |
| XMTR | Xometry | | Industrials | 17.66 | 29 | 0.80% | -51.92% |
| MPLN | MultiPlan | | Health Care | 0.66 | 49 | 15.53% | -53.83% |
| LNZA | LanzaTech Global | | Industrials | 2.22 | 35 | -0.22% | -55.11% |
| VERV | Verve | | Health Care | 6.26 | 22 | 1.95% | -55.14% |
| SPWR | SunPower | | Technology | 2.16 | 47 | 8.54% | -55.28% |
| HUBG | Hub Group | | Transports | 40.50 | 67 | 1.43% | -55.95% |
| MNTK | Montauk Renewables | | Utilities | 3.83 | 29 | 0.52% | -57.21% |
| ALLK | Allakos | | Health Care | 1.10 | 54 | 7.84% | -59.71% |
| AMWL | American Well | | Health Care | 0.60 | 64 | 12.92% | -59.99% |
| TTEC | TTEC | | Technology | 7.85 | 32 | 1.68% | -63.77% |
| SPCE | Virgin Galactic | | Industrials | 0.88 | 47 | -0.41% | -63.92% |
| FWRD | Forward Air | | Transports | 22.52 | 37 | 1.12% | -64.18% |
| COMM | CommScope Holding | | Technology | 0.98 | 44 | 4.51% | -65.32% |
| OPI | Office Properties | | Financials | 2.09 | 62 | 3.98% | -71.45% |
| NOVA | Sunnova Energy | | Services & Goods | 4.34 | 49 | 8.50% | -71.54% |
| MAXN | Maxeon Solar | | Technology | 2.00 | 74 | -4.31% | -72.14% |
| IRBT | iRobot | | Consumer Staples | 8.46 | 74 | 8.67% | -78.14% |
| TWOU | 2U | | Technology | 0.27 | 59 | 10.28% | -78.46% |
| WW | WW | | Services & Goods | 1.86 | 32 | 6.29% | -78.74% |
| LPSN | LivePerson | | Technology | 0.54 | 54 | 3.12% | -85.69% |
| AMLX | Amylyx | | Health Care | 1.90 | 22 | 8.57% | -86.86% |
| For chart view version of above stock list: Chart View ➞ 0 - 25 , 25 - 50 , 50 - 75 , 75 - 100 , 100 - 125 , 125 - 150 , 150 - 175 , 175 - 200 , 200 - 225 , 225 - 250 , 250 - 275 , 275 - 300 , 300 - 325 , 325 - 350 , 350 - 375 , 375 - 400 , 400 - 425 , 425 - 450 , 450 - 475 , 475 - 500 , 500 - 525 , 525 - 550 , 550 - 575 , 575 - 600 , 600 - 625 , 625 - 650 , 650 - 675 , 675 - 700 | ||
 | Click To Change The Sort Order: By Market Cap or Company Size Performance: Year-to-date, Week and Day |  |
| Too many stocks? View smallcap stocks filtered by marketcap & sector |
| Marketcap: All SmallCap Stocks (default-no microcap), Large, Mid-Range, Small |
| Smallcap Sector: Tech, Finance, Energy, Staples, Retail, Industrial, Materials, & Medical |
|
Get the most comprehensive stock market coverage daily at 12Stocks.com ➞ Best Stocks Today ➞ Best Stocks Weekly ➞ Best Stocks Year-to-Date ➞ Best Stocks Trends ➞  Best Stocks Today 12Stocks.com Best Nasdaq Stocks ➞ Best S&P 500 Stocks ➞ Best Tech Stocks ➞ Best Biotech Stocks ➞ |
| Detailed Overview of SmallCap Stocks |
| SmallCap Technical Overview, Leaders & Laggards, Top SmallCap ETF Funds & Detailed SmallCap Stocks List, Charts, Trends & More |
| Smallcap: Technical Analysis, Trends & YTD Performance | |
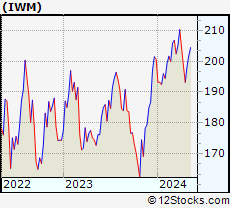
| SmallCap segment as represented by
IWM, an exchange-traded fund [ETF], holds basket of thousands of smallcap stocks from across all major sectors of the US stock market. The smallcap index (contains stocks like Riverbed & Sotheby's) is down by -0.37% and is currently underperforming the overall market by -6.93% year-to-date. Below is a quick view of technical charts and trends: | |
 IWM Weekly Chart |
|
| Long Term Trend: Very Good | |
| Medium Term Trend: Good | |
 IWM Daily Chart |
|
| Short Term Trend: Very Good | |
| Overall Trend Score: 88 | |
| YTD Performance: -0.37% | |
| **Trend Scores & Views Are Only For Educational Purposes And Not For Investing | |
| 12Stocks.com: Top Performing Small Cap Index Stocks | ||||||||||||||||||||||||||||||||||||||||||||||||
 The top performing Small Cap Index stocks year to date are
Now, more recently, over last week, the top performing Small Cap Index stocks on the move are


|
||||||||||||||||||||||||||||||||||||||||||||||||
| 12Stocks.com: Investing in Smallcap Index using Exchange Traded Funds | |
|
The following table shows list of key exchange traded funds (ETF) that
help investors track Smallcap index. The following list also includes leveraged ETF funds that track twice or thrice the daily returns of Smallcap indices. Short or inverse ETF funds move in the opposite direction to the index they track and are useful during market pullbacks or during bear markets. Quick View: Move mouse or cursor over ETF symbol (ticker) to view short-term technical chart and over ETF name to view long term chart. Click on ticker or stock name for detailed view. Click on to add stock symbol to your watchlist and to view watchlist. |
12Stocks.com List of ETFs that track Smallcap Index
| Ticker | ETF Name | Watchlist | Recent Price | Smart Investing & Trading Score | Change % | Week % | Year-to-date % |
| IWM | iShares Russell 2000 | | 199.96 | 88 | 0.79 | 0.79 | -0.37% |
| IJR | iShares Core S&P Small-Cap | | 106.41 | 93 | 0.72 | 0.72 | -1.7% |
| VTWO | Vanguard Russell 2000 ETF | | 80.78 | 88 | 0.70 | 0.7 | -0.39% |
| IWN | iShares Russell 2000 Value | | 152.05 | 93 | 0.60 | 0.6 | -2.11% |
| IWO | iShares Russell 2000 Growth | | 255.74 | 78 | 1.05 | 1.05 | 1.4% |
| IJS | iShares S&P Small-Cap 600 Value | | 97.95 | 70 | 0.78 | 0.78 | -4.97% |
| IJT | iShares S&P Small-Cap 600 Growth | | 126.96 | 88 | 0.69 | 0.69 | 1.45% |
| XSLV | PowerShares S&P SmallCap Low Volatil ETF | | 42.87 | 80 | 0.35 | 0.35 | -2.9% |
| SMLV | SPDR SSGA US Small Cap Low Volatil ETF | | 107.77 | 68 | 0.23 | 0.23 | -4.22% |
| SAA | ProShares Ultra SmallCap600 | | 23.27 | 88 | 1.00 | 1 | -6.73% |
| SBB | ProShares Short SmallCap600 | | 16.28 | 8 | -0.64 | -0.64 | 2.2% |
| SDD | ProShares UltraShort SmallCap600 | | 19.09 | 15 | -1.34 | -1.34 | 3.6% |
| 12Stocks.com: Charts, Trends, Fundamental Data and Performances of SmallCap Stocks | |
|
We now take in-depth look at all SmallCap stocks including charts, multi-period performances and overall trends (as measured by Smart Investing & Trading Score). One can sort SmallCap stocks (click link to choose) by Daily, Weekly and by Year-to-Date performances. Also, one can sort by size of the company or by market capitalization. |
| Select Your Default Chart Type: | |||||
| |||||
| Click on stock symbol or name for detailed view. Click on to add stock symbol to your watchlist and to view watchlist. Quick View: Move mouse or cursor over "Daily" to quickly view daily technical stock chart and over "Weekly" to view weekly technical stock chart. | |||||

 | OM Outset Medical, Inc. |
| Sector: Health Care | |
| SubSector: Medical Devices | |
| MarketCap: 21787 Millions | |
| Recent Price: 2.63 Smart Investing & Trading Score: 74 | |
| Day Percent Change: 9.58% Day Change: 0.23 | |
| Week Change: 9.58% Year-to-date Change: -51.4% | |
| OM Links: Profile News Message Board | |
| Charts:- Daily , Weekly | |
| Add OM to Watchlist: View: Get Complete OM Trend Analysis ➞ | |
 | TWKS Thoughtworks Holding, Inc. |
| Sector: Technology | |
| SubSector: Information Technology Services | |
| MarketCap: 2370 Millions | |
| Recent Price: 2.36 Smart Investing & Trading Score: 42 | |
| Day Percent Change: -1.26% Day Change: -0.03 | |
| Week Change: -1.26% Year-to-date Change: -51.4% | |
| TWKS Links: Profile News Message Board | |
| Charts:- Daily , Weekly | |
| Add TWKS to Watchlist: View: Get Complete TWKS Trend Analysis ➞ | |
 | XMTR Xometry, Inc. |
| Sector: Industrials | |
| SubSector: Specialty Industrial Machinery | |
| MarketCap: 1050 Millions | |
| Recent Price: 17.66 Smart Investing & Trading Score: 29 | |
| Day Percent Change: 0.80% Day Change: 0.14 | |
| Week Change: 0.8% Year-to-date Change: -51.9% | |
| XMTR Links: Profile News Message Board | |
| Charts:- Daily , Weekly | |
| Add XMTR to Watchlist: View: Get Complete XMTR Trend Analysis ➞ | |
 | MPLN MultiPlan Corporation |
| Sector: Health Care | |
| SubSector: Healthcare Plans | |
| MarketCap: 56087 Millions | |
| Recent Price: 0.66 Smart Investing & Trading Score: 49 | |
| Day Percent Change: 15.53% Day Change: 0.09 | |
| Week Change: 15.53% Year-to-date Change: -53.8% | |
| MPLN Links: Profile News Message Board | |
| Charts:- Daily , Weekly | |
| Add MPLN to Watchlist: View: Get Complete MPLN Trend Analysis ➞ | |
 | LNZA LanzaTech Global, Inc. |
| Sector: Industrials | |
| SubSector: Waste Management | |
| MarketCap: 1340 Millions | |
| Recent Price: 2.22 Smart Investing & Trading Score: 35 | |
| Day Percent Change: -0.22% Day Change: 0.00 | |
| Week Change: -0.22% Year-to-date Change: -55.1% | |
| LNZA Links: Profile News Message Board | |
| Charts:- Daily , Weekly | |
| Add LNZA to Watchlist: View: Get Complete LNZA Trend Analysis ➞ | |
 | VERV Verve Therapeutics, Inc. |
| Sector: Health Care | |
| SubSector: Biotechnology | |
| MarketCap: 1200 Millions | |
| Recent Price: 6.26 Smart Investing & Trading Score: 22 | |
| Day Percent Change: 1.95% Day Change: 0.12 | |
| Week Change: 1.95% Year-to-date Change: -55.1% | |
| VERV Links: Profile News Message Board | |
| Charts:- Daily , Weekly | |
| Add VERV to Watchlist: View: Get Complete VERV Trend Analysis ➞ | |
 | SPWR SunPower Corporation |
| Sector: Technology | |
| SubSector: Semiconductor - Specialized | |
| MarketCap: 1202.6 Millions | |
| Recent Price: 2.16 Smart Investing & Trading Score: 47 | |
| Day Percent Change: 8.54% Day Change: 0.17 | |
| Week Change: 8.54% Year-to-date Change: -55.3% | |
| SPWR Links: Profile News Message Board | |
| Charts:- Daily , Weekly | |
| Add SPWR to Watchlist: View: Get Complete SPWR Trend Analysis ➞ | |
 | HUBG Hub Group, Inc. |
| Sector: Transports | |
| SubSector: Air Delivery & Freight Services | |
| MarketCap: 1503.88 Millions | |
| Recent Price: 40.50 Smart Investing & Trading Score: 67 | |
| Day Percent Change: 1.43% Day Change: 0.57 | |
| Week Change: 1.43% Year-to-date Change: -56.0% | |
| HUBG Links: Profile News Message Board | |
| Charts:- Daily , Weekly | |
| Add HUBG to Watchlist: View: Get Complete HUBG Trend Analysis ➞ | |
 | MNTK Montauk Renewables, Inc. |
| Sector: Utilities | |
| SubSector: Utilities - Diversified | |
| MarketCap: 1020 Millions | |
| Recent Price: 3.83 Smart Investing & Trading Score: 29 | |
| Day Percent Change: 0.52% Day Change: 0.02 | |
| Week Change: 0.52% Year-to-date Change: -57.2% | |
| MNTK Links: Profile News Message Board | |
| Charts:- Daily , Weekly | |
| Add MNTK to Watchlist: View: Get Complete MNTK Trend Analysis ➞ | |
 | ALLK Allakos Inc. |
| Sector: Health Care | |
| SubSector: Biotechnology | |
| MarketCap: 3233.55 Millions | |
| Recent Price: 1.10 Smart Investing & Trading Score: 54 | |
| Day Percent Change: 7.84% Day Change: 0.08 | |
| Week Change: 7.84% Year-to-date Change: -59.7% | |
| ALLK Links: Profile News Message Board | |
| Charts:- Daily , Weekly | |
| Add ALLK to Watchlist: View: Get Complete ALLK Trend Analysis ➞ | |
 | AMWL American Well Corporation |
| Sector: Health Care | |
| SubSector: Health Information Services | |
| MarketCap: 71987 Millions | |
| Recent Price: 0.60 Smart Investing & Trading Score: 64 | |
| Day Percent Change: 12.92% Day Change: 0.07 | |
| Week Change: 12.92% Year-to-date Change: -60.0% | |
| AMWL Links: Profile News Message Board | |
| Charts:- Daily , Weekly | |
| Add AMWL to Watchlist: View: Get Complete AMWL Trend Analysis ➞ | |
 | TTEC TTEC Holdings, Inc. |
| Sector: Technology | |
| SubSector: Information Technology Services | |
| MarketCap: 1528.48 Millions | |
| Recent Price: 7.85 Smart Investing & Trading Score: 32 | |
| Day Percent Change: 1.68% Day Change: 0.13 | |
| Week Change: 1.68% Year-to-date Change: -63.8% | |
| TTEC Links: Profile News Message Board | |
| Charts:- Daily , Weekly | |
| Add TTEC to Watchlist: View: Get Complete TTEC Trend Analysis ➞ | |
 | SPCE Virgin Galactic Holdings, Inc. |
| Sector: Industrials | |
| SubSector: Conglomerates | |
| MarketCap: 2612.48 Millions | |
| Recent Price: 0.88 Smart Investing & Trading Score: 47 | |
| Day Percent Change: -0.41% Day Change: 0.00 | |
| Week Change: -0.41% Year-to-date Change: -63.9% | |
| SPCE Links: Profile News Message Board | |
| Charts:- Daily , Weekly | |
| Add SPCE to Watchlist: View: Get Complete SPCE Trend Analysis ➞ | |
 | FWRD Forward Air Corporation |
| Sector: Transports | |
| SubSector: Air Delivery & Freight Services | |
| MarketCap: 1278.88 Millions | |
| Recent Price: 22.52 Smart Investing & Trading Score: 37 | |
| Day Percent Change: 1.12% Day Change: 0.25 | |
| Week Change: 1.12% Year-to-date Change: -64.2% | |
| FWRD Links: Profile News Message Board | |
| Charts:- Daily , Weekly | |
| Add FWRD to Watchlist: View: Get Complete FWRD Trend Analysis ➞ | |
 | COMM CommScope Holding Company, Inc. |
| Sector: Technology | |
| SubSector: Communication Equipment | |
| MarketCap: 1614.29 Millions | |
| Recent Price: 0.98 Smart Investing & Trading Score: 44 | |
| Day Percent Change: 4.51% Day Change: 0.04 | |
| Week Change: 4.51% Year-to-date Change: -65.3% | |
| COMM Links: Profile News Message Board | |
| Charts:- Daily , Weekly | |
| Add COMM to Watchlist: View: Get Complete COMM Trend Analysis ➞ | |
 | OPI Office Properties Income Trust |
| Sector: Financials | |
| SubSector: REIT - Office | |
| MarketCap: 1245.66 Millions | |
| Recent Price: 2.09 Smart Investing & Trading Score: 62 | |
| Day Percent Change: 3.98% Day Change: 0.08 | |
| Week Change: 3.98% Year-to-date Change: -71.5% | |
| OPI Links: Profile News Message Board | |
| Charts:- Daily , Weekly | |
| Add OPI to Watchlist: View: Get Complete OPI Trend Analysis ➞ | |
 | NOVA Sunnova Energy International Inc. |
| Sector: Services & Goods | |
| SubSector: Management Services | |
| MarketCap: 1180.45 Millions | |
| Recent Price: 4.34 Smart Investing & Trading Score: 49 | |
| Day Percent Change: 8.50% Day Change: 0.34 | |
| Week Change: 8.5% Year-to-date Change: -71.5% | |
| NOVA Links: Profile News Message Board | |
| Charts:- Daily , Weekly | |
| Add NOVA to Watchlist: View: Get Complete NOVA Trend Analysis ➞ | |
 | MAXN Maxeon Solar Technologies, Ltd. |
| Sector: Technology | |
| SubSector: Solar | |
| MarketCap: 88787 Millions | |
| Recent Price: 2.00 Smart Investing & Trading Score: 74 | |
| Day Percent Change: -4.31% Day Change: -0.09 | |
| Week Change: -4.31% Year-to-date Change: -72.1% | |
| MAXN Links: Profile News Message Board | |
| Charts:- Daily , Weekly | |
| Add MAXN to Watchlist: View: Get Complete MAXN Trend Analysis ➞ | |
 | IRBT iRobot Corporation |
| Sector: Consumer Staples | |
| SubSector: Appliances | |
| MarketCap: 1193.38 Millions | |
| Recent Price: 8.46 Smart Investing & Trading Score: 74 | |
| Day Percent Change: 8.67% Day Change: 0.68 | |
| Week Change: 8.67% Year-to-date Change: -78.1% | |
| IRBT Links: Profile News Message Board | |
| Charts:- Daily , Weekly | |
| Add IRBT to Watchlist: View: Get Complete IRBT Trend Analysis ➞ | |
 | TWOU 2U, Inc. |
| Sector: Technology | |
| SubSector: Application Software | |
| MarketCap: 1090.12 Millions | |
| Recent Price: 0.27 Smart Investing & Trading Score: 59 | |
| Day Percent Change: 10.28% Day Change: 0.02 | |
| Week Change: 10.28% Year-to-date Change: -78.5% | |
| TWOU Links: Profile News Message Board | |
| Charts:- Daily , Weekly | |
| Add TWOU to Watchlist: View: Get Complete TWOU Trend Analysis ➞ | |
 | WW WW International, Inc. |
| Sector: Services & Goods | |
| SubSector: Personal Services | |
| MarketCap: 1186.25 Millions | |
| Recent Price: 1.86 Smart Investing & Trading Score: 32 | |
| Day Percent Change: 6.29% Day Change: 0.11 | |
| Week Change: 6.29% Year-to-date Change: -78.7% | |
| WW Links: Profile News Message Board | |
| Charts:- Daily , Weekly | |
| Add WW to Watchlist: View: Get Complete WW Trend Analysis ➞ | |
 | LPSN LivePerson, Inc. |
| Sector: Technology | |
| SubSector: Business Software & Services | |
| MarketCap: 1070.58 Millions | |
| Recent Price: 0.54 Smart Investing & Trading Score: 54 | |
| Day Percent Change: 3.12% Day Change: 0.02 | |
| Week Change: 3.12% Year-to-date Change: -85.7% | |
| LPSN Links: Profile News Message Board | |
| Charts:- Daily , Weekly | |
| Add LPSN to Watchlist: View: Get Complete LPSN Trend Analysis ➞ | |
 | AMLX Amylyx Pharmaceuticals, Inc. |
| Sector: Health Care | |
| SubSector: Biotechnology | |
| MarketCap: 1500 Millions | |
| Recent Price: 1.90 Smart Investing & Trading Score: 22 | |
| Day Percent Change: 8.57% Day Change: 0.15 | |
| Week Change: 8.57% Year-to-date Change: -86.9% | |
| AMLX Links: Profile News Message Board | |
| Charts:- Daily , Weekly | |
| Add AMLX to Watchlist: View: Get Complete AMLX Trend Analysis ➞ | |
| For tabular summary view of above stock list: Summary View ➞ 0 - 25 , 25 - 50 , 50 - 75 , 75 - 100 , 100 - 125 , 125 - 150 , 150 - 175 , 175 - 200 , 200 - 225 , 225 - 250 , 250 - 275 , 275 - 300 , 300 - 325 , 325 - 350 , 350 - 375 , 375 - 400 , 400 - 425 , 425 - 450 , 450 - 475 , 475 - 500 , 500 - 525 , 525 - 550 , 550 - 575 , 575 - 600 , 600 - 625 , 625 - 650 , 650 - 675 , 675 - 700 | ||
| Click To Change The Sort Order: By Market Cap or Company Size Performance: Year-to-date, Week and Day | |
| Select Chart Type: | ||
| Too many stocks? View smallcap stocks filtered by marketcap & sector |
| Marketcap: All SmallCap Stocks (default-no microcap), Large, Mid-Range, Small & MicroCap |
| Sector: Tech, Finance, Energy, Staples, Retail, Industrial, Materials, Utilities & Medical |
|
Best Stocks Today 12Stocks.com |
© 2024 12Stocks.com Terms & Conditions Privacy Contact Us
All Information Provided Only For Education And Not To Be Used For Investing or Trading. See Terms & Conditions


One More Thing ... Get Best Stocks Delivered Daily!
Never Ever Miss A Move With Our Top Ten Stocks Lists
Find Best Stocks In Any Market - Bull or Bear Market
Take A Peek At Our Top Ten Stocks Lists: Daily, Weekly, Year-to-Date & Top Trends
Find Best Stocks In Any Market - Bull or Bear Market
Take A Peek At Our Top Ten Stocks Lists: Daily, Weekly, Year-to-Date & Top Trends
Smallcap Stocks With Best Up Trends [0-bearish to 100-bullish]: Bakkt [100], Deciphera [100], Phibro Animal[100], Heartland Financial[100], PTC [100], Sight Sciences[100], Richardson Electronics[100], Fulton Financial[100], TPI Composites[100], Cullinan Oncology[100], Lands [100]
Best Smallcap Stocks Year-to-Date:
CareMax [580.41%], Janux [421.92%], Bakkt [346.64%], Viking [305.75%], Longboard [247.46%], Alpine Immune[239.81%], Super Micro[213.22%], Avidity Biosciences[173.23%], Arcutis Bio[171.83%], Vera [167.31%], Cullinan Oncology[166.01%] Best Smallcap Stocks This Week:
Deciphera [72.56%], Phibro Animal[31.81%], Vaxxinity [31.65%], Zevia PBC[20.94%], Velo3D [19.97%], Acrivon [18.2%], Janux [18.18%], MultiPlan [15.53%], Heartland Financial[15.15%], Codexis [14.66%], Eyenovia [13.37%] Best Smallcap Stocks Daily:
Bakkt [2391.87%], Deciphera [72.56%], Phibro Animal[31.81%], Vaxxinity [31.65%], Zevia PBC[20.94%], Velo3D [19.97%], Acrivon [18.20%], Janux [18.18%], MultiPlan [15.53%], Heartland Financial[15.15%], Codexis [14.66%]