
 Login Sign Up


| |||||
 |  | ||||

| 12Stocks.com Market Intelligence |
Best SmallCap Stocks
|
| In a hurry? Small Cap Stock Lists: Performance Trends Table, Stock Charts
Sort Small Cap stocks: Daily, Weekly, Year-to-Date, Market Cap & Trends. Filter Small Cap stocks list by sector: Show all, Tech, Finance, Energy, Staples, Retail, Industrial, Materials, Utilities and HealthCare Filter Small Cap stocks list by size: All Large Medium Small and MicroCap |
| 12Stocks.com Small Cap Stocks Performances & Trends Daily | |||||||||
|
|  The overall Smart Investing & Trading Score is 87 (0-bearish to 100-bullish) which puts Small Cap index in short term bullish trend. The Smart Investing & Trading Score from previous trading session is 82 and hence an improvement of trend.
| ||||||||
Here are the Smart Investing & Trading Scores of the most requested small cap stocks at 12Stocks.com (click stock name for detailed review):
|


| 12Stocks.com: Investing in Smallcap Index with Stocks | |
|
The following table helps investors and traders sort through current performance and trends (as measured by Smart Investing & Trading Score) of various
stocks in the Smallcap Index. Quick View: Move mouse or cursor over stock symbol (ticker) to view short-term technical chart and over stock name to view long term chart. Click on  to add stock symbol to your watchlist and to add stock symbol to your watchlist and  to view watchlist. Click on any ticker or stock name for detailed market intelligence report for that stock. to view watchlist. Click on any ticker or stock name for detailed market intelligence report for that stock. |
12Stocks.com Performance of Stocks in Smallcap Index
| Ticker | Stock Name | Watchlist | Category | Recent Price | Smart Investing & Trading Score | Change % | YTD Change% |
| CLDT | Chatham Lodging |   | Financials | 9.04 | 28 | -1.63% | -15.67% |
| CDZI | Cadiz | | Utilities | 2.36 | 44 | 0.00% | -15.71% |
| CVBF | CVB Financial | | Financials | 17.02 | 75 | -0.84% | -15.73% |
| AROW | Arrow Financial | | Financials | 23.54 | 62 | 0.00% | -15.75% |
| MRTN | Marten Transport | | Transports | 17.66 | 69 | 0.68% | -15.82% |
| WGO | Winnebago Industries | | Consumer Staples | 61.34 | 0 | -0.60% | -15.83% |
| ESSA | ESSA Bancorp | | Financials | 16.85 | 50 | 0.00% | -15.83% |
| TBBK | Bancorp | | Financials | 32.45 | 49 | 0.09% | -15.85% |
| INSM | Insmed | | Health Care | 26.07 | 64 | -0.02% | -15.86% |
| LEGH | Legacy Housing | | Industrials | 21.19 | 52 | 0.09% | -15.98% |
| RC | Ready Capital | | Financials | 8.61 | 42 | -0.81% | -16.00% |
| NVEE | NV5 Global | | Services & Goods | 93.23 | 57 | -0.61% | -16.10% |
| SGRY | Surgery Partners | | Health Care | 26.83 | 74 | -3.38% | -16.13% |
| SAFE | Safehold | | Financials | 19.63 | 74 | -0.83% | -16.13% |
| FSBC | Five Star | | Financials | 21.94 | 28 | 0.00% | -16.20% |
| HLIT | Harmonic | | Technology | 10.93 | 37 | 0.69% | -16.22% |
| FRBA | First Bank | | Financials | 12.29 | 49 | 0.00% | -16.39% |
| FARO | FARO | | Technology | 18.82 | 55 | -0.05% | -16.47% |
| IHRT | iHeartMedia | | Services & Goods | 2.23 | 64 | -1.98% | -16.48% |
| MTRN | Materion | | Materials | 108.60 | 25 | -0.75% | -16.55% |
| APPN | Appian | | Technology | 31.40 | 15 | -1.26% | -16.62% |
| IMKTA | Ingles Markets | | Services & Goods | 72.01 | 45 | -0.22% | -16.63% |
| TDS | Telephone and | | Technology | 15.28 | 31 | -0.78% | -16.73% |
| CBNK | Capital Bancorp | | Financials | 20.15 | 57 | -0.17% | -16.74% |
| BXMT | Blackstone Mortgage | | Financials | 17.70 | 28 | -1.14% | -16.76% |
| For chart view version of above stock list: Chart View ➞ 0 - 25 , 25 - 50 , 50 - 75 , 75 - 100 , 100 - 125 , 125 - 150 , 150 - 175 , 175 - 200 , 200 - 225 , 225 - 250 , 250 - 275 , 275 - 300 , 300 - 325 , 325 - 350 , 350 - 375 , 375 - 400 , 400 - 425 , 425 - 450 , 450 - 475 , 475 - 500 , 500 - 525 , 525 - 550 , 550 - 575 , 575 - 600 , 600 - 625 , 625 - 650 , 650 - 675 , 675 - 700 , 700 - 725 , 725 - 750 , 750 - 775 , 775 - 800 , 800 - 825 , 825 - 850 , 850 - 875 , 875 - 900 , 900 - 925 , 925 - 950 , 950 - 975 , 975 - 1000 , 1000 - 1025 , 1025 - 1050 , 1050 - 1075 , 1075 - 1100 , 1100 - 1125 , 1125 - 1150 , 1150 - 1175 , 1175 - 1200 , 1200 - 1225 , 1225 - 1250 , 1250 - 1275 , 1275 - 1300 , 1300 - 1325 | ||
 | Click To Change The Sort Order: By Market Cap or Company Size Performance: Year-to-date, Week and Day |  |
| Too many stocks? View smallcap stocks filtered by marketcap & sector |
| Marketcap: All SmallCap Stocks (default-no microcap), Large, Mid-Range, Small |
| Smallcap Sector: Tech, Finance, Energy, Staples, Retail, Industrial, Materials, & Medical |
|
Get the most comprehensive stock market coverage daily at 12Stocks.com ➞ Best Stocks Today ➞ Best Stocks Weekly ➞ Best Stocks Year-to-Date ➞ Best Stocks Trends ➞  Best Stocks Today 12Stocks.com Best Nasdaq Stocks ➞ Best S&P 500 Stocks ➞ Best Tech Stocks ➞ Best Biotech Stocks ➞ |
| Detailed Overview of SmallCap Stocks |
| SmallCap Technical Overview, Leaders & Laggards, Top SmallCap ETF Funds & Detailed SmallCap Stocks List, Charts, Trends & More |
| Smallcap: Technical Analysis, Trends & YTD Performance | |
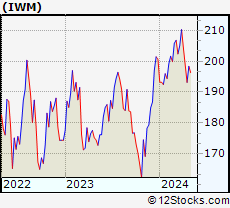
| SmallCap segment as represented by
IWM, an exchange-traded fund [ETF], holds basket of thousands of smallcap stocks from across all major sectors of the US stock market. The smallcap index (contains stocks like Riverbed & Sotheby's) is up by 1.34% and is currently underperforming the overall market by -6.56% year-to-date. Below is a quick view of technical charts and trends: | |
 IWM Weekly Chart |
|
| Long Term Trend: Very Good | |
| Medium Term Trend: Very Good | |
 IWM Daily Chart |
|
| Short Term Trend: Very Good | |
| Overall Trend Score: 87 | |
| YTD Performance: 1.34% | |
| **Trend Scores & Views Are Only For Educational Purposes And Not For Investing | |
| 12Stocks.com: Top Performing Small Cap Index Stocks | ||||||||||||||||||||||||||||||||||||||||||||||||
 The top performing Small Cap Index stocks year to date are
Now, more recently, over last week, the top performing Small Cap Index stocks on the move are


|
||||||||||||||||||||||||||||||||||||||||||||||||
| 12Stocks.com: Investing in Smallcap Index using Exchange Traded Funds | |
|
The following table shows list of key exchange traded funds (ETF) that
help investors track Smallcap index. The following list also includes leveraged ETF funds that track twice or thrice the daily returns of Smallcap indices. Short or inverse ETF funds move in the opposite direction to the index they track and are useful during market pullbacks or during bear markets. Quick View: Move mouse or cursor over ETF symbol (ticker) to view short-term technical chart and over ETF name to view long term chart. Click on ticker or stock name for detailed view. Click on to add stock symbol to your watchlist and to view watchlist. |
12Stocks.com List of ETFs that track Smallcap Index
| Ticker | ETF Name | Watchlist | Recent Price | Smart Investing & Trading Score | Change % | Week % | Year-to-date % |
| IWM | iShares Russell 2000 | | 203.39 | 87 | -0.77 | 0.74 | 1.34% |
| IJR | iShares Core S&P Small-Cap | | 107.77 | 100 | -0.79 | 0.59 | -0.45% |
| VTWO | Vanguard Russell 2000 ETF | | 82.27 | 82 | -0.69 | 0.81 | 1.44% |
| IWN | iShares Russell 2000 Value | | 154.59 | 100 | -0.67 | 0.24 | -0.48% |
| IWO | iShares Russell 2000 Growth | | 260.15 | 82 | -0.82 | 1.28 | 3.15% |
| IJS | iShares S&P Small-Cap 600 Value | | 99.06 | 69 | -0.62 | 0.34 | -3.89% |
| IJT | iShares S&P Small-Cap 600 Growth | | 128.54 | 95 | -1.00 | 0.61 | 2.72% |
| XSLV | PowerShares S&P SmallCap Low Volatil ETF | | 43.77 | 100 | -0.52 | 1.27 | -0.86% |
| SMLV | SPDR SSGA US Small Cap Low Volatil ETF | | 109.50 | 100 | -0.89 | -0.17 | -2.69% |
| SDD | ProShares UltraShort SmallCap600 | | 18.67 | 10 | 2.48 | -0.93 | 1.32% |
| SAA | ProShares Ultra SmallCap600 | | 24.21 | 95 | -0.75 | 2.62 | -2.98% |
| SBB | ProShares Short SmallCap600 | | 15.99 | 0 | 0.13 | -1.04 | 0.38% |
| 12Stocks.com: Charts, Trends, Fundamental Data and Performances of SmallCap Stocks | |
|
We now take in-depth look at all SmallCap stocks including charts, multi-period performances and overall trends (as measured by Smart Investing & Trading Score). One can sort SmallCap stocks (click link to choose) by Daily, Weekly and by Year-to-Date performances. Also, one can sort by size of the company or by market capitalization. |
| Select Your Default Chart Type: | |||||
| |||||
| Click on stock symbol or name for detailed view. Click on to add stock symbol to your watchlist and to view watchlist. Quick View: Move mouse or cursor over "Daily" to quickly view daily technical stock chart and over "Weekly" to view weekly technical stock chart. | |||||

 | CLDT Chatham Lodging Trust |
| Sector: Financials | |
| SubSector: REIT - Hotel/Motel | |
| MarketCap: 274.734 Millions | |
| Recent Price: 9.04 Smart Investing & Trading Score: 28 | |
| Day Percent Change: -1.63% Day Change: -0.15 | |
| Week Change: -1.53% Year-to-date Change: -15.7% | |
| CLDT Links: Profile News Message Board | |
| Charts:- Daily , Weekly | |
| Add CLDT to Watchlist: View: Get Complete CLDT Trend Analysis ➞ | |
 | CDZI Cadiz Inc. |
| Sector: Utilities | |
| SubSector: Water Utilities | |
| MarketCap: 265.502 Millions | |
| Recent Price: 2.36 Smart Investing & Trading Score: 44 | |
| Day Percent Change: 0.00% Day Change: 0.00 | |
| Week Change: 0.85% Year-to-date Change: -15.7% | |
| CDZI Links: Profile News Message Board | |
| Charts:- Daily , Weekly | |
| Add CDZI to Watchlist: View: Get Complete CDZI Trend Analysis ➞ | |
 | CVBF CVB Financial Corp. |
| Sector: Financials | |
| SubSector: Regional - Pacific Banks | |
| MarketCap: 2699.99 Millions | |
| Recent Price: 17.02 Smart Investing & Trading Score: 75 | |
| Day Percent Change: -0.84% Day Change: -0.14 | |
| Week Change: -1.13% Year-to-date Change: -15.7% | |
| CVBF Links: Profile News Message Board | |
| Charts:- Daily , Weekly | |
| Add CVBF to Watchlist: View: Get Complete CVBF Trend Analysis ➞ | |
 | AROW Arrow Financial Corporation |
| Sector: Financials | |
| SubSector: Regional - Northeast Banks | |
| MarketCap: 413.999 Millions | |
| Recent Price: 23.54 Smart Investing & Trading Score: 62 | |
| Day Percent Change: 0.00% Day Change: 0.00 | |
| Week Change: -0.51% Year-to-date Change: -15.8% | |
| AROW Links: Profile News Message Board | |
| Charts:- Daily , Weekly | |
| Add AROW to Watchlist: View: Get Complete AROW Trend Analysis ➞ | |
 | MRTN Marten Transport, Ltd. |
| Sector: Transports | |
| SubSector: Trucking | |
| MarketCap: 1012.15 Millions | |
| Recent Price: 17.66 Smart Investing & Trading Score: 69 | |
| Day Percent Change: 0.68% Day Change: 0.12 | |
| Week Change: 1.26% Year-to-date Change: -15.8% | |
| MRTN Links: Profile News Message Board | |
| Charts:- Daily , Weekly | |
| Add MRTN to Watchlist: View: Get Complete MRTN Trend Analysis ➞ | |
 | WGO Winnebago Industries, Inc. |
| Sector: Consumer Staples | |
| SubSector: Recreational Vehicles | |
| MarketCap: 896.559 Millions | |
| Recent Price: 61.34 Smart Investing & Trading Score: 0 | |
| Day Percent Change: -0.60% Day Change: -0.37 | |
| Week Change: -2.25% Year-to-date Change: -15.8% | |
| WGO Links: Profile News Message Board | |
| Charts:- Daily , Weekly | |
| Add WGO to Watchlist: View: Get Complete WGO Trend Analysis ➞ | |
 | ESSA ESSA Bancorp, Inc. |
| Sector: Financials | |
| SubSector: Savings & Loans | |
| MarketCap: 171.33 Millions | |
| Recent Price: 16.85 Smart Investing & Trading Score: 50 | |
| Day Percent Change: 0.00% Day Change: 0.00 | |
| Week Change: -2.03% Year-to-date Change: -15.8% | |
| ESSA Links: Profile News Message Board | |
| Charts:- Daily , Weekly | |
| Add ESSA to Watchlist: View: Get Complete ESSA Trend Analysis ➞ | |
 | TBBK The Bancorp, Inc. |
| Sector: Financials | |
| SubSector: Regional - Mid-Atlantic Banks | |
| MarketCap: 267.859 Millions | |
| Recent Price: 32.45 Smart Investing & Trading Score: 49 | |
| Day Percent Change: 0.09% Day Change: 0.03 | |
| Week Change: 1.66% Year-to-date Change: -15.9% | |
| TBBK Links: Profile News Message Board | |
| Charts:- Daily , Weekly | |
| Add TBBK to Watchlist: View: Get Complete TBBK Trend Analysis ➞ | |
 | INSM Insmed Incorporated |
| Sector: Health Care | |
| SubSector: Biotechnology | |
| MarketCap: 1452.45 Millions | |
| Recent Price: 26.07 Smart Investing & Trading Score: 64 | |
| Day Percent Change: -0.02% Day Change: 0.00 | |
| Week Change: 2.05% Year-to-date Change: -15.9% | |
| INSM Links: Profile News Message Board | |
| Charts:- Daily , Weekly | |
| Add INSM to Watchlist: View: Get Complete INSM Trend Analysis ➞ | |
 | LEGH Legacy Housing Corporation |
| Sector: Industrials | |
| SubSector: Residential Construction | |
| MarketCap: 298.006 Millions | |
| Recent Price: 21.19 Smart Investing & Trading Score: 52 | |
| Day Percent Change: 0.09% Day Change: 0.02 | |
| Week Change: -0.38% Year-to-date Change: -16.0% | |
| LEGH Links: Profile News Message Board | |
| Charts:- Daily , Weekly | |
| Add LEGH to Watchlist: View: Get Complete LEGH Trend Analysis ➞ | |
 | RC Ready Capital Corporation |
| Sector: Financials | |
| SubSector: Mortgage Investment | |
| MarketCap: 358.039 Millions | |
| Recent Price: 8.61 Smart Investing & Trading Score: 42 | |
| Day Percent Change: -0.81% Day Change: -0.07 | |
| Week Change: -0.58% Year-to-date Change: -16.0% | |
| RC Links: Profile News Message Board | |
| Charts:- Daily , Weekly | |
| Add RC to Watchlist: View: Get Complete RC Trend Analysis ➞ | |
 | NVEE NV5 Global, Inc. |
| Sector: Services & Goods | |
| SubSector: Technical Services | |
| MarketCap: 484.91 Millions | |
| Recent Price: 93.23 Smart Investing & Trading Score: 57 | |
| Day Percent Change: -0.61% Day Change: -0.58 | |
| Week Change: -0.59% Year-to-date Change: -16.1% | |
| NVEE Links: Profile News Message Board | |
| Charts:- Daily , Weekly | |
| Add NVEE to Watchlist: View: Get Complete NVEE Trend Analysis ➞ | |
 | SGRY Surgery Partners, Inc. |
| Sector: Health Care | |
| SubSector: Hospitals | |
| MarketCap: 328.446 Millions | |
| Recent Price: 26.83 Smart Investing & Trading Score: 74 | |
| Day Percent Change: -3.38% Day Change: -0.94 | |
| Week Change: 9.38% Year-to-date Change: -16.1% | |
| SGRY Links: Profile News Message Board | |
| Charts:- Daily , Weekly | |
| Add SGRY to Watchlist: View: Get Complete SGRY Trend Analysis ➞ | |
 | SAFE Safehold Inc. |
| Sector: Financials | |
| SubSector: REIT - Diversified | |
| MarketCap: 2994.63 Millions | |
| Recent Price: 19.63 Smart Investing & Trading Score: 74 | |
| Day Percent Change: -0.83% Day Change: -0.16 | |
| Week Change: 2.8% Year-to-date Change: -16.1% | |
| SAFE Links: Profile News Message Board | |
| Charts:- Daily , Weekly | |
| Add SAFE to Watchlist: View: Get Complete SAFE Trend Analysis ➞ | |
 | FSBC Five Star Bancorp |
| Sector: Financials | |
| SubSector: Banks - Regional | |
| MarketCap: 377 Millions | |
| Recent Price: 21.94 Smart Investing & Trading Score: 28 | |
| Day Percent Change: 0.00% Day Change: 0.00 | |
| Week Change: -0.86% Year-to-date Change: -16.2% | |
| FSBC Links: Profile News Message Board | |
| Charts:- Daily , Weekly | |
| Add FSBC to Watchlist: View: Get Complete FSBC Trend Analysis ➞ | |
 | HLIT Harmonic Inc. |
| Sector: Technology | |
| SubSector: Communication Equipment | |
| MarketCap: 533.539 Millions | |
| Recent Price: 10.93 Smart Investing & Trading Score: 37 | |
| Day Percent Change: 0.69% Day Change: 0.08 | |
| Week Change: -0.32% Year-to-date Change: -16.2% | |
| HLIT Links: Profile News Message Board | |
| Charts:- Daily , Weekly | |
| Add HLIT to Watchlist: View: Get Complete HLIT Trend Analysis ➞ | |
 | FRBA First Bank |
| Sector: Financials | |
| SubSector: Regional - Mid-Atlantic Banks | |
| MarketCap: 124.859 Millions | |
| Recent Price: 12.29 Smart Investing & Trading Score: 49 | |
| Day Percent Change: 0.00% Day Change: 0.00 | |
| Week Change: 0.99% Year-to-date Change: -16.4% | |
| FRBA Links: Profile News Message Board | |
| Charts:- Daily , Weekly | |
| Add FRBA to Watchlist: View: Get Complete FRBA Trend Analysis ➞ | |
 | FARO FARO Technologies, Inc. |
| Sector: Technology | |
| SubSector: Scientific & Technical Instruments | |
| MarketCap: 721.953 Millions | |
| Recent Price: 18.82 Smart Investing & Trading Score: 55 | |
| Day Percent Change: -0.05% Day Change: -0.01 | |
| Week Change: 3.63% Year-to-date Change: -16.5% | |
| FARO Links: Profile News Message Board | |
| Charts:- Daily , Weekly | |
| Add FARO to Watchlist: View: Get Complete FARO Trend Analysis ➞ | |
 | IHRT iHeartMedia, Inc. |
| Sector: Services & Goods | |
| SubSector: Broadcasting - Radio | |
| MarketCap: 694 Millions | |
| Recent Price: 2.23 Smart Investing & Trading Score: 64 | |
| Day Percent Change: -1.98% Day Change: -0.04 | |
| Week Change: -0.89% Year-to-date Change: -16.5% | |
| IHRT Links: Profile News Message Board | |
| Charts:- Daily , Weekly | |
| Add IHRT to Watchlist: View: Get Complete IHRT Trend Analysis ➞ | |
 | MTRN Materion Corporation |
| Sector: Materials | |
| SubSector: Industrial Metals & Minerals | |
| MarketCap: 703.71 Millions | |
| Recent Price: 108.60 Smart Investing & Trading Score: 25 | |
| Day Percent Change: -0.75% Day Change: -0.83 | |
| Week Change: 1.27% Year-to-date Change: -16.6% | |
| MTRN Links: Profile News Message Board | |
| Charts:- Daily , Weekly | |
| Add MTRN to Watchlist: View: Get Complete MTRN Trend Analysis ➞ | |
 | APPN Appian Corporation |
| Sector: Technology | |
| SubSector: Application Software | |
| MarketCap: 2737.92 Millions | |
| Recent Price: 31.40 Smart Investing & Trading Score: 15 | |
| Day Percent Change: -1.26% Day Change: -0.40 | |
| Week Change: -1.81% Year-to-date Change: -16.6% | |
| APPN Links: Profile News Message Board | |
| Charts:- Daily , Weekly | |
| Add APPN to Watchlist: View: Get Complete APPN Trend Analysis ➞ | |
 | IMKTA Ingles Markets, Incorporated |
| Sector: Services & Goods | |
| SubSector: Grocery Stores | |
| MarketCap: 827.075 Millions | |
| Recent Price: 72.01 Smart Investing & Trading Score: 45 | |
| Day Percent Change: -0.22% Day Change: -0.16 | |
| Week Change: -0.4% Year-to-date Change: -16.6% | |
| IMKTA Links: Profile News Message Board | |
| Charts:- Daily , Weekly | |
| Add IMKTA to Watchlist: View: Get Complete IMKTA Trend Analysis ➞ | |
 | TDS Telephone and Data Systems, Inc. |
| Sector: Technology | |
| SubSector: Wireless Communications | |
| MarketCap: 1851.87 Millions | |
| Recent Price: 15.28 Smart Investing & Trading Score: 31 | |
| Day Percent Change: -0.78% Day Change: -0.12 | |
| Week Change: 6.41% Year-to-date Change: -16.7% | |
| TDS Links: Profile News Message Board | |
| Charts:- Daily , Weekly | |
| Add TDS to Watchlist: View: Get Complete TDS Trend Analysis ➞ | |
 | CBNK Capital Bancorp, Inc. |
| Sector: Financials | |
| SubSector: Savings & Loans | |
| MarketCap: 174.93 Millions | |
| Recent Price: 20.15 Smart Investing & Trading Score: 57 | |
| Day Percent Change: -0.17% Day Change: -0.04 | |
| Week Change: 0.8% Year-to-date Change: -16.7% | |
| CBNK Links: Profile News Message Board | |
| Charts:- Daily , Weekly | |
| Add CBNK to Watchlist: View: Get Complete CBNK Trend Analysis ➞ | |
 | BXMT Blackstone Mortgage Trust, Inc. |
| Sector: Financials | |
| SubSector: Mortgage Investment | |
| MarketCap: 2820.69 Millions | |
| Recent Price: 17.70 Smart Investing & Trading Score: 28 | |
| Day Percent Change: -1.14% Day Change: -0.21 | |
| Week Change: -1.58% Year-to-date Change: -16.8% | |
| BXMT Links: Profile News Message Board | |
| Charts:- Daily , Weekly | |
| Add BXMT to Watchlist: View: Get Complete BXMT Trend Analysis ➞ | |
| For tabular summary view of above stock list: Summary View ➞ 0 - 25 , 25 - 50 , 50 - 75 , 75 - 100 , 100 - 125 , 125 - 150 , 150 - 175 , 175 - 200 , 200 - 225 , 225 - 250 , 250 - 275 , 275 - 300 , 300 - 325 , 325 - 350 , 350 - 375 , 375 - 400 , 400 - 425 , 425 - 450 , 450 - 475 , 475 - 500 , 500 - 525 , 525 - 550 , 550 - 575 , 575 - 600 , 600 - 625 , 625 - 650 , 650 - 675 , 675 - 700 , 700 - 725 , 725 - 750 , 750 - 775 , 775 - 800 , 800 - 825 , 825 - 850 , 850 - 875 , 875 - 900 , 900 - 925 , 925 - 950 , 950 - 975 , 975 - 1000 , 1000 - 1025 , 1025 - 1050 , 1050 - 1075 , 1075 - 1100 , 1100 - 1125 , 1125 - 1150 , 1150 - 1175 , 1175 - 1200 , 1200 - 1225 , 1225 - 1250 , 1250 - 1275 , 1275 - 1300 , 1300 - 1325 | ||
| Click To Change The Sort Order: By Market Cap or Company Size Performance: Year-to-date, Week and Day | |
| Select Chart Type: | ||
| Too many stocks? View smallcap stocks filtered by marketcap & sector |
| Marketcap: All SmallCap Stocks (default-no microcap), Large, Mid-Range, Small & MicroCap |
| Sector: Tech, Finance, Energy, Staples, Retail, Industrial, Materials, Utilities & Medical |
|
Best Stocks Today 12Stocks.com |
© 2024 12Stocks.com Terms & Conditions Privacy Contact Us
All Information Provided Only For Education And Not To Be Used For Investing or Trading. See Terms & Conditions


One More Thing ... Get Best Stocks Delivered Daily!
Never Ever Miss A Move With Our Top Ten Stocks Lists
Find Best Stocks In Any Market - Bull or Bear Market
Take A Peek At Our Top Ten Stocks Lists: Daily, Weekly, Year-to-Date & Top Trends
Find Best Stocks In Any Market - Bull or Bear Market
Take A Peek At Our Top Ten Stocks Lists: Daily, Weekly, Year-to-Date & Top Trends
Smallcap Stocks With Best Up Trends [0-bearish to 100-bullish]: Wolverine World[100], Orthofix Medical[100], Inogen [100], Halozyme [100], Emergent BioSolutions[100], REV Group[100], Vanda [100], Air Transport[100], Mueller Water[100], MBIA [100], Gannett Co[100]
Best Smallcap Stocks Year-to-Date:
Viking [319.59%], Super Micro[189.52%], Arcutis Bio[147.68%], Stoke [126.9%], IES [115.39%], Carvana Co[115.23%], Sweetgreen [105.35%], Y-mAbs [103.59%], Aris Water[103.34%], Tutor Perini[101.43%], EverQuote [100.37%] Best Smallcap Stocks This Week:
Perficient [52.52%], Innodata [37.95%], Great Lakes[25.86%], Trupanion [24.16%], Ambac Financial[23.04%], Sterling Construction[21.26%], Hyster-Yale Materials[20.6%], Workhorse Group[20.31%], Myriad Genetics[20.08%], Emergent BioSolutions[19.67%], Wolverine World[18.98%] Best Smallcap Stocks Daily:
Innodata [37.54%], Hyster-Yale Materials[20.15%], Myriad Genetics[18.20%], Alpha and[16.25%], Adaptive Bio[14.15%], BRP Group[13.23%], Ameresco [12.99%], Wolverine World[12.00%], Orthofix Medical[11.88%], Inogen [11.78%], Denali [11.54%]