
 Login Sign Up


| |||||
 |  | ||||

| 12Stocks.com Market Intelligence |
Best SmallCap Stocks
|
| In a hurry? Small Cap Stock Lists: Performance Trends Table, Stock Charts
Sort Small Cap stocks: Daily, Weekly, Year-to-Date, Market Cap & Trends. Filter Small Cap stocks list by sector: Show all, Tech, Finance, Energy, Staples, Retail, Industrial, Materials, Utilities and HealthCare Filter Small Cap stocks list by size: All Large Medium Small and MicroCap |
| 12Stocks.com Small Cap Stocks Performances & Trends Daily | |||||||||
|
|  The overall Smart Investing & Trading Score is 70 (0-bearish to 100-bullish) which puts Small Cap index in short term neutral to bullish trend. The Smart Investing & Trading Score from previous trading session is 87 and hence a deterioration of trend.
| ||||||||
Here are the Smart Investing & Trading Scores of the most requested small cap stocks at 12Stocks.com (click stock name for detailed review):
|


| 12Stocks.com: Investing in Smallcap Index with Stocks | |
|
The following table helps investors and traders sort through current performance and trends (as measured by Smart Investing & Trading Score) of various
stocks in the Smallcap Index. Quick View: Move mouse or cursor over stock symbol (ticker) to view short-term technical chart and over stock name to view long term chart. Click on  to add stock symbol to your watchlist and to add stock symbol to your watchlist and  to view watchlist. Click on any ticker or stock name for detailed market intelligence report for that stock. to view watchlist. Click on any ticker or stock name for detailed market intelligence report for that stock. |
12Stocks.com Performance of Stocks in Smallcap Index
| Ticker | Stock Name | Watchlist | Category | Recent Price | Smart Investing & Trading Score | Change % | YTD Change% |
| HRI | Herc |   | Transports | 148.90 | 25 | 0.68% | 0.01% |
| HBI | Hanesbrands | | Consumer Staples | 4.46 | 23 | -0.67% | 0.00% |
| AKR | Acadia Realty | | Financials | 16.98 | 41 | -0.99% | -0.06% |
| EXLS | ExlService | | Technology | 30.83 | 69 | 0.42% | -0.06% |
| SIGI | Selective Insurance | | Financials | 99.35 | 42 | -0.57% | -0.13% |
| MAC | Macerich | | Financials | 15.40 | 57 | 1.02% | -0.16% |
| NJR | New Jersey | | Utilities | 44.48 | 76 | -0.81% | -0.21% |
| WSFS | WSFS Financial | | Financials | 45.82 | 76 | 0.02% | -0.24% |
| AMWD | American Woodmark | | Consumer Staples | 92.61 | 22 | -1.97% | -0.25% |
| BATRK | Liberty Braves | | Services & Goods | 39.48 | 100 | 1.40% | -0.27% |
| WSR | Whitestone REIT | | Financials | 12.24 | 77 | -0.04% | -0.37% |
| CTO | Consolidated-Tomoka Land | | Financials | 17.27 | 78 | 0.15% | -0.38% |
| CALM | Cal-Maine Foods | | Consumer Staples | 57.16 | 43 | 0.14% | -0.40% |
| VHI | Valhi | | Materials | 15.12 | 75 | 0.00% | -0.46% |
| HSTM | HealthStream | | Technology | 26.90 | 40 | -0.15% | -0.48% |
| SGH | SMART Global | | Technology | 18.84 | 47 | 1.62% | -0.48% |
| GABC | German American | | Financials | 32.24 | 54 | 0.36% | -0.51% |
| GLUE | Monte Rosa | | Health Care | 5.60 | 37 | -1.41% | -0.53% |
| PKE | Park Aerospace | | Technology | 14.62 | 32 | 0.38% | -0.58% |
| GNW | Genworth Financial | | Financials | 6.64 | 95 | 0.45% | -0.60% |
| QCRH | QCR | | Financials | 58.02 | 88 | -0.05% | -0.63% |
| ZYXI | Zynex | | Health Care | 10.82 | 10 | -1.10% | -0.64% |
| SR | Spire | | Utilities | 61.92 | 95 | 0.18% | -0.67% |
| PLXS | Plexus | | Technology | 107.33 | 95 | 0.85% | -0.74% |
| SPSC | SPS Commerce | | Technology | 192.38 | 95 | -0.16% | -0.75% |


| Too many stocks? View smallcap stocks filtered by marketcap & sector |
| Marketcap: All SmallCap Stocks (default-no microcap), Large, Mid-Range, Small |
| Smallcap Sector: Tech, Finance, Energy, Staples, Retail, Industrial, Materials, & Medical |
|
Get the most comprehensive stock market coverage daily at 12Stocks.com ➞ Best Stocks Today ➞ Best Stocks Weekly ➞ Best Stocks Year-to-Date ➞ Best Stocks Trends ➞  Best Stocks Today 12Stocks.com Best Nasdaq Stocks ➞ Best S&P 500 Stocks ➞ Best Tech Stocks ➞ Best Biotech Stocks ➞ |
| Detailed Overview of SmallCap Stocks |
| SmallCap Technical Overview, Leaders & Laggards, Top SmallCap ETF Funds & Detailed SmallCap Stocks List, Charts, Trends & More |
| Smallcap: Technical Analysis, Trends & YTD Performance | |
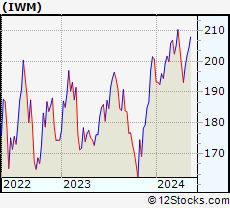
| SmallCap segment as represented by
IWM, an exchange-traded fund [ETF], holds basket of thousands of smallcap stocks from across all major sectors of the US stock market. The smallcap index (contains stocks like Riverbed & Sotheby's) is up by 1.47% and is currently underperforming the overall market by -6.62% year-to-date. Below is a quick view of technical charts and trends: | |
 IWM Weekly Chart |
|
| Long Term Trend: Deteriorating | |
| Medium Term Trend: Very Good | |
 IWM Daily Chart |
|
| Short Term Trend: Good | |
| Overall Trend Score: 70 | |
| YTD Performance: 1.47% | |
| **Trend Scores & Views Are Only For Educational Purposes And Not For Investing | |
| 12Stocks.com: Top Performing Small Cap Index Stocks | ||||||||||||||||||||||||||||||||||||||||||||||||
 The top performing Small Cap Index stocks year to date are
Now, more recently, over last week, the top performing Small Cap Index stocks on the move are


|
||||||||||||||||||||||||||||||||||||||||||||||||
| 12Stocks.com: Investing in Smallcap Index using Exchange Traded Funds | |
|
The following table shows list of key exchange traded funds (ETF) that
help investors track Smallcap index. The following list also includes leveraged ETF funds that track twice or thrice the daily returns of Smallcap indices. Short or inverse ETF funds move in the opposite direction to the index they track and are useful during market pullbacks or during bear markets. Quick View: Move mouse or cursor over ETF symbol (ticker) to view short-term technical chart and over ETF name to view long term chart. Click on ticker or stock name for detailed view. Click on to add stock symbol to your watchlist and to view watchlist. |
12Stocks.com List of ETFs that track Smallcap Index
| Ticker | ETF Name | Watchlist | Recent Price | Smart Investing & Trading Score | Change % | Week % | Year-to-date % |
| IWM | iShares Russell 2000 | | 203.67 | 70 | -0.63 | 0.88 | 1.47% |
| IJR | iShares Core S&P Small-Cap | | 107.77 | 58 | -0.79 | 0.59 | -0.45% |
| VTWO | Vanguard Russell 2000 ETF | | 82.27 | 57 | -0.69 | 0.81 | 1.44% |
| IWN | iShares Russell 2000 Value | | 154.59 | 76 | -0.67 | 0.24 | -0.48% |
| IWO | iShares Russell 2000 Growth | | 260.15 | 57 | -0.82 | 1.28 | 3.15% |
| IJS | iShares S&P Small-Cap 600 Value | | 99.06 | 40 | -0.62 | 0.34 | -3.89% |
| IJT | iShares S&P Small-Cap 600 Growth | | 128.54 | 71 | -1.00 | 0.61 | 2.72% |
| XSLV | PowerShares S&P SmallCap Low Volatil ETF | | 43.77 | 95 | -0.52 | 1.27 | -0.86% |
| SDD | ProShares UltraShort SmallCap600 | | 18.66 | 17 | 2.43 | -0.98 | 1.27% |
| SMLV | SPDR SSGA US Small Cap Low Volatil ETF | | 109.87 | 93 | -0.55 | 0.17 | -2.36% |
| SBB | ProShares Short SmallCap600 | | 16.11 | 7 | 0.91 | -0.28 | 1.16% |
| SAA | ProShares Ultra SmallCap600 | | 24.21 | 88 | -0.75 | 2.62 | -2.98% |
| 12Stocks.com: Charts, Trends, Fundamental Data and Performances of SmallCap Stocks | |
|
We now take in-depth look at all SmallCap stocks including charts, multi-period performances and overall trends (as measured by Smart Investing & Trading Score). One can sort SmallCap stocks (click link to choose) by Daily, Weekly and by Year-to-Date performances. Also, one can sort by size of the company or by market capitalization. |
| Select Your Default Chart Type: | |||||
| |||||
| Click on stock symbol or name for detailed view. Click on to add stock symbol to your watchlist and to view watchlist. Quick View: Move mouse or cursor over "Daily" to quickly view daily technical stock chart and over "Weekly" to view weekly technical stock chart. | |||||

 | HRI Herc Holdings Inc. |
| Sector: Transports | |
| SubSector: Rental & Leasing Services | |
| MarketCap: 469.344 Millions | |
| Recent Price: 148.90 Smart Investing & Trading Score: 25 | |
| Day Percent Change: 0.68% Day Change: 1.00 | |
| Week Change: 1.36% Year-to-date Change: 0.0% | |
| HRI Links: Profile News Message Board | |
| Charts:- Daily , Weekly | |
| Add HRI to Watchlist: View: Get Complete HRI Trend Analysis ➞ | |
 | HBI Hanesbrands Inc. |
| Sector: Consumer Staples | |
| SubSector: Textile - Apparel Clothing | |
| MarketCap: 3559.75 Millions | |
| Recent Price: 4.46 Smart Investing & Trading Score: 23 | |
| Day Percent Change: -0.67% Day Change: -0.03 | |
| Week Change: 0.45% Year-to-date Change: 0.0% | |
| HBI Links: Profile News Message Board | |
| Charts:- Daily , Weekly | |
| Add HBI to Watchlist: View: Get Complete HBI Trend Analysis ➞ | |
 | AKR Acadia Realty Trust |
| Sector: Financials | |
| SubSector: Property Management | |
| MarketCap: 1367.42 Millions | |
| Recent Price: 16.98 Smart Investing & Trading Score: 41 | |
| Day Percent Change: -0.99% Day Change: -0.17 | |
| Week Change: 0.35% Year-to-date Change: -0.1% | |
| AKR Links: Profile News Message Board | |
| Charts:- Daily , Weekly | |
| Add AKR to Watchlist: View: Get Complete AKR Trend Analysis ➞ | |
 | EXLS ExlService Holdings, Inc. |
| Sector: Technology | |
| SubSector: Information Technology Services | |
| MarketCap: 1781.78 Millions | |
| Recent Price: 30.83 Smart Investing & Trading Score: 69 | |
| Day Percent Change: 0.42% Day Change: 0.13 | |
| Week Change: 3.98% Year-to-date Change: -0.1% | |
| EXLS Links: Profile News Message Board | |
| Charts:- Daily , Weekly | |
| Add EXLS to Watchlist: View: Get Complete EXLS Trend Analysis ➞ | |
 | SIGI Selective Insurance Group, Inc. |
| Sector: Financials | |
| SubSector: Property & Casualty Insurance | |
| MarketCap: 3039.12 Millions | |
| Recent Price: 99.35 Smart Investing & Trading Score: 42 | |
| Day Percent Change: -0.57% Day Change: -0.57 | |
| Week Change: 3.05% Year-to-date Change: -0.1% | |
| SIGI Links: Profile News Message Board | |
| Charts:- Daily , Weekly | |
| Add SIGI to Watchlist: View: Get Complete SIGI Trend Analysis ➞ | |
 | MAC The Macerich Company |
| Sector: Financials | |
| SubSector: REIT - Retail | |
| MarketCap: 1172.54 Millions | |
| Recent Price: 15.40 Smart Investing & Trading Score: 57 | |
| Day Percent Change: 1.02% Day Change: 0.15 | |
| Week Change: 7.8% Year-to-date Change: -0.2% | |
| MAC Links: Profile News Message Board | |
| Charts:- Daily , Weekly | |
| Add MAC to Watchlist: View: Get Complete MAC Trend Analysis ➞ | |
 | NJR New Jersey Resources Corporation |
| Sector: Utilities | |
| SubSector: Gas Utilities | |
| MarketCap: 3320.27 Millions | |
| Recent Price: 44.48 Smart Investing & Trading Score: 76 | |
| Day Percent Change: -0.81% Day Change: -0.37 | |
| Week Change: -0.48% Year-to-date Change: -0.2% | |
| NJR Links: Profile News Message Board | |
| Charts:- Daily , Weekly | |
| Add NJR to Watchlist: View: Get Complete NJR Trend Analysis ➞ | |
 | WSFS WSFS Financial Corporation |
| Sector: Financials | |
| SubSector: Regional - Mid-Atlantic Banks | |
| MarketCap: 1191.29 Millions | |
| Recent Price: 45.82 Smart Investing & Trading Score: 76 | |
| Day Percent Change: 0.02% Day Change: 0.01 | |
| Week Change: -0.54% Year-to-date Change: -0.2% | |
| WSFS Links: Profile News Message Board | |
| Charts:- Daily , Weekly | |
| Add WSFS to Watchlist: View: Get Complete WSFS Trend Analysis ➞ | |
 | AMWD American Woodmark Corporation |
| Sector: Consumer Staples | |
| SubSector: Home Furnishings & Fixtures | |
| MarketCap: 958.435 Millions | |
| Recent Price: 92.61 Smart Investing & Trading Score: 22 | |
| Day Percent Change: -1.97% Day Change: -1.87 | |
| Week Change: -1.94% Year-to-date Change: -0.3% | |
| AMWD Links: Profile News Message Board | |
| Charts:- Daily , Weekly | |
| Add AMWD to Watchlist: View: Get Complete AMWD Trend Analysis ➞ | |
 | BATRK The Liberty Braves Group |
| Sector: Services & Goods | |
| SubSector: Broadcasting - TV | |
| MarketCap: 638.363 Millions | |
| Recent Price: 39.48 Smart Investing & Trading Score: 100 | |
| Day Percent Change: 1.40% Day Change: 0.55 | |
| Week Change: 1.77% Year-to-date Change: -0.3% | |
| BATRK Links: Profile News Message Board | |
| Charts:- Daily , Weekly | |
| Add BATRK to Watchlist: View: Get Complete BATRK Trend Analysis ➞ | |
 | WSR Whitestone REIT |
| Sector: Financials | |
| SubSector: REIT - Retail | |
| MarketCap: 316.114 Millions | |
| Recent Price: 12.24 Smart Investing & Trading Score: 77 | |
| Day Percent Change: -0.04% Day Change: -0.01 | |
| Week Change: 5.74% Year-to-date Change: -0.4% | |
| WSR Links: Profile News Message Board | |
| Charts:- Daily , Weekly | |
| Add WSR to Watchlist: View: Get Complete WSR Trend Analysis ➞ | |
 | CTO Consolidated-Tomoka Land Co. |
| Sector: Financials | |
| SubSector: Real Estate Development | |
| MarketCap: 205.119 Millions | |
| Recent Price: 17.27 Smart Investing & Trading Score: 78 | |
| Day Percent Change: 0.15% Day Change: 0.03 | |
| Week Change: 1.44% Year-to-date Change: -0.4% | |
| CTO Links: Profile News Message Board | |
| Charts:- Daily , Weekly | |
| Add CTO to Watchlist: View: Get Complete CTO Trend Analysis ➞ | |
 | CALM Cal-Maine Foods, Inc. |
| Sector: Consumer Staples | |
| SubSector: Food - Major Diversified | |
| MarketCap: 2177.13 Millions | |
| Recent Price: 57.16 Smart Investing & Trading Score: 43 | |
| Day Percent Change: 0.14% Day Change: 0.08 | |
| Week Change: 0.63% Year-to-date Change: -0.4% | |
| CALM Links: Profile News Message Board | |
| Charts:- Daily , Weekly | |
| Add CALM to Watchlist: View: Get Complete CALM Trend Analysis ➞ | |
 | VHI Valhi, Inc. |
| Sector: Materials | |
| SubSector: Chemicals - Major Diversified | |
| MarketCap: 394.336 Millions | |
| Recent Price: 15.12 Smart Investing & Trading Score: 75 | |
| Day Percent Change: 0.00% Day Change: 0.00 | |
| Week Change: 1.82% Year-to-date Change: -0.5% | |
| VHI Links: Profile News Message Board | |
| Charts:- Daily , Weekly | |
| Add VHI to Watchlist: View: Get Complete VHI Trend Analysis ➞ | |
 | HSTM HealthStream, Inc. |
| Sector: Technology | |
| SubSector: Healthcare Information Services | |
| MarketCap: 770.255 Millions | |
| Recent Price: 26.90 Smart Investing & Trading Score: 40 | |
| Day Percent Change: -0.15% Day Change: -0.04 | |
| Week Change: -0.48% Year-to-date Change: -0.5% | |
| HSTM Links: Profile News Message Board | |
| Charts:- Daily , Weekly | |
| Add HSTM to Watchlist: View: Get Complete HSTM Trend Analysis ➞ | |
 | SGH SMART Global Holdings, Inc. |
| Sector: Technology | |
| SubSector: Semiconductor- Memory Chips | |
| MarketCap: 657.8 Millions | |
| Recent Price: 18.84 Smart Investing & Trading Score: 47 | |
| Day Percent Change: 1.62% Day Change: 0.30 | |
| Week Change: 1.13% Year-to-date Change: -0.5% | |
| SGH Links: Profile News Message Board | |
| Charts:- Daily , Weekly | |
| Add SGH to Watchlist: View: Get Complete SGH Trend Analysis ➞ | |
 | GABC German American Bancorp, Inc. |
| Sector: Financials | |
| SubSector: Regional - Midwest Banks | |
| MarketCap: 731.47 Millions | |
| Recent Price: 32.24 Smart Investing & Trading Score: 54 | |
| Day Percent Change: 0.36% Day Change: 0.11 | |
| Week Change: 0.3% Year-to-date Change: -0.5% | |
| GABC Links: Profile News Message Board | |
| Charts:- Daily , Weekly | |
| Add GABC to Watchlist: View: Get Complete GABC Trend Analysis ➞ | |
 | GLUE Monte Rosa Therapeutics, Inc. |
| Sector: Health Care | |
| SubSector: Biotechnology | |
| MarketCap: 346 Millions | |
| Recent Price: 5.60 Smart Investing & Trading Score: 37 | |
| Day Percent Change: -1.41% Day Change: -0.08 | |
| Week Change: -3.28% Year-to-date Change: -0.5% | |
| GLUE Links: Profile News Message Board | |
| Charts:- Daily , Weekly | |
| Add GLUE to Watchlist: View: Get Complete GLUE Trend Analysis ➞ | |
 | PKE Park Aerospace Corp. |
| Sector: Technology | |
| SubSector: Semiconductor Equipment & Materials | |
| MarketCap: 229.018 Millions | |
| Recent Price: 14.62 Smart Investing & Trading Score: 32 | |
| Day Percent Change: 0.38% Day Change: 0.05 | |
| Week Change: 1.07% Year-to-date Change: -0.6% | |
| PKE Links: Profile News Message Board | |
| Charts:- Daily , Weekly | |
| Add PKE to Watchlist: View: Get Complete PKE Trend Analysis ➞ | |
 | GNW Genworth Financial, Inc. |
| Sector: Financials | |
| SubSector: Life Insurance | |
| MarketCap: 1719.76 Millions | |
| Recent Price: 6.64 Smart Investing & Trading Score: 95 | |
| Day Percent Change: 0.45% Day Change: 0.03 | |
| Week Change: 2.31% Year-to-date Change: -0.6% | |
| GNW Links: Profile News Message Board | |
| Charts:- Daily , Weekly | |
| Add GNW to Watchlist: View: Get Complete GNW Trend Analysis ➞ | |
 | QCRH QCR Holdings, Inc. |
| Sector: Financials | |
| SubSector: Regional - Southwest Banks | |
| MarketCap: 465.765 Millions | |
| Recent Price: 58.02 Smart Investing & Trading Score: 88 | |
| Day Percent Change: -0.05% Day Change: -0.03 | |
| Week Change: 1.27% Year-to-date Change: -0.6% | |
| QCRH Links: Profile News Message Board | |
| Charts:- Daily , Weekly | |
| Add QCRH to Watchlist: View: Get Complete QCRH Trend Analysis ➞ | |
 | ZYXI Zynex, Inc. |
| Sector: Health Care | |
| SubSector: Medical Appliances & Equipment | |
| MarketCap: 388.58 Millions | |
| Recent Price: 10.82 Smart Investing & Trading Score: 10 | |
| Day Percent Change: -1.10% Day Change: -0.12 | |
| Week Change: -1.64% Year-to-date Change: -0.6% | |
| ZYXI Links: Profile News Message Board | |
| Charts:- Daily , Weekly | |
| Add ZYXI to Watchlist: View: Get Complete ZYXI Trend Analysis ➞ | |
 | SR Spire Inc. |
| Sector: Utilities | |
| SubSector: Gas Utilities | |
| MarketCap: 3745.87 Millions | |
| Recent Price: 61.92 Smart Investing & Trading Score: 95 | |
| Day Percent Change: 0.18% Day Change: 0.11 | |
| Week Change: 0.99% Year-to-date Change: -0.7% | |
| SR Links: Profile News Message Board | |
| Charts:- Daily , Weekly | |
| Add SR to Watchlist: View: Get Complete SR Trend Analysis ➞ | |
 | PLXS Plexus Corp. |
| Sector: Technology | |
| SubSector: Printed Circuit Boards | |
| MarketCap: 1457.15 Millions | |
| Recent Price: 107.33 Smart Investing & Trading Score: 95 | |
| Day Percent Change: 0.85% Day Change: 0.91 | |
| Week Change: 3.13% Year-to-date Change: -0.7% | |
| PLXS Links: Profile News Message Board | |
| Charts:- Daily , Weekly | |
| Add PLXS to Watchlist: View: Get Complete PLXS Trend Analysis ➞ | |
 | SPSC SPS Commerce, Inc. |
| Sector: Technology | |
| SubSector: Application Software | |
| MarketCap: 1398.02 Millions | |
| Recent Price: 192.38 Smart Investing & Trading Score: 95 | |
| Day Percent Change: -0.16% Day Change: -0.30 | |
| Week Change: 5.47% Year-to-date Change: -0.8% | |
| SPSC Links: Profile News Message Board | |
| Charts:- Daily , Weekly | |
| Add SPSC to Watchlist: View: Get Complete SPSC Trend Analysis ➞ | |
| Too many stocks? View smallcap stocks filtered by marketcap & sector |
| Marketcap: All SmallCap Stocks (default-no microcap), Large, Mid-Range, Small & MicroCap |
| Sector: Tech, Finance, Energy, Staples, Retail, Industrial, Materials, Utilities & Medical |
|
Best Stocks Today 12Stocks.com |
© 2024 12Stocks.com Terms & Conditions Privacy Contact Us
All Information Provided Only For Education And Not To Be Used For Investing or Trading. See Terms & Conditions


One More Thing ... Get Best Stocks Delivered Daily!
Never Ever Miss A Move With Our Top Ten Stocks Lists
Find Best Stocks In Any Market - Bull or Bear Market
Take A Peek At Our Top Ten Stocks Lists: Daily, Weekly, Year-to-Date & Top Trends
Find Best Stocks In Any Market - Bull or Bear Market
Take A Peek At Our Top Ten Stocks Lists: Daily, Weekly, Year-to-Date & Top Trends
Smallcap Stocks With Best Up Trends [0-bearish to 100-bullish]: Alpha and[100], Myriad Genetics[100], Hyster-Yale Materials[100], Pacira BioSciences[100], Hannon Armstrong[100], Orthofix Medical[100], Inogen [100], Ardmore Shipping[100], Wolverine World[100], Emergent BioSolutions[100], Payoneer Global[100]
Best Smallcap Stocks Year-to-Date:
Janux [384.97%], Viking [319.59%], Bakkt [255.16%], Longboard [254.83%], Alpine Immune[239.47%], Super Micro[193.67%], Vera [189.15%], Avidity Biosciences[185.95%], Cullinan Oncology[179.94%], Arcutis Bio[146.28%], Sana [135.19%] Best Smallcap Stocks This Week:
Perficient [52.68%], DASAN Zhone[40.85%], Innodata [37.95%], Thoughtworks Holding[37.33%], Design [32.5%], Cricut [30.45%], Latham Group[30.4%], Great Lakes[30.24%], Vigil Neuroscience[29.78%], Sterling Construction[25.77%], Outset Medical[25.72%] Best Smallcap Stocks Daily:
Innodata [37.54%], Cricut [35.17%], Veritone [25.41%], Ameresco [22.19%], PowerSchool [21.21%], Alpha and[19.97%], Myriad Genetics[19.26%], Latham Group[19.06%], Hyster-Yale Materials[18.10%], Denali [15.16%], Adaptive Bio[14.15%]