
 Login Sign Up


| |||||
 |  | ||||

| 12Stocks.com Market Intelligence |
Best SmallCap Stocks
|
| In a hurry? Small Cap Stock Lists: Performance Trends Table, Stock Charts
Sort Small Cap stocks: Daily, Weekly, Year-to-Date, Market Cap & Trends. Filter Small Cap stocks list by sector: Show all, Tech, Finance, Energy, Staples, Retail, Industrial, Materials, Utilities and HealthCare Filter Small Cap stocks list by size: All Large Medium Small and MicroCap |
| 12Stocks.com Small Cap Stocks Performances & Trends Daily | |||||||||
|
|  The overall Smart Investing & Trading Score is 70 (0-bearish to 100-bullish) which puts Small Cap index in short term neutral to bullish trend. The Smart Investing & Trading Score from previous trading session is 87 and hence a deterioration of trend.
| ||||||||
Here are the Smart Investing & Trading Scores of the most requested small cap stocks at 12Stocks.com (click stock name for detailed review):
|


| 12Stocks.com: Investing in Smallcap Index with Stocks | |
|
The following table helps investors and traders sort through current performance and trends (as measured by Smart Investing & Trading Score) of various
stocks in the Smallcap Index. Quick View: Move mouse or cursor over stock symbol (ticker) to view short-term technical chart and over stock name to view long term chart. Click on  to add stock symbol to your watchlist and to add stock symbol to your watchlist and  to view watchlist. Click on any ticker or stock name for detailed market intelligence report for that stock. to view watchlist. Click on any ticker or stock name for detailed market intelligence report for that stock. |
12Stocks.com Performance of Stocks in Smallcap Index
| Ticker | Stock Name | Watchlist | Category | Recent Price | Smart Investing & Trading Score | Change % | YTD Change% |
| WTS | Watts Water |   | Industrials | 212.24 | 83 | 1.55% | 1.87% |
| CASH | Meta Financial | | Financials | 53.92 | 88 | 0.11% | 1.87% |
| FFIN | First Financial | | Financials | 30.86 | 63 | -0.71% | 1.85% |
| HRI | Herc | | Transports | 151.61 | 25 | 2.51% | 1.83% |
| OFG | OFG Bancorp | | Financials | 38.16 | 83 | 1.14% | 1.81% |
| COKE | Coca-Cola Consolidated | | Consumer Staples | 944.81 | 100 | -6.39% | 1.77% |
| SITC | SITE Centers | | Financials | 13.87 | 66 | -0.86% | 1.76% |
| NXRT | NexPoint Residential | | Financials | 35.02 | 83 | 0.57% | 1.71% |
| POR | Portland General | | Utilities | 44.06 | 90 | -0.83% | 1.66% |
| MORF | Morphic Holding | | Health Care | 29.35 | 67 | -2.62% | 1.63% |
| AMSF | Amerisafe | | Financials | 47.53 | 42 | -0.17% | 1.60% |
| OB | Outbrain | | Services & Goods | 4.45 | 88 | 4.46% | 1.60% |
| VYGR | Voyager | | Health Care | 8.57 | 88 | -2.22% | 1.60% |
| ORC | Orchid Island | | Financials | 8.56 | 37 | 0.47% | 1.54% |
| NWLI | National Western | | Financials | 490.28 | 68 | 0.15% | 1.50% |
| IOSP | Innospec | | Materials | 125.05 | 95 | 0.07% | 1.47% |
| DGII | Digi | | Technology | 26.38 | 25 | -0.83% | 1.46% |
| HOV | Hovnanian Enterprises | | Industrials | 157.70 | 78 | -1.28% | 1.34% |
| RGCO | RGC Resources | | Utilities | 20.61 | 68 | -2.92% | 1.33% |
| KAI | Kadant | | Industrials | 283.73 | 43 | 0.81% | 1.22% |
| DOLE | Dole | | Consumer Staples | 12.48 | 93 | 0.36% | 1.22% |
| TARO | Taro Pharmaceutical | | Health Care | 42.28 | 58 | -0.33% | 1.20% |
| ALTR | Altair Engineering | | Technology | 85.16 | 77 | -1.13% | 1.20% |
| CNNE | Cannae | | Financials | 19.74 | 57 | -5.05% | 1.18% |
| PDFS | PDF Solutions | | Technology | 32.50 | 67 | 0.49% | 1.12% |


| Too many stocks? View smallcap stocks filtered by marketcap & sector |
| Marketcap: All SmallCap Stocks (default-no microcap), Large, Mid-Range, Small |
| Smallcap Sector: Tech, Finance, Energy, Staples, Retail, Industrial, Materials, & Medical |
|
Get the most comprehensive stock market coverage daily at 12Stocks.com ➞ Best Stocks Today ➞ Best Stocks Weekly ➞ Best Stocks Year-to-Date ➞ Best Stocks Trends ➞  Best Stocks Today 12Stocks.com Best Nasdaq Stocks ➞ Best S&P 500 Stocks ➞ Best Tech Stocks ➞ Best Biotech Stocks ➞ |
| Detailed Overview of SmallCap Stocks |
| SmallCap Technical Overview, Leaders & Laggards, Top SmallCap ETF Funds & Detailed SmallCap Stocks List, Charts, Trends & More |
| Smallcap: Technical Analysis, Trends & YTD Performance | |
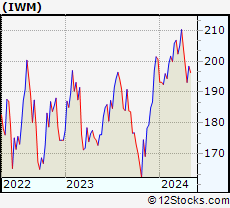
| SmallCap segment as represented by
IWM, an exchange-traded fund [ETF], holds basket of thousands of smallcap stocks from across all major sectors of the US stock market. The smallcap index (contains stocks like Riverbed & Sotheby's) is up by 1.53% and is currently underperforming the overall market by -6.51% year-to-date. Below is a quick view of technical charts and trends: | |
 IWM Weekly Chart |
|
| Long Term Trend: Deteriorating | |
| Medium Term Trend: Very Good | |
 IWM Daily Chart |
|
| Short Term Trend: Good | |
| Overall Trend Score: 70 | |
| YTD Performance: 1.53% | |
| **Trend Scores & Views Are Only For Educational Purposes And Not For Investing | |
| 12Stocks.com: Top Performing Small Cap Index Stocks | ||||||||||||||||||||||||||||||||||||||||||||||||
 The top performing Small Cap Index stocks year to date are
Now, more recently, over last week, the top performing Small Cap Index stocks on the move are


|
||||||||||||||||||||||||||||||||||||||||||||||||
| 12Stocks.com: Investing in Smallcap Index using Exchange Traded Funds | |
|
The following table shows list of key exchange traded funds (ETF) that
help investors track Smallcap index. The following list also includes leveraged ETF funds that track twice or thrice the daily returns of Smallcap indices. Short or inverse ETF funds move in the opposite direction to the index they track and are useful during market pullbacks or during bear markets. Quick View: Move mouse or cursor over ETF symbol (ticker) to view short-term technical chart and over ETF name to view long term chart. Click on ticker or stock name for detailed view. Click on to add stock symbol to your watchlist and to view watchlist. |
12Stocks.com List of ETFs that track Smallcap Index
| Ticker | ETF Name | Watchlist | Recent Price | Smart Investing & Trading Score | Change % | Week % | Year-to-date % |
| IWM | iShares Russell 2000 | | 203.78 | 70 | -0.58 | 0.93 | 1.53% |
| IJR | iShares Core S&P Small-Cap | | 108.26 | 58 | -0.33 | 1.05 | 0.01% |
| IWN | iShares Russell 2000 Value | | 155.37 | 76 | -0.17 | 0.75 | 0.03% |
| VTWO | Vanguard Russell 2000 ETF | | 82.40 | 57 | -0.53 | 0.97 | 1.6% |
| IWO | iShares Russell 2000 Growth | | 260.10 | 57 | -0.84 | 1.26 | 3.12% |
| IJS | iShares S&P Small-Cap 600 Value | | 99.80 | 40 | 0.12 | 1.09 | -3.17% |
| IJT | iShares S&P Small-Cap 600 Growth | | 129.03 | 71 | -0.62 | 0.99 | 3.11% |
| XSLV | PowerShares S&P SmallCap Low Volatil ETF | | 43.94 | 95 | -0.14 | 1.67 | -0.48% |
| SMLV | SPDR SSGA US Small Cap Low Volatil ETF | | 110.32 | 63 | -0.15 | 0.57 | -1.96% |
| SDD | ProShares UltraShort SmallCap600 | | 18.66 | 40 | 2.43 | -0.98 | 1.27% |
| SBB | ProShares Short SmallCap600 | | 16.08 | 25 | 0.69 | -0.5 | 0.94% |
| SAA | ProShares Ultra SmallCap600 | | 24.21 | 70 | -0.75 | 2.62 | -2.98% |
| 12Stocks.com: Charts, Trends, Fundamental Data and Performances of SmallCap Stocks | |
|
We now take in-depth look at all SmallCap stocks including charts, multi-period performances and overall trends (as measured by Smart Investing & Trading Score). One can sort SmallCap stocks (click link to choose) by Daily, Weekly and by Year-to-Date performances. Also, one can sort by size of the company or by market capitalization. |
| Select Your Default Chart Type: | |||||
| |||||
| Click on stock symbol or name for detailed view. Click on to add stock symbol to your watchlist and to view watchlist. Quick View: Move mouse or cursor over "Daily" to quickly view daily technical stock chart and over "Weekly" to view weekly technical stock chart. | |||||

 | WTS Watts Water Technologies, Inc. |
| Sector: Industrials | |
| SubSector: Industrial Equipment & Components | |
| MarketCap: 2903.29 Millions | |
| Recent Price: 212.24 Smart Investing & Trading Score: 83 | |
| Day Percent Change: 1.55% Day Change: 3.23 | |
| Week Change: 3.69% Year-to-date Change: 1.9% | |
| WTS Links: Profile News Message Board | |
| Charts:- Daily , Weekly | |
| Add WTS to Watchlist: View: Get Complete WTS Trend Analysis ➞ | |
 | CASH Meta Financial Group, Inc. |
| Sector: Financials | |
| SubSector: Savings & Loans | |
| MarketCap: 849.33 Millions | |
| Recent Price: 53.92 Smart Investing & Trading Score: 88 | |
| Day Percent Change: 0.11% Day Change: 0.06 | |
| Week Change: 1.87% Year-to-date Change: 1.9% | |
| CASH Links: Profile News Message Board | |
| Charts:- Daily , Weekly | |
| Add CASH to Watchlist: View: Get Complete CASH Trend Analysis ➞ | |
 | FFIN First Financial Bankshares, Inc. |
| Sector: Financials | |
| SubSector: Regional - Southwest Banks | |
| MarketCap: 3503.75 Millions | |
| Recent Price: 30.86 Smart Investing & Trading Score: 63 | |
| Day Percent Change: -0.71% Day Change: -0.22 | |
| Week Change: 0.33% Year-to-date Change: 1.9% | |
| FFIN Links: Profile News Message Board | |
| Charts:- Daily , Weekly | |
| Add FFIN to Watchlist: View: Get Complete FFIN Trend Analysis ➞ | |
 | HRI Herc Holdings Inc. |
| Sector: Transports | |
| SubSector: Rental & Leasing Services | |
| MarketCap: 469.344 Millions | |
| Recent Price: 151.61 Smart Investing & Trading Score: 25 | |
| Day Percent Change: 2.51% Day Change: 3.71 | |
| Week Change: 3.21% Year-to-date Change: 1.8% | |
| HRI Links: Profile News Message Board | |
| Charts:- Daily , Weekly | |
| Add HRI to Watchlist: View: Get Complete HRI Trend Analysis ➞ | |
 | OFG OFG Bancorp |
| Sector: Financials | |
| SubSector: Money Center Banks | |
| MarketCap: 537.599 Millions | |
| Recent Price: 38.16 Smart Investing & Trading Score: 83 | |
| Day Percent Change: 1.14% Day Change: 0.43 | |
| Week Change: 2.2% Year-to-date Change: 1.8% | |
| OFG Links: Profile News Message Board | |
| Charts:- Daily , Weekly | |
| Add OFG to Watchlist: View: Get Complete OFG Trend Analysis ➞ | |
 | COKE Coca-Cola Consolidated, Inc. |
| Sector: Consumer Staples | |
| SubSector: Beverages - Soft Drinks | |
| MarketCap: 1392.2 Millions | |
| Recent Price: 944.81 Smart Investing & Trading Score: 100 | |
| Day Percent Change: -6.39% Day Change: -64.50 | |
| Week Change: 10.71% Year-to-date Change: 1.8% | |
| COKE Links: Profile News Message Board | |
| Charts:- Daily , Weekly | |
| Add COKE to Watchlist: View: Get Complete COKE Trend Analysis ➞ | |
 | SITC SITE Centers Corp. |
| Sector: Financials | |
| SubSector: REIT - Retail | |
| MarketCap: 1449.54 Millions | |
| Recent Price: 13.87 Smart Investing & Trading Score: 66 | |
| Day Percent Change: -0.86% Day Change: -0.12 | |
| Week Change: -0.72% Year-to-date Change: 1.8% | |
| SITC Links: Profile News Message Board | |
| Charts:- Daily , Weekly | |
| Add SITC to Watchlist: View: Get Complete SITC Trend Analysis ➞ | |
 | NXRT NexPoint Residential Trust, Inc. |
| Sector: Financials | |
| SubSector: REIT - Residential | |
| MarketCap: 839.161 Millions | |
| Recent Price: 35.02 Smart Investing & Trading Score: 83 | |
| Day Percent Change: 0.57% Day Change: 0.20 | |
| Week Change: 0.49% Year-to-date Change: 1.7% | |
| NXRT Links: Profile News Message Board | |
| Charts:- Daily , Weekly | |
| Add NXRT to Watchlist: View: Get Complete NXRT Trend Analysis ➞ | |
 | POR Portland General Electric Company |
| Sector: Utilities | |
| SubSector: Electric Utilities | |
| MarketCap: 4291.84 Millions | |
| Recent Price: 44.06 Smart Investing & Trading Score: 90 | |
| Day Percent Change: -0.83% Day Change: -0.37 | |
| Week Change: 0.66% Year-to-date Change: 1.7% | |
| POR Links: Profile News Message Board | |
| Charts:- Daily , Weekly | |
| Add POR to Watchlist: View: Get Complete POR Trend Analysis ➞ | |
 | MORF Morphic Holding, Inc. |
| Sector: Health Care | |
| SubSector: Biotechnology | |
| MarketCap: 484.885 Millions | |
| Recent Price: 29.35 Smart Investing & Trading Score: 67 | |
| Day Percent Change: -2.62% Day Change: -0.79 | |
| Week Change: -1.84% Year-to-date Change: 1.6% | |
| MORF Links: Profile News Message Board | |
| Charts:- Daily , Weekly | |
| Add MORF to Watchlist: View: Get Complete MORF Trend Analysis ➞ | |
 | AMSF Amerisafe, Inc. |
| Sector: Financials | |
| SubSector: Property & Casualty Insurance | |
| MarketCap: 1159.32 Millions | |
| Recent Price: 47.53 Smart Investing & Trading Score: 42 | |
| Day Percent Change: -0.17% Day Change: -0.08 | |
| Week Change: 0.87% Year-to-date Change: 1.6% | |
| AMSF Links: Profile News Message Board | |
| Charts:- Daily , Weekly | |
| Add AMSF to Watchlist: View: Get Complete AMSF Trend Analysis ➞ | |
 | OB Outbrain Inc. |
| Sector: Services & Goods | |
| SubSector: Internet Content & Information | |
| MarketCap: 250 Millions | |
| Recent Price: 4.45 Smart Investing & Trading Score: 88 | |
| Day Percent Change: 4.46% Day Change: 0.19 | |
| Week Change: 0.91% Year-to-date Change: 1.6% | |
| OB Links: Profile News Message Board | |
| Charts:- Daily , Weekly | |
| Add OB to Watchlist: View: Get Complete OB Trend Analysis ➞ | |
 | VYGR Voyager Therapeutics, Inc. |
| Sector: Health Care | |
| SubSector: Biotechnology | |
| MarketCap: 321.085 Millions | |
| Recent Price: 8.57 Smart Investing & Trading Score: 88 | |
| Day Percent Change: -2.22% Day Change: -0.20 | |
| Week Change: -2.67% Year-to-date Change: 1.6% | |
| VYGR Links: Profile News Message Board | |
| Charts:- Daily , Weekly | |
| Add VYGR to Watchlist: View: Get Complete VYGR Trend Analysis ➞ | |
 | ORC Orchid Island Capital, Inc. |
| Sector: Financials | |
| SubSector: Mortgage Investment | |
| MarketCap: 212.339 Millions | |
| Recent Price: 8.56 Smart Investing & Trading Score: 37 | |
| Day Percent Change: 0.47% Day Change: 0.04 | |
| Week Change: 0.12% Year-to-date Change: 1.5% | |
| ORC Links: Profile News Message Board | |
| Charts:- Daily , Weekly | |
| Add ORC to Watchlist: View: Get Complete ORC Trend Analysis ➞ | |
 | NWLI National Western Life Group, Inc. |
| Sector: Financials | |
| SubSector: Life Insurance | |
| MarketCap: 529 Millions | |
| Recent Price: 490.28 Smart Investing & Trading Score: 68 | |
| Day Percent Change: 0.15% Day Change: 0.73 | |
| Week Change: 0.37% Year-to-date Change: 1.5% | |
| NWLI Links: Profile News Message Board | |
| Charts:- Daily , Weekly | |
| Add NWLI to Watchlist: View: Get Complete NWLI Trend Analysis ➞ | |
 | IOSP Innospec Inc. |
| Sector: Materials | |
| SubSector: Specialty Chemicals | |
| MarketCap: 1665.57 Millions | |
| Recent Price: 125.05 Smart Investing & Trading Score: 95 | |
| Day Percent Change: 0.07% Day Change: 0.09 | |
| Week Change: 2.74% Year-to-date Change: 1.5% | |
| IOSP Links: Profile News Message Board | |
| Charts:- Daily , Weekly | |
| Add IOSP to Watchlist: View: Get Complete IOSP Trend Analysis ➞ | |
 | DGII Digi International Inc. |
| Sector: Technology | |
| SubSector: Communication Equipment | |
| MarketCap: 257.339 Millions | |
| Recent Price: 26.38 Smart Investing & Trading Score: 25 | |
| Day Percent Change: -0.83% Day Change: -0.22 | |
| Week Change: 2.53% Year-to-date Change: 1.5% | |
| DGII Links: Profile News Message Board | |
| Charts:- Daily , Weekly | |
| Add DGII to Watchlist: View: Get Complete DGII Trend Analysis ➞ | |
 | HOV Hovnanian Enterprises, Inc. |
| Sector: Industrials | |
| SubSector: Residential Construction | |
| MarketCap: 59.9106 Millions | |
| Recent Price: 157.70 Smart Investing & Trading Score: 78 | |
| Day Percent Change: -1.28% Day Change: -2.05 | |
| Week Change: -0.08% Year-to-date Change: 1.3% | |
| HOV Links: Profile News Message Board | |
| Charts:- Daily , Weekly | |
| Add HOV to Watchlist: View: Get Complete HOV Trend Analysis ➞ | |
 | RGCO RGC Resources, Inc. |
| Sector: Utilities | |
| SubSector: Gas Utilities | |
| MarketCap: 215.277 Millions | |
| Recent Price: 20.61 Smart Investing & Trading Score: 68 | |
| Day Percent Change: -2.92% Day Change: -0.62 | |
| Week Change: -3.6% Year-to-date Change: 1.3% | |
| RGCO Links: Profile News Message Board | |
| Charts:- Daily , Weekly | |
| Add RGCO to Watchlist: View: Get Complete RGCO Trend Analysis ➞ | |
 | KAI Kadant Inc. |
| Sector: Industrials | |
| SubSector: Diversified Machinery | |
| MarketCap: 787.116 Millions | |
| Recent Price: 283.73 Smart Investing & Trading Score: 43 | |
| Day Percent Change: 0.81% Day Change: 2.29 | |
| Week Change: 4.14% Year-to-date Change: 1.2% | |
| KAI Links: Profile News Message Board | |
| Charts:- Daily , Weekly | |
| Add KAI to Watchlist: View: Get Complete KAI Trend Analysis ➞ | |
 | DOLE Dole plc |
| Sector: Consumer Staples | |
| SubSector: Farm Products | |
| MarketCap: 1300 Millions | |
| Recent Price: 12.48 Smart Investing & Trading Score: 93 | |
| Day Percent Change: 0.36% Day Change: 0.04 | |
| Week Change: 2.25% Year-to-date Change: 1.2% | |
| DOLE Links: Profile News Message Board | |
| Charts:- Daily , Weekly | |
| Add DOLE to Watchlist: View: Get Complete DOLE Trend Analysis ➞ | |
 | TARO Taro Pharmaceutical Industries Ltd. |
| Sector: Health Care | |
| SubSector: Drug Manufacturers - Other | |
| MarketCap: 2379.33 Millions | |
| Recent Price: 42.28 Smart Investing & Trading Score: 58 | |
| Day Percent Change: -0.33% Day Change: -0.14 | |
| Week Change: -0.4% Year-to-date Change: 1.2% | |
| TARO Links: Profile News Message Board | |
| Charts:- Daily , Weekly | |
| Add TARO to Watchlist: View: Get Complete TARO Trend Analysis ➞ | |
 | ALTR Altair Engineering Inc. |
| Sector: Technology | |
| SubSector: Semiconductor - Specialized | |
| MarketCap: 2072.2 Millions | |
| Recent Price: 85.16 Smart Investing & Trading Score: 77 | |
| Day Percent Change: -1.13% Day Change: -0.97 | |
| Week Change: 4.53% Year-to-date Change: 1.2% | |
| ALTR Links: Profile News Message Board | |
| Charts:- Daily , Weekly | |
| Add ALTR to Watchlist: View: Get Complete ALTR Trend Analysis ➞ | |
 | CNNE Cannae Holdings, Inc. |
| Sector: Financials | |
| SubSector: Asset Management | |
| MarketCap: 2625.53 Millions | |
| Recent Price: 19.74 Smart Investing & Trading Score: 57 | |
| Day Percent Change: -5.05% Day Change: -1.05 | |
| Week Change: -2.03% Year-to-date Change: 1.2% | |
| CNNE Links: Profile News Message Board | |
| Charts:- Daily , Weekly | |
| Add CNNE to Watchlist: View: Get Complete CNNE Trend Analysis ➞ | |
 | PDFS PDF Solutions, Inc. |
| Sector: Technology | |
| SubSector: Technical & System Software | |
| MarketCap: 345.1 Millions | |
| Recent Price: 32.50 Smart Investing & Trading Score: 67 | |
| Day Percent Change: 0.49% Day Change: 0.16 | |
| Week Change: 2.65% Year-to-date Change: 1.1% | |
| PDFS Links: Profile News Message Board | |
| Charts:- Daily , Weekly | |
| Add PDFS to Watchlist: View: Get Complete PDFS Trend Analysis ➞ | |
| Too many stocks? View smallcap stocks filtered by marketcap & sector |
| Marketcap: All SmallCap Stocks (default-no microcap), Large, Mid-Range, Small & MicroCap |
| Sector: Tech, Finance, Energy, Staples, Retail, Industrial, Materials, Utilities & Medical |
|
Best Stocks Today 12Stocks.com |
© 2024 12Stocks.com Terms & Conditions Privacy Contact Us
All Information Provided Only For Education And Not To Be Used For Investing or Trading. See Terms & Conditions


One More Thing ... Get Best Stocks Delivered Daily!
Never Ever Miss A Move With Our Top Ten Stocks Lists
Find Best Stocks In Any Market - Bull or Bear Market
Take A Peek At Our Top Ten Stocks Lists: Daily, Weekly, Year-to-Date & Top Trends
Find Best Stocks In Any Market - Bull or Bear Market
Take A Peek At Our Top Ten Stocks Lists: Daily, Weekly, Year-to-Date & Top Trends
Smallcap Stocks With Best Up Trends [0-bearish to 100-bullish]: Cricut [100], DASAN Zhone[100], Latham Group[100], Hyster-Yale Materials[100], Myriad Genetics[100], Alpha and[100], Vigil Neuroscience[100], Hannon Armstrong[100], Ardmore Shipping[100], Inogen [100], Payoneer Global[100]
Best Smallcap Stocks Year-to-Date:
CareMax [580.41%], Janux [415.82%], Viking [329.77%], Bakkt [295.29%], Longboard [255.4%], Alpine Immune[239.73%], Vera [190.25%], Super Micro[189.4%], Avidity Biosciences[188.27%], Cullinan Oncology[172%], Arcutis Bio[147.06%] Best Smallcap Stocks This Week:
DASAN Zhone[64.32%], Innodata [55.88%], Perficient [52.92%], Cricut [42.32%], Vigil Neuroscience[39.52%], Thoughtworks Holding[36.89%], Latham Group[35.9%], Great Lakes[32.18%], Bakkt [31.96%], Outset Medical[31.95%], P3 Health[27.95%] Best Smallcap Stocks Daily:
Innodata [55.42%], Cricut [47.47%], DASAN Zhone[30.11%], Latham Group[24.08%], Hyster-Yale Materials[23.55%], iRobot [21.40%], Myriad Genetics[21.13%], Ameresco [21.13%], Bakkt [20.92%], Alpha and[20.78%], Vigil Neuroscience[18.97%]