
 Login Sign Up


| |||||
 |  | ||||

| 12Stocks.com Market Intelligence |
Best SmallCap Stocks
|
| In a hurry? Small Cap Stock Lists: Performance Trends Table, Stock Charts
Sort Small Cap stocks: Daily, Weekly, Year-to-Date, Market Cap & Trends. Filter Small Cap stocks list by sector: Show all, Tech, Finance, Energy, Staples, Retail, Industrial, Materials, Utilities and HealthCare Filter Small Cap stocks list by size: All Large Medium Small and MicroCap |
| 12Stocks.com Small Cap Stocks Performances & Trends Daily | |||||||||
|
|  The overall Smart Investing & Trading Score is 70 (0-bearish to 100-bullish) which puts Small Cap index in short term neutral to bullish trend. The Smart Investing & Trading Score from previous trading session is 87 and hence a deterioration of trend.
| ||||||||
Here are the Smart Investing & Trading Scores of the most requested small cap stocks at 12Stocks.com (click stock name for detailed review):
|


| 12Stocks.com: Investing in Smallcap Index with Stocks | |
|
The following table helps investors and traders sort through current performance and trends (as measured by Smart Investing & Trading Score) of various
stocks in the Smallcap Index. Quick View: Move mouse or cursor over stock symbol (ticker) to view short-term technical chart and over stock name to view long term chart. Click on  to add stock symbol to your watchlist and to add stock symbol to your watchlist and  to view watchlist. Click on any ticker or stock name for detailed market intelligence report for that stock. to view watchlist. Click on any ticker or stock name for detailed market intelligence report for that stock. |
12Stocks.com Performance of Stocks in Smallcap Index
| Ticker | Stock Name | Watchlist | Category | Recent Price | Smart Investing & Trading Score | Change % | YTD Change% |
| ICHR | Ichor |   | Technology | 37.91 | 50 | -2.70% | 12.73% |
| LYTS | LSI Industries | | Industrials | 15.87 | 90 | 4.24% | 12.68% |
| LICY | Li-Cycle | | Industrials | 0.70 | 46 | 6.37% | 12.68% |
| GLNG | Golar LNG | | Transports | 25.90 | 95 | 1.09% | 12.66% |
| CIVI | Civitas Solutions | | Health Care | 76.97 | 29 | 1.53% | 12.56% |
| NMIH | NMI | | Financials | 33.41 | 93 | -0.76% | 12.55% |
| ATRA | Atara Bio | | Health Care | 0.58 | 10 | -4.28% | 12.48% |
| HLX | Helix Energy | | Energy | 11.56 | 100 | 1.67% | 12.45% |
| LGND | Ligand | | Health Care | 80.30 | 87 | 9.67% | 12.43% |
| CMCO | Columbus McKinnon | | Industrials | 43.87 | 88 | 1.07% | 12.42% |
| IGMS | IGM Biosciences | | Health Care | 9.34 | 37 | -5.99% | 12.39% |
| CMC | Commercial Metals | | Materials | 56.22 | 90 | -0.09% | 12.35% |
| ZUO | Zuora | | Technology | 10.56 | 95 | 0.48% | 12.34% |
| AIT | Applied Industrial | | Services & Goods | 193.87 | 90 | 0.03% | 12.26% |
| TWST | Twist Bioscience | | Health Care | 41.37 | 88 | -4.19% | 12.24% |
| VTS | Vitesse Energy | | Energy | 24.84 | 100 | 3.13% | 12.22% |
| DO | Diamond Offshore | | Energy | 14.66 | 100 | 6.93% | 12.17% |
| BASE | Couchbase | | Technology | 25.55 | 50 | -1.84% | 12.11% |
| LCTX | Lineage Cell | | Health Care | 1.22 | 93 | -3.17% | 11.93% |
| REZI | Resideo | | Services & Goods | 21.06 | 74 | 1.10% | 11.90% |
| TTMI | TTM | | Technology | 17.69 | 88 | 0.57% | 11.89% |
| CWST | Casella Waste | | Industrials | 95.60 | 100 | 0.26% | 11.87% |
| DM | Dominion Midstream | | Energy | 0.84 | 25 | 0.61% | 11.86% |
| VLGEA | Village Super | | Services & Goods | 29.33 | 100 | -0.41% | 11.82% |
| NGVC | Natural Grocers | | Services & Goods | 17.89 | 95 | -0.28% | 11.81% |


| Too many stocks? View smallcap stocks filtered by marketcap & sector |
| Marketcap: All SmallCap Stocks (default-no microcap), Large, Mid-Range, Small |
| Smallcap Sector: Tech, Finance, Energy, Staples, Retail, Industrial, Materials, & Medical |
|
Get the most comprehensive stock market coverage daily at 12Stocks.com ➞ Best Stocks Today ➞ Best Stocks Weekly ➞ Best Stocks Year-to-Date ➞ Best Stocks Trends ➞  Best Stocks Today 12Stocks.com Best Nasdaq Stocks ➞ Best S&P 500 Stocks ➞ Best Tech Stocks ➞ Best Biotech Stocks ➞ |
| Detailed Overview of SmallCap Stocks |
| SmallCap Technical Overview, Leaders & Laggards, Top SmallCap ETF Funds & Detailed SmallCap Stocks List, Charts, Trends & More |
| Smallcap: Technical Analysis, Trends & YTD Performance | |
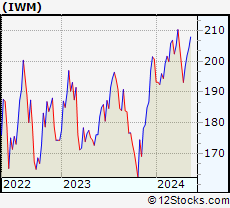
| SmallCap segment as represented by
IWM, an exchange-traded fund [ETF], holds basket of thousands of smallcap stocks from across all major sectors of the US stock market. The smallcap index (contains stocks like Riverbed & Sotheby's) is up by 1.53% and is currently underperforming the overall market by -6.51% year-to-date. Below is a quick view of technical charts and trends: | |
 IWM Weekly Chart |
|
| Long Term Trend: Deteriorating | |
| Medium Term Trend: Very Good | |
 IWM Daily Chart |
|
| Short Term Trend: Good | |
| Overall Trend Score: 70 | |
| YTD Performance: 1.53% | |
| **Trend Scores & Views Are Only For Educational Purposes And Not For Investing | |
| 12Stocks.com: Top Performing Small Cap Index Stocks | ||||||||||||||||||||||||||||||||||||||||||||||||
 The top performing Small Cap Index stocks year to date are
Now, more recently, over last week, the top performing Small Cap Index stocks on the move are


|
||||||||||||||||||||||||||||||||||||||||||||||||
| 12Stocks.com: Investing in Smallcap Index using Exchange Traded Funds | |
|
The following table shows list of key exchange traded funds (ETF) that
help investors track Smallcap index. The following list also includes leveraged ETF funds that track twice or thrice the daily returns of Smallcap indices. Short or inverse ETF funds move in the opposite direction to the index they track and are useful during market pullbacks or during bear markets. Quick View: Move mouse or cursor over ETF symbol (ticker) to view short-term technical chart and over ETF name to view long term chart. Click on ticker or stock name for detailed view. Click on to add stock symbol to your watchlist and to view watchlist. |
12Stocks.com List of ETFs that track Smallcap Index
| Ticker | ETF Name | Watchlist | Recent Price | Smart Investing & Trading Score | Change % | Week % | Year-to-date % |
| IWM | iShares Russell 2000 | | 203.78 | 70 | -0.58 | 0.93 | 1.53% |
| IJR | iShares Core S&P Small-Cap | | 108.26 | 58 | -0.33 | 1.05 | 0.01% |
| IWN | iShares Russell 2000 Value | | 155.37 | 76 | -0.17 | 0.75 | 0.03% |
| VTWO | Vanguard Russell 2000 ETF | | 82.40 | 57 | -0.53 | 0.97 | 1.6% |
| IWO | iShares Russell 2000 Growth | | 260.10 | 57 | -0.84 | 1.26 | 3.12% |
| IJS | iShares S&P Small-Cap 600 Value | | 99.80 | 40 | 0.12 | 1.09 | -3.17% |
| IJT | iShares S&P Small-Cap 600 Growth | | 129.03 | 71 | -0.62 | 0.99 | 3.11% |
| XSLV | PowerShares S&P SmallCap Low Volatil ETF | | 43.94 | 95 | -0.14 | 1.67 | -0.48% |
| SMLV | SPDR SSGA US Small Cap Low Volatil ETF | | 110.32 | 63 | -0.15 | 0.57 | -1.96% |
| SDD | ProShares UltraShort SmallCap600 | | 18.66 | 40 | 2.43 | -0.98 | 1.27% |
| SBB | ProShares Short SmallCap600 | | 16.08 | 25 | 0.69 | -0.5 | 0.94% |
| SAA | ProShares Ultra SmallCap600 | | 24.21 | 70 | -0.75 | 2.62 | -2.98% |
| 12Stocks.com: Charts, Trends, Fundamental Data and Performances of SmallCap Stocks | |
|
We now take in-depth look at all SmallCap stocks including charts, multi-period performances and overall trends (as measured by Smart Investing & Trading Score). One can sort SmallCap stocks (click link to choose) by Daily, Weekly and by Year-to-Date performances. Also, one can sort by size of the company or by market capitalization. |
| Select Your Default Chart Type: | |||||
| |||||
| Click on stock symbol or name for detailed view. Click on to add stock symbol to your watchlist and to view watchlist. Quick View: Move mouse or cursor over "Daily" to quickly view daily technical stock chart and over "Weekly" to view weekly technical stock chart. | |||||

 | ICHR Ichor Holdings, Ltd. |
| Sector: Technology | |
| SubSector: Semiconductor Equipment & Materials | |
| MarketCap: 409.018 Millions | |
| Recent Price: 37.91 Smart Investing & Trading Score: 50 | |
| Day Percent Change: -2.70% Day Change: -1.05 | |
| Week Change: -0.76% Year-to-date Change: 12.7% | |
| ICHR Links: Profile News Message Board | |
| Charts:- Daily , Weekly | |
| Add ICHR to Watchlist: View: Get Complete ICHR Trend Analysis ➞ | |
 | LYTS LSI Industries Inc. |
| Sector: Industrials | |
| SubSector: Industrial Electrical Equipment | |
| MarketCap: 85.7879 Millions | |
| Recent Price: 15.87 Smart Investing & Trading Score: 90 | |
| Day Percent Change: 4.24% Day Change: 0.64 | |
| Week Change: 3.83% Year-to-date Change: 12.7% | |
| LYTS Links: Profile News Message Board | |
| Charts:- Daily , Weekly | |
| Add LYTS to Watchlist: View: Get Complete LYTS Trend Analysis ➞ | |
 | LICY Li-Cycle Holdings Corp. |
| Sector: Industrials | |
| SubSector: Waste Management | |
| MarketCap: 959 Millions | |
| Recent Price: 0.70 Smart Investing & Trading Score: 46 | |
| Day Percent Change: 6.37% Day Change: 0.04 | |
| Week Change: 0.57% Year-to-date Change: 12.7% | |
| LICY Links: Profile News Message Board | |
| Charts:- Daily , Weekly | |
| Add LICY to Watchlist: View: Get Complete LICY Trend Analysis ➞ | |
 | GLNG Golar LNG Limited |
| Sector: Transports | |
| SubSector: Shipping | |
| MarketCap: 854.414 Millions | |
| Recent Price: 25.90 Smart Investing & Trading Score: 95 | |
| Day Percent Change: 1.09% Day Change: 0.28 | |
| Week Change: 3.93% Year-to-date Change: 12.7% | |
| GLNG Links: Profile News Message Board | |
| Charts:- Daily , Weekly | |
| Add GLNG to Watchlist: View: Get Complete GLNG Trend Analysis ➞ | |
 | CIVI Civitas Solutions, Inc. |
| Sector: Health Care | |
| SubSector: Long-Term Care Facilities | |
| MarketCap: 625.74 Millions | |
| Recent Price: 76.97 Smart Investing & Trading Score: 29 | |
| Day Percent Change: 1.53% Day Change: 1.16 | |
| Week Change: 1.95% Year-to-date Change: 12.6% | |
| CIVI Links: Profile News Message Board | |
| Charts:- Daily , Weekly | |
| Add CIVI to Watchlist: View: Get Complete CIVI Trend Analysis ➞ | |
 | NMIH NMI Holdings, Inc. |
| Sector: Financials | |
| SubSector: Surety & Title Insurance | |
| MarketCap: 816.018 Millions | |
| Recent Price: 33.41 Smart Investing & Trading Score: 93 | |
| Day Percent Change: -0.76% Day Change: -0.25 | |
| Week Change: 2.75% Year-to-date Change: 12.6% | |
| NMIH Links: Profile News Message Board | |
| Charts:- Daily , Weekly | |
| Add NMIH to Watchlist: View: Get Complete NMIH Trend Analysis ➞ | |
 | ATRA Atara Biotherapeutics, Inc. |
| Sector: Health Care | |
| SubSector: Biotechnology | |
| MarketCap: 579.185 Millions | |
| Recent Price: 0.58 Smart Investing & Trading Score: 10 | |
| Day Percent Change: -4.28% Day Change: -0.03 | |
| Week Change: -13.91% Year-to-date Change: 12.5% | |
| ATRA Links: Profile News Message Board | |
| Charts:- Daily , Weekly | |
| Add ATRA to Watchlist: View: Get Complete ATRA Trend Analysis ➞ | |
 | HLX Helix Energy Solutions Group, Inc. |
| Sector: Energy | |
| SubSector: Oil & Gas Equipment & Services | |
| MarketCap: 341.661 Millions | |
| Recent Price: 11.56 Smart Investing & Trading Score: 100 | |
| Day Percent Change: 1.67% Day Change: 0.19 | |
| Week Change: 5.57% Year-to-date Change: 12.5% | |
| HLX Links: Profile News Message Board | |
| Charts:- Daily , Weekly | |
| Add HLX to Watchlist: View: Get Complete HLX Trend Analysis ➞ | |
 | LGND Ligand Pharmaceuticals Incorporated |
| Sector: Health Care | |
| SubSector: Biotechnology | |
| MarketCap: 1344.45 Millions | |
| Recent Price: 80.30 Smart Investing & Trading Score: 87 | |
| Day Percent Change: 9.67% Day Change: 7.08 | |
| Week Change: 8.66% Year-to-date Change: 12.4% | |
| LGND Links: Profile News Message Board | |
| Charts:- Daily , Weekly | |
| Add LGND to Watchlist: View: Get Complete LGND Trend Analysis ➞ | |
 | CMCO Columbus McKinnon Corporation |
| Sector: Industrials | |
| SubSector: Farm & Construction Machinery | |
| MarketCap: 598.807 Millions | |
| Recent Price: 43.87 Smart Investing & Trading Score: 88 | |
| Day Percent Change: 1.07% Day Change: 0.47 | |
| Week Change: 3.07% Year-to-date Change: 12.4% | |
| CMCO Links: Profile News Message Board | |
| Charts:- Daily , Weekly | |
| Add CMCO to Watchlist: View: Get Complete CMCO Trend Analysis ➞ | |
 | IGMS IGM Biosciences, Inc. |
| Sector: Health Care | |
| SubSector: Biotechnology | |
| MarketCap: 2000.05 Millions | |
| Recent Price: 9.34 Smart Investing & Trading Score: 37 | |
| Day Percent Change: -5.99% Day Change: -0.60 | |
| Week Change: -7.25% Year-to-date Change: 12.4% | |
| IGMS Links: Profile News Message Board | |
| Charts:- Daily , Weekly | |
| Add IGMS to Watchlist: View: Get Complete IGMS Trend Analysis ➞ | |
 | CMC Commercial Metals Company |
| Sector: Materials | |
| SubSector: Steel & Iron | |
| MarketCap: 1724.78 Millions | |
| Recent Price: 56.22 Smart Investing & Trading Score: 90 | |
| Day Percent Change: -0.09% Day Change: -0.05 | |
| Week Change: 0.57% Year-to-date Change: 12.4% | |
| CMC Links: Profile News Message Board | |
| Charts:- Daily , Weekly | |
| Add CMC to Watchlist: View: Get Complete CMC Trend Analysis ➞ | |
 | ZUO Zuora, Inc. |
| Sector: Technology | |
| SubSector: Application Software | |
| MarketCap: 1063.22 Millions | |
| Recent Price: 10.56 Smart Investing & Trading Score: 95 | |
| Day Percent Change: 0.48% Day Change: 0.05 | |
| Week Change: 4.76% Year-to-date Change: 12.3% | |
| ZUO Links: Profile News Message Board | |
| Charts:- Daily , Weekly | |
| Add ZUO to Watchlist: View: Get Complete ZUO Trend Analysis ➞ | |
 | AIT Applied Industrial Technologies, Inc. |
| Sector: Services & Goods | |
| SubSector: Industrial Equipment Wholesale | |
| MarketCap: 1531.58 Millions | |
| Recent Price: 193.87 Smart Investing & Trading Score: 90 | |
| Day Percent Change: 0.03% Day Change: 0.05 | |
| Week Change: 4.24% Year-to-date Change: 12.3% | |
| AIT Links: Profile News Message Board | |
| Charts:- Daily , Weekly | |
| Add AIT to Watchlist: View: Get Complete AIT Trend Analysis ➞ | |
 | TWST Twist Bioscience Corporation |
| Sector: Health Care | |
| SubSector: Medical Laboratories & Research | |
| MarketCap: 1065 Millions | |
| Recent Price: 41.37 Smart Investing & Trading Score: 88 | |
| Day Percent Change: -4.19% Day Change: -1.81 | |
| Week Change: 0.39% Year-to-date Change: 12.2% | |
| TWST Links: Profile News Message Board | |
| Charts:- Daily , Weekly | |
| Add TWST to Watchlist: View: Get Complete TWST Trend Analysis ➞ | |
 | VTS Vitesse Energy, Inc. |
| Sector: Energy | |
| SubSector: Oil & Gas E&P | |
| MarketCap: 639 Millions | |
| Recent Price: 24.84 Smart Investing & Trading Score: 100 | |
| Day Percent Change: 3.13% Day Change: 0.75 | |
| Week Change: 11.96% Year-to-date Change: 12.2% | |
| VTS Links: Profile News Message Board | |
| Charts:- Daily , Weekly | |
| Add VTS to Watchlist: View: Get Complete VTS Trend Analysis ➞ | |
 | DO Diamond Offshore Drilling, Inc. |
| Sector: Energy | |
| SubSector: Oil & Gas Drilling | |
| MarketCap: 1340 Millions | |
| Recent Price: 14.66 Smart Investing & Trading Score: 100 | |
| Day Percent Change: 6.93% Day Change: 0.95 | |
| Week Change: 13.47% Year-to-date Change: 12.2% | |
| DO Links: Profile News Message Board | |
| Charts:- Daily , Weekly | |
| Add DO to Watchlist: View: Get Complete DO Trend Analysis ➞ | |
 | BASE Couchbase, Inc. |
| Sector: Technology | |
| SubSector: Software - Infrastructure | |
| MarketCap: 724 Millions | |
| Recent Price: 25.55 Smart Investing & Trading Score: 50 | |
| Day Percent Change: -1.84% Day Change: -0.48 | |
| Week Change: -2.78% Year-to-date Change: 12.1% | |
| BASE Links: Profile News Message Board | |
| Charts:- Daily , Weekly | |
| Add BASE to Watchlist: View: Get Complete BASE Trend Analysis ➞ | |
 | LCTX Lineage Cell Therapeutics, Inc. |
| Sector: Health Care | |
| SubSector: Biotechnology | |
| MarketCap: 141.285 Millions | |
| Recent Price: 1.22 Smart Investing & Trading Score: 93 | |
| Day Percent Change: -3.17% Day Change: -0.04 | |
| Week Change: 15.09% Year-to-date Change: 11.9% | |
| LCTX Links: Profile News Message Board | |
| Charts:- Daily , Weekly | |
| Add LCTX to Watchlist: View: Get Complete LCTX Trend Analysis ➞ | |
 | REZI Resideo Technologies, Inc. |
| Sector: Services & Goods | |
| SubSector: Security & Protection Services | |
| MarketCap: 712.603 Millions | |
| Recent Price: 21.06 Smart Investing & Trading Score: 74 | |
| Day Percent Change: 1.10% Day Change: 0.23 | |
| Week Change: 2.78% Year-to-date Change: 11.9% | |
| REZI Links: Profile News Message Board | |
| Charts:- Daily , Weekly | |
| Add REZI to Watchlist: View: Get Complete REZI Trend Analysis ➞ | |
 | TTMI TTM Technologies, Inc. |
| Sector: Technology | |
| SubSector: Printed Circuit Boards | |
| MarketCap: 1028.35 Millions | |
| Recent Price: 17.69 Smart Investing & Trading Score: 88 | |
| Day Percent Change: 0.57% Day Change: 0.10 | |
| Week Change: 2.2% Year-to-date Change: 11.9% | |
| TTMI Links: Profile News Message Board | |
| Charts:- Daily , Weekly | |
| Add TTMI to Watchlist: View: Get Complete TTMI Trend Analysis ➞ | |
 | CWST Casella Waste Systems, Inc. |
| Sector: Industrials | |
| SubSector: Waste Management | |
| MarketCap: 2093.38 Millions | |
| Recent Price: 95.60 Smart Investing & Trading Score: 100 | |
| Day Percent Change: 0.26% Day Change: 0.25 | |
| Week Change: 4.34% Year-to-date Change: 11.9% | |
| CWST Links: Profile News Message Board | |
| Charts:- Daily , Weekly | |
| Add CWST to Watchlist: View: Get Complete CWST Trend Analysis ➞ | |
 | DM Dominion Midstream Partners, LP |
| Sector: Energy | |
| SubSector: Oil & Gas Pipelines | |
| MarketCap: 3017.01 Millions | |
| Recent Price: 0.84 Smart Investing & Trading Score: 25 | |
| Day Percent Change: 0.61% Day Change: 0.01 | |
| Week Change: -1.77% Year-to-date Change: 11.9% | |
| DM Links: Profile News Message Board | |
| Charts:- Daily , Weekly | |
| Add DM to Watchlist: View: Get Complete DM Trend Analysis ➞ | |
 | VLGEA Village Super Market, Inc. |
| Sector: Services & Goods | |
| SubSector: Grocery Stores | |
| MarketCap: 222.375 Millions | |
| Recent Price: 29.33 Smart Investing & Trading Score: 100 | |
| Day Percent Change: -0.41% Day Change: -0.12 | |
| Week Change: 2.02% Year-to-date Change: 11.8% | |
| VLGEA Links: Profile News Message Board | |
| Charts:- Daily , Weekly | |
| Add VLGEA to Watchlist: View: Get Complete VLGEA Trend Analysis ➞ | |
 | NGVC Natural Grocers by Vitamin Cottage, Inc. |
| Sector: Services & Goods | |
| SubSector: Grocery Stores | |
| MarketCap: 185.475 Millions | |
| Recent Price: 17.89 Smart Investing & Trading Score: 95 | |
| Day Percent Change: -0.28% Day Change: -0.05 | |
| Week Change: 2.93% Year-to-date Change: 11.8% | |
| NGVC Links: Profile News Message Board | |
| Charts:- Daily , Weekly | |
| Add NGVC to Watchlist: View: Get Complete NGVC Trend Analysis ➞ | |
| Too many stocks? View smallcap stocks filtered by marketcap & sector |
| Marketcap: All SmallCap Stocks (default-no microcap), Large, Mid-Range, Small & MicroCap |
| Sector: Tech, Finance, Energy, Staples, Retail, Industrial, Materials, Utilities & Medical |
|
Best Stocks Today 12Stocks.com |
© 2024 12Stocks.com Terms & Conditions Privacy Contact Us
All Information Provided Only For Education And Not To Be Used For Investing or Trading. See Terms & Conditions


One More Thing ... Get Best Stocks Delivered Daily!
Never Ever Miss A Move With Our Top Ten Stocks Lists
Find Best Stocks In Any Market - Bull or Bear Market
Take A Peek At Our Top Ten Stocks Lists: Daily, Weekly, Year-to-Date & Top Trends
Find Best Stocks In Any Market - Bull or Bear Market
Take A Peek At Our Top Ten Stocks Lists: Daily, Weekly, Year-to-Date & Top Trends
Smallcap Stocks With Best Up Trends [0-bearish to 100-bullish]: Cricut [100], DASAN Zhone[100], Latham Group[100], Hyster-Yale Materials[100], Myriad Genetics[100], Alpha and[100], Vigil Neuroscience[100], Hannon Armstrong[100], Ardmore Shipping[100], Inogen [100], Payoneer Global[100]
Best Smallcap Stocks Year-to-Date:
CareMax [580.41%], Janux [415.82%], Viking [329.77%], Bakkt [295.29%], Longboard [255.4%], Alpine Immune[239.73%], Vera [190.25%], Super Micro[189.4%], Avidity Biosciences[188.27%], Cullinan Oncology[172%], Arcutis Bio[147.06%] Best Smallcap Stocks This Week:
DASAN Zhone[64.32%], Innodata [55.88%], Perficient [52.92%], Cricut [42.32%], Vigil Neuroscience[39.52%], Thoughtworks Holding[36.89%], Latham Group[35.9%], Great Lakes[32.18%], Bakkt [31.96%], Outset Medical[31.95%], P3 Health[27.95%] Best Smallcap Stocks Daily:
Innodata [55.42%], Cricut [47.47%], DASAN Zhone[30.11%], Latham Group[24.08%], Hyster-Yale Materials[23.55%], iRobot [21.40%], Myriad Genetics[21.13%], Ameresco [21.13%], Bakkt [20.92%], Alpha and[20.78%], Vigil Neuroscience[18.97%]