
 Login Sign Up


| |||||
 |  | ||||

| 12Stocks.com Market Intelligence |
Best SmallCap Stocks
|
| In a hurry? Small Cap Stock Lists: Performance Trends Table, Stock Charts
Sort Small Cap stocks: Daily, Weekly, Year-to-Date, Market Cap & Trends. Filter Small Cap stocks list by sector: Show all, Tech, Finance, Energy, Staples, Retail, Industrial, Materials, Utilities and HealthCare Filter Small Cap stocks list by size: All Large Medium Small and MicroCap |
| 12Stocks.com Small Cap Stocks Performances & Trends Daily | |||||||||
|
|  The overall Smart Investing & Trading Score is 70 (0-bearish to 100-bullish) which puts Small Cap index in short term neutral to bullish trend. The Smart Investing & Trading Score from previous trading session is 87 and hence a deterioration of trend.
| ||||||||
Here are the Smart Investing & Trading Scores of the most requested small cap stocks at 12Stocks.com (click stock name for detailed review):
|


| 12Stocks.com: Investing in Smallcap Index with Stocks | |
|
The following table helps investors and traders sort through current performance and trends (as measured by Smart Investing & Trading Score) of various
stocks in the Smallcap Index. Quick View: Move mouse or cursor over stock symbol (ticker) to view short-term technical chart and over stock name to view long term chart. Click on  to add stock symbol to your watchlist and to add stock symbol to your watchlist and  to view watchlist. Click on any ticker or stock name for detailed market intelligence report for that stock. to view watchlist. Click on any ticker or stock name for detailed market intelligence report for that stock. |
12Stocks.com Performance of Stocks in Smallcap Index
| Ticker | Stock Name | Watchlist | Category | Recent Price | Smart Investing & Trading Score | Change % | YTD Change% |
| SWX | Southwest Gas |   | Utilities | 75.79 | 66 | -0.66% | 19.64% |
| GBX | Greenbrier | | Transports | 52.82 | 50 | 2.27% | 19.56% |
| TSQ | Townsquare Media | | Services & Goods | 12.62 | 83 | -0.08% | 19.51% |
| KODK | Eastman Kodak | | Technology | 4.66 | 40 | 1.30% | 19.49% |
| KAR | KAR Auction | | Services & Goods | 17.68 | 66 | -1.12% | 19.38% |
| RSVR | Reservoir Media | | Services & Goods | 8.50 | 46 | -0.82% | 19.38% |
| CSWI | CSW Industrials | | Industrials | 247.54 | 95 | -1.12% | 19.35% |
| GFF | Griffon | | Industrials | 72.69 | 95 | 7.29% | 19.26% |
| LAUR | Laureate Education | | Services & Goods | 16.32 | 100 | 3.23% | 19.04% |
| ANIP | ANI | | Health Care | 65.62 | 30 | -1.65% | 19.01% |
| KPTI | Karyopharm | | Health Care | 1.02 | 32 | -6.82% | 18.50% |
| RM | Regional Management | | Financials | 29.71 | 93 | -2.40% | 18.46% |
| BDC | Belden | | Industrials | 91.46 | 100 | 1.16% | 18.39% |
| TH | Target Hospitality | | Industrials | 11.51 | 70 | 3.60% | 18.29% |
| PBI | Pitney Bowes | | Consumer Staples | 5.20 | 76 | -0.57% | 18.18% |
| PTGX | Protagonist | | Health Care | 27.07 | 47 | 4.98% | 18.08% |
| BPMC | Blueprint Medicines | | Health Care | 108.79 | 95 | 0.22% | 17.94% |
| STEP | StepStone Group | | Financials | 37.54 | 88 | -2.14% | 17.90% |
| KRT | Karat Packaging | | Services & Goods | 29.36 | 69 | 2.55% | 17.86% |
| CNX | CNX Resources | | Energy | 23.56 | 61 | -1.38% | 17.80% |
| AVO | Mission Produce | | Consumer Staples | 11.92 | 88 | 0.08% | 17.79% |
| LILA | Liberty Latin | | Technology | 8.61 | 100 | 4.87% | 17.78% |
| HQY | HealthEquity | | Technology | 78.06 | 15 | -2.89% | 17.74% |
| NWPX | Northwest Pipe | | Materials | 35.61 | 100 | -1.66% | 17.68% |
| BSIG | BrightSphere | | Financials | 22.54 | 10 | 0.76% | 17.64% |


| Too many stocks? View smallcap stocks filtered by marketcap & sector |
| Marketcap: All SmallCap Stocks (default-no microcap), Large, Mid-Range, Small |
| Smallcap Sector: Tech, Finance, Energy, Staples, Retail, Industrial, Materials, & Medical |
|
Get the most comprehensive stock market coverage daily at 12Stocks.com ➞ Best Stocks Today ➞ Best Stocks Weekly ➞ Best Stocks Year-to-Date ➞ Best Stocks Trends ➞  Best Stocks Today 12Stocks.com Best Nasdaq Stocks ➞ Best S&P 500 Stocks ➞ Best Tech Stocks ➞ Best Biotech Stocks ➞ |
| Detailed Overview of SmallCap Stocks |
| SmallCap Technical Overview, Leaders & Laggards, Top SmallCap ETF Funds & Detailed SmallCap Stocks List, Charts, Trends & More |
| Smallcap: Technical Analysis, Trends & YTD Performance | |
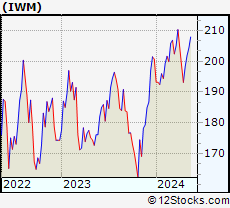
| SmallCap segment as represented by
IWM, an exchange-traded fund [ETF], holds basket of thousands of smallcap stocks from across all major sectors of the US stock market. The smallcap index (contains stocks like Riverbed & Sotheby's) is up by 1.53% and is currently underperforming the overall market by -6.51% year-to-date. Below is a quick view of technical charts and trends: | |
 IWM Weekly Chart |
|
| Long Term Trend: Deteriorating | |
| Medium Term Trend: Very Good | |
 IWM Daily Chart |
|
| Short Term Trend: Good | |
| Overall Trend Score: 70 | |
| YTD Performance: 1.53% | |
| **Trend Scores & Views Are Only For Educational Purposes And Not For Investing | |
| 12Stocks.com: Top Performing Small Cap Index Stocks | ||||||||||||||||||||||||||||||||||||||||||||||||
 The top performing Small Cap Index stocks year to date are
Now, more recently, over last week, the top performing Small Cap Index stocks on the move are


|
||||||||||||||||||||||||||||||||||||||||||||||||
| 12Stocks.com: Investing in Smallcap Index using Exchange Traded Funds | |
|
The following table shows list of key exchange traded funds (ETF) that
help investors track Smallcap index. The following list also includes leveraged ETF funds that track twice or thrice the daily returns of Smallcap indices. Short or inverse ETF funds move in the opposite direction to the index they track and are useful during market pullbacks or during bear markets. Quick View: Move mouse or cursor over ETF symbol (ticker) to view short-term technical chart and over ETF name to view long term chart. Click on ticker or stock name for detailed view. Click on to add stock symbol to your watchlist and to view watchlist. |
12Stocks.com List of ETFs that track Smallcap Index
| Ticker | ETF Name | Watchlist | Recent Price | Smart Investing & Trading Score | Change % | Week % | Year-to-date % |
| IWM | iShares Russell 2000 | | 203.78 | 70 | -0.58 | 0.93 | 1.53% |
| IJR | iShares Core S&P Small-Cap | | 108.26 | 58 | -0.33 | 1.05 | 0.01% |
| IWN | iShares Russell 2000 Value | | 155.37 | 76 | -0.17 | 0.75 | 0.03% |
| VTWO | Vanguard Russell 2000 ETF | | 82.40 | 57 | -0.53 | 0.97 | 1.6% |
| IWO | iShares Russell 2000 Growth | | 260.10 | 57 | -0.84 | 1.26 | 3.12% |
| IJS | iShares S&P Small-Cap 600 Value | | 99.80 | 40 | 0.12 | 1.09 | -3.17% |
| IJT | iShares S&P Small-Cap 600 Growth | | 129.03 | 71 | -0.62 | 0.99 | 3.11% |
| XSLV | PowerShares S&P SmallCap Low Volatil ETF | | 43.94 | 95 | -0.14 | 1.67 | -0.48% |
| SMLV | SPDR SSGA US Small Cap Low Volatil ETF | | 110.32 | 63 | -0.15 | 0.57 | -1.96% |
| SDD | ProShares UltraShort SmallCap600 | | 18.66 | 40 | 2.43 | -0.98 | 1.27% |
| SBB | ProShares Short SmallCap600 | | 16.08 | 25 | 0.69 | -0.5 | 0.94% |
| SAA | ProShares Ultra SmallCap600 | | 24.21 | 70 | -0.75 | 2.62 | -2.98% |
| 12Stocks.com: Charts, Trends, Fundamental Data and Performances of SmallCap Stocks | |
|
We now take in-depth look at all SmallCap stocks including charts, multi-period performances and overall trends (as measured by Smart Investing & Trading Score). One can sort SmallCap stocks (click link to choose) by Daily, Weekly and by Year-to-Date performances. Also, one can sort by size of the company or by market capitalization. |
| Select Your Default Chart Type: | |||||
| |||||
| Click on stock symbol or name for detailed view. Click on to add stock symbol to your watchlist and to view watchlist. Quick View: Move mouse or cursor over "Daily" to quickly view daily technical stock chart and over "Weekly" to view weekly technical stock chart. | |||||

 | SWX Southwest Gas Holdings, Inc. |
| Sector: Utilities | |
| SubSector: Gas Utilities | |
| MarketCap: 3427.87 Millions | |
| Recent Price: 75.79 Smart Investing & Trading Score: 66 | |
| Day Percent Change: -0.66% Day Change: -0.50 | |
| Week Change: 0.88% Year-to-date Change: 19.6% | |
| SWX Links: Profile News Message Board | |
| Charts:- Daily , Weekly | |
| Add SWX to Watchlist: View: Get Complete SWX Trend Analysis ➞ | |
 | GBX The Greenbrier Companies, Inc. |
| Sector: Transports | |
| SubSector: Railroads | |
| MarketCap: 511.022 Millions | |
| Recent Price: 52.82 Smart Investing & Trading Score: 50 | |
| Day Percent Change: 2.27% Day Change: 1.17 | |
| Week Change: 1.13% Year-to-date Change: 19.6% | |
| GBX Links: Profile News Message Board | |
| Charts:- Daily , Weekly | |
| Add GBX to Watchlist: View: Get Complete GBX Trend Analysis ➞ | |
 | TSQ Townsquare Media, Inc. |
| Sector: Services & Goods | |
| SubSector: Broadcasting - Radio | |
| MarketCap: 101.795 Millions | |
| Recent Price: 12.62 Smart Investing & Trading Score: 83 | |
| Day Percent Change: -0.08% Day Change: -0.01 | |
| Week Change: 1.04% Year-to-date Change: 19.5% | |
| TSQ Links: Profile News Message Board | |
| Charts:- Daily , Weekly | |
| Add TSQ to Watchlist: View: Get Complete TSQ Trend Analysis ➞ | |
 | KODK Eastman Kodak Company |
| Sector: Technology | |
| SubSector: Electronic Equipment | |
| MarketCap: 78.47 Millions | |
| Recent Price: 4.66 Smart Investing & Trading Score: 40 | |
| Day Percent Change: 1.30% Day Change: 0.06 | |
| Week Change: 0.87% Year-to-date Change: 19.5% | |
| KODK Links: Profile News Message Board | |
| Charts:- Daily , Weekly | |
| Add KODK to Watchlist: View: Get Complete KODK Trend Analysis ➞ | |
 | KAR KAR Auction Services, Inc. |
| Sector: Services & Goods | |
| SubSector: Specialty Retail, Other | |
| MarketCap: 1709.54 Millions | |
| Recent Price: 17.68 Smart Investing & Trading Score: 66 | |
| Day Percent Change: -1.12% Day Change: -0.20 | |
| Week Change: -0.06% Year-to-date Change: 19.4% | |
| KAR Links: Profile News Message Board | |
| Charts:- Daily , Weekly | |
| Add KAR to Watchlist: View: Get Complete KAR Trend Analysis ➞ | |
 | RSVR Reservoir Media, Inc. |
| Sector: Services & Goods | |
| SubSector: Entertainment | |
| MarketCap: 389 Millions | |
| Recent Price: 8.50 Smart Investing & Trading Score: 46 | |
| Day Percent Change: -0.82% Day Change: -0.07 | |
| Week Change: -2.13% Year-to-date Change: 19.4% | |
| RSVR Links: Profile News Message Board | |
| Charts:- Daily , Weekly | |
| Add RSVR to Watchlist: View: Get Complete RSVR Trend Analysis ➞ | |
 | CSWI CSW Industrials, Inc. |
| Sector: Industrials | |
| SubSector: Diversified Machinery | |
| MarketCap: 985.616 Millions | |
| Recent Price: 247.54 Smart Investing & Trading Score: 95 | |
| Day Percent Change: -1.12% Day Change: -2.80 | |
| Week Change: 1.94% Year-to-date Change: 19.4% | |
| CSWI Links: Profile News Message Board | |
| Charts:- Daily , Weekly | |
| Add CSWI to Watchlist: View: Get Complete CSWI Trend Analysis ➞ | |
 | GFF Griffon Corporation |
| Sector: Industrials | |
| SubSector: General Building Materials | |
| MarketCap: 616 Millions | |
| Recent Price: 72.69 Smart Investing & Trading Score: 95 | |
| Day Percent Change: 7.29% Day Change: 4.94 | |
| Week Change: 5.15% Year-to-date Change: 19.3% | |
| GFF Links: Profile News Message Board | |
| Charts:- Daily , Weekly | |
| Add GFF to Watchlist: View: Get Complete GFF Trend Analysis ➞ | |
 | LAUR Laureate Education, Inc. |
| Sector: Services & Goods | |
| SubSector: Education & Training Services | |
| MarketCap: 2258.56 Millions | |
| Recent Price: 16.32 Smart Investing & Trading Score: 100 | |
| Day Percent Change: 3.23% Day Change: 0.51 | |
| Week Change: 8.95% Year-to-date Change: 19.0% | |
| LAUR Links: Profile News Message Board | |
| Charts:- Daily , Weekly | |
| Add LAUR to Watchlist: View: Get Complete LAUR Trend Analysis ➞ | |
 | ANIP ANI Pharmaceuticals, Inc. |
| Sector: Health Care | |
| SubSector: Biotechnology | |
| MarketCap: 489.285 Millions | |
| Recent Price: 65.62 Smart Investing & Trading Score: 30 | |
| Day Percent Change: -1.65% Day Change: -1.10 | |
| Week Change: -2.42% Year-to-date Change: 19.0% | |
| ANIP Links: Profile News Message Board | |
| Charts:- Daily , Weekly | |
| Add ANIP to Watchlist: View: Get Complete ANIP Trend Analysis ➞ | |
 | KPTI Karyopharm Therapeutics Inc. |
| Sector: Health Care | |
| SubSector: Biotechnology | |
| MarketCap: 1471.85 Millions | |
| Recent Price: 1.02 Smart Investing & Trading Score: 32 | |
| Day Percent Change: -6.82% Day Change: -0.08 | |
| Week Change: -9.29% Year-to-date Change: 18.5% | |
| KPTI Links: Profile News Message Board | |
| Charts:- Daily , Weekly | |
| Add KPTI to Watchlist: View: Get Complete KPTI Trend Analysis ➞ | |
 | RM Regional Management Corp. |
| Sector: Financials | |
| SubSector: Credit Services | |
| MarketCap: 148.008 Millions | |
| Recent Price: 29.71 Smart Investing & Trading Score: 93 | |
| Day Percent Change: -2.40% Day Change: -0.73 | |
| Week Change: 4.83% Year-to-date Change: 18.5% | |
| RM Links: Profile News Message Board | |
| Charts:- Daily , Weekly | |
| Add RM to Watchlist: View: Get Complete RM Trend Analysis ➞ | |
 | BDC Belden Inc. |
| Sector: Industrials | |
| SubSector: Industrial Electrical Equipment | |
| MarketCap: 1490.59 Millions | |
| Recent Price: 91.46 Smart Investing & Trading Score: 100 | |
| Day Percent Change: 1.16% Day Change: 1.05 | |
| Week Change: 3.66% Year-to-date Change: 18.4% | |
| BDC Links: Profile News Message Board | |
| Charts:- Daily , Weekly | |
| Add BDC to Watchlist: View: Get Complete BDC Trend Analysis ➞ | |
 | TH Target Hospitality Corp. |
| Sector: Industrials | |
| SubSector: Conglomerates | |
| MarketCap: 218.048 Millions | |
| Recent Price: 11.51 Smart Investing & Trading Score: 70 | |
| Day Percent Change: 3.60% Day Change: 0.40 | |
| Week Change: 2.77% Year-to-date Change: 18.3% | |
| TH Links: Profile News Message Board | |
| Charts:- Daily , Weekly | |
| Add TH to Watchlist: View: Get Complete TH Trend Analysis ➞ | |
 | PBI Pitney Bowes Inc. |
| Sector: Consumer Staples | |
| SubSector: Business Equipment | |
| MarketCap: 408.067 Millions | |
| Recent Price: 5.20 Smart Investing & Trading Score: 76 | |
| Day Percent Change: -0.57% Day Change: -0.03 | |
| Week Change: -1.33% Year-to-date Change: 18.2% | |
| PBI Links: Profile News Message Board | |
| Charts:- Daily , Weekly | |
| Add PBI to Watchlist: View: Get Complete PBI Trend Analysis ➞ | |
 | PTGX Protagonist Therapeutics, Inc. |
| Sector: Health Care | |
| SubSector: Biotechnology | |
| MarketCap: 165.285 Millions | |
| Recent Price: 27.07 Smart Investing & Trading Score: 47 | |
| Day Percent Change: 4.98% Day Change: 1.29 | |
| Week Change: 3.78% Year-to-date Change: 18.1% | |
| PTGX Links: Profile News Message Board | |
| Charts:- Daily , Weekly | |
| Add PTGX to Watchlist: View: Get Complete PTGX Trend Analysis ➞ | |
 | BPMC Blueprint Medicines Corporation |
| Sector: Health Care | |
| SubSector: Biotechnology | |
| MarketCap: 3113.55 Millions | |
| Recent Price: 108.79 Smart Investing & Trading Score: 95 | |
| Day Percent Change: 0.22% Day Change: 0.24 | |
| Week Change: 1.49% Year-to-date Change: 17.9% | |
| BPMC Links: Profile News Message Board | |
| Charts:- Daily , Weekly | |
| Add BPMC to Watchlist: View: Get Complete BPMC Trend Analysis ➞ | |
 | STEP StepStone Group Inc. |
| Sector: Financials | |
| SubSector: Asset Management | |
| MarketCap: 30757 Millions | |
| Recent Price: 37.54 Smart Investing & Trading Score: 88 | |
| Day Percent Change: -2.14% Day Change: -0.82 | |
| Week Change: 1.73% Year-to-date Change: 17.9% | |
| STEP Links: Profile News Message Board | |
| Charts:- Daily , Weekly | |
| Add STEP to Watchlist: View: Get Complete STEP Trend Analysis ➞ | |
 | KRT Karat Packaging Inc. |
| Sector: Services & Goods | |
| SubSector: Packaging & Containers | |
| MarketCap: 357 Millions | |
| Recent Price: 29.36 Smart Investing & Trading Score: 69 | |
| Day Percent Change: 2.55% Day Change: 0.73 | |
| Week Change: 7.74% Year-to-date Change: 17.9% | |
| KRT Links: Profile News Message Board | |
| Charts:- Daily , Weekly | |
| Add KRT to Watchlist: View: Get Complete KRT Trend Analysis ➞ | |
 | CNX CNX Resources Corporation |
| Sector: Energy | |
| SubSector: Independent Oil & Gas | |
| MarketCap: 1344.33 Millions | |
| Recent Price: 23.56 Smart Investing & Trading Score: 61 | |
| Day Percent Change: -1.38% Day Change: -0.33 | |
| Week Change: 1.16% Year-to-date Change: 17.8% | |
| CNX Links: Profile News Message Board | |
| Charts:- Daily , Weekly | |
| Add CNX to Watchlist: View: Get Complete CNX Trend Analysis ➞ | |
 | AVO Mission Produce, Inc. |
| Sector: Consumer Staples | |
| SubSector: Farm Products | |
| MarketCap: 91347 Millions | |
| Recent Price: 11.92 Smart Investing & Trading Score: 88 | |
| Day Percent Change: 0.08% Day Change: 0.01 | |
| Week Change: 1.1% Year-to-date Change: 17.8% | |
| AVO Links: Profile News Message Board | |
| Charts:- Daily , Weekly | |
| Add AVO to Watchlist: View: Get Complete AVO Trend Analysis ➞ | |
 | LILA Liberty Latin America Ltd. |
| Sector: Technology | |
| SubSector: CATV Systems | |
| MarketCap: 2092.62 Millions | |
| Recent Price: 8.61 Smart Investing & Trading Score: 100 | |
| Day Percent Change: 4.87% Day Change: 0.40 | |
| Week Change: 7.09% Year-to-date Change: 17.8% | |
| LILA Links: Profile News Message Board | |
| Charts:- Daily , Weekly | |
| Add LILA to Watchlist: View: Get Complete LILA Trend Analysis ➞ | |
 | HQY HealthEquity, Inc. |
| Sector: Technology | |
| SubSector: Healthcare Information Services | |
| MarketCap: 3369.75 Millions | |
| Recent Price: 78.06 Smart Investing & Trading Score: 15 | |
| Day Percent Change: -2.89% Day Change: -2.32 | |
| Week Change: -0.62% Year-to-date Change: 17.7% | |
| HQY Links: Profile News Message Board | |
| Charts:- Daily , Weekly | |
| Add HQY to Watchlist: View: Get Complete HQY Trend Analysis ➞ | |
 | NWPX Northwest Pipe Company |
| Sector: Materials | |
| SubSector: Steel & Iron | |
| MarketCap: 245.788 Millions | |
| Recent Price: 35.61 Smart Investing & Trading Score: 100 | |
| Day Percent Change: -1.66% Day Change: -0.60 | |
| Week Change: 8.83% Year-to-date Change: 17.7% | |
| NWPX Links: Profile News Message Board | |
| Charts:- Daily , Weekly | |
| Add NWPX to Watchlist: View: Get Complete NWPX Trend Analysis ➞ | |
 | BSIG BrightSphere Investment Group Inc. |
| Sector: Financials | |
| SubSector: Asset Management | |
| MarketCap: 430.103 Millions | |
| Recent Price: 22.54 Smart Investing & Trading Score: 10 | |
| Day Percent Change: 0.76% Day Change: 0.17 | |
| Week Change: -0.09% Year-to-date Change: 17.6% | |
| BSIG Links: Profile News Message Board | |
| Charts:- Daily , Weekly | |
| Add BSIG to Watchlist: View: Get Complete BSIG Trend Analysis ➞ | |
| Too many stocks? View smallcap stocks filtered by marketcap & sector |
| Marketcap: All SmallCap Stocks (default-no microcap), Large, Mid-Range, Small & MicroCap |
| Sector: Tech, Finance, Energy, Staples, Retail, Industrial, Materials, Utilities & Medical |
|
Best Stocks Today 12Stocks.com |
© 2024 12Stocks.com Terms & Conditions Privacy Contact Us
All Information Provided Only For Education And Not To Be Used For Investing or Trading. See Terms & Conditions


One More Thing ... Get Best Stocks Delivered Daily!
Never Ever Miss A Move With Our Top Ten Stocks Lists
Find Best Stocks In Any Market - Bull or Bear Market
Take A Peek At Our Top Ten Stocks Lists: Daily, Weekly, Year-to-Date & Top Trends
Find Best Stocks In Any Market - Bull or Bear Market
Take A Peek At Our Top Ten Stocks Lists: Daily, Weekly, Year-to-Date & Top Trends
Smallcap Stocks With Best Up Trends [0-bearish to 100-bullish]: Cricut [100], DASAN Zhone[100], Latham Group[100], Hyster-Yale Materials[100], Myriad Genetics[100], Alpha and[100], Vigil Neuroscience[100], Hannon Armstrong[100], Ardmore Shipping[100], Inogen [100], Payoneer Global[100]
Best Smallcap Stocks Year-to-Date:
CareMax [580.41%], Janux [415.82%], Viking [329.77%], Bakkt [295.29%], Longboard [255.4%], Alpine Immune[239.73%], Vera [190.25%], Super Micro[189.4%], Avidity Biosciences[188.27%], Cullinan Oncology[172%], Arcutis Bio[147.06%] Best Smallcap Stocks This Week:
DASAN Zhone[64.32%], Innodata [55.88%], Perficient [52.92%], Cricut [42.32%], Vigil Neuroscience[39.52%], Thoughtworks Holding[36.89%], Latham Group[35.9%], Great Lakes[32.18%], Bakkt [31.96%], Outset Medical[31.95%], P3 Health[27.95%] Best Smallcap Stocks Daily:
Innodata [55.42%], Cricut [47.47%], DASAN Zhone[30.11%], Latham Group[24.08%], Hyster-Yale Materials[23.55%], iRobot [21.40%], Myriad Genetics[21.13%], Ameresco [21.13%], Bakkt [20.92%], Alpha and[20.78%], Vigil Neuroscience[18.97%]