
 Login Sign Up


| |||||
 |  | ||||

| 12Stocks.com Market Intelligence |
Best SmallCap Stocks
|
| In a hurry? Small Cap Stock Lists: Performance Trends Table, Stock Charts
Sort Small Cap stocks: Daily, Weekly, Year-to-Date, Market Cap & Trends. Filter Small Cap stocks list by sector: Show all, Tech, Finance, Energy, Staples, Retail, Industrial, Materials, Utilities and HealthCare Filter Small Cap stocks list by size: All Large Medium Small and MicroCap |
| 12Stocks.com Small Cap Stocks Performances & Trends Daily | |||||||||
|
|  The overall Smart Investing & Trading Score is 87 (0-bearish to 100-bullish) which puts Small Cap index in short term bullish trend. The Smart Investing & Trading Score from previous trading session is 82 and hence an improvement of trend.
| ||||||||
Here are the Smart Investing & Trading Scores of the most requested small cap stocks at 12Stocks.com (click stock name for detailed review):
|


| 12Stocks.com: Investing in Smallcap Index with Stocks | |
|
The following table helps investors and traders sort through current performance and trends (as measured by Smart Investing & Trading Score) of various
stocks in the Smallcap Index. Quick View: Move mouse or cursor over stock symbol (ticker) to view short-term technical chart and over stock name to view long term chart. Click on  to add stock symbol to your watchlist and to add stock symbol to your watchlist and  to view watchlist. Click on any ticker or stock name for detailed market intelligence report for that stock. to view watchlist. Click on any ticker or stock name for detailed market intelligence report for that stock. |
12Stocks.com Performance of Stocks in Smallcap Index
| Ticker | Stock Name | Watchlist | Category | Recent Price | Smart Investing & Trading Score | Change % | YTD Change% |
| COGT | Cogint |   | Technology | 7.76 | 19 | 2.51% | 31.97% |
| EAT | Brinker | | Services & Goods | 56.96 | 95 | -0.99% | 31.91% |
| WIRE | Encore Wire | | Technology | 281.20 | 54 | 0.09% | 31.65% |
| CHEF | Chefs | | Consumer Staples | 38.73 | 100 | 2.65% | 31.60% |
| CLW | Clearwater Paper | | Consumer Staples | 47.53 | 100 | -0.65% | 31.59% |
| ATI | Allegheny | | Industrials | 59.81 | 95 | 1.24% | 31.54% |
| AESI | Atlas Energy | | Energy | 22.50 | 76 | -1.81% | 31.43% |
| AZZ | AZZ | | Industrials | 76.26 | 85 | 1.15% | 31.28% |
| VSEC | VSE | | Services & Goods | 84.82 | 100 | 0.47% | 31.28% |
| STRA | Strategic Education | | Services & Goods | 121.16 | 90 | -1.50% | 31.17% |
| AROC | Archrock | | Energy | 20.17 | 78 | 0.70% | 30.97% |
| KOD | Kodiak Sciences | | Health Care | 3.98 | 69 | 1.02% | 30.92% |
| MLR | Miller Industries | | Consumer Staples | 55.32 | 100 | 2.03% | 30.81% |
| ORGN | Origin Materials | | Materials | 1.10 | 95 | 18.38% | 30.50% |
| KRYS | Krystal Biotech | | Health Care | 161.59 | 78 | 2.96% | 30.25% |
| VNDA | Vanda | | Health Care | 5.48 | 100 | 13.22% | 29.86% |
| IBP | Installed Building | | Industrials | 236.93 | 22 | -4.87% | 29.60% |
| FDMT | 4D Molecular | | Health Care | 26.80 | 59 | 0.15% | 29.47% |
| XFOR | X4 | | Health Care | 1.09 | 56 | -9.21% | 29.40% |
| LYEL | Lyell Immunopharma | | Health Care | 2.54 | 74 | 0.40% | 29.26% |
| AVIR | Atea | | Health Care | 3.94 | 47 | -1.50% | 29.18% |
| DNOW | NOW | | Energy | 14.62 | 83 | 0.27% | 29.15% |
| UCTT | Ultra Clean | | Technology | 44.07 | 100 | 2.58% | 29.09% |
| WWW | Wolverine World | | Consumer Staples | 11.42 | 100 | -0.09% | 28.46% |
| MLP | Maui Land | | Financials | 20.40 | 90 | 0.84% | 28.38% |


| Too many stocks? View smallcap stocks filtered by marketcap & sector |
| Marketcap: All SmallCap Stocks (default-no microcap), Large, Mid-Range, Small |
| Smallcap Sector: Tech, Finance, Energy, Staples, Retail, Industrial, Materials, & Medical |
|
Get the most comprehensive stock market coverage daily at 12Stocks.com ➞ Best Stocks Today ➞ Best Stocks Weekly ➞ Best Stocks Year-to-Date ➞ Best Stocks Trends ➞  Best Stocks Today 12Stocks.com Best Nasdaq Stocks ➞ Best S&P 500 Stocks ➞ Best Tech Stocks ➞ Best Biotech Stocks ➞ |
| Detailed Overview of SmallCap Stocks |
| SmallCap Technical Overview, Leaders & Laggards, Top SmallCap ETF Funds & Detailed SmallCap Stocks List, Charts, Trends & More |
| Smallcap: Technical Analysis, Trends & YTD Performance | |
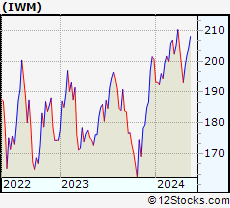
| SmallCap segment as represented by
IWM, an exchange-traded fund [ETF], holds basket of thousands of smallcap stocks from across all major sectors of the US stock market. The smallcap index (contains stocks like Riverbed & Sotheby's) is up by 2.12% and is currently underperforming the overall market by -6% year-to-date. Below is a quick view of technical charts and trends: | |
 IWM Weekly Chart |
|
| Long Term Trend: Very Good | |
| Medium Term Trend: Very Good | |
 IWM Daily Chart |
|
| Short Term Trend: Very Good | |
| Overall Trend Score: 87 | |
| YTD Performance: 2.12% | |
| **Trend Scores & Views Are Only For Educational Purposes And Not For Investing | |
| 12Stocks.com: Top Performing Small Cap Index Stocks | ||||||||||||||||||||||||||||||||||||||||||||||||
 The top performing Small Cap Index stocks year to date are
Now, more recently, over last week, the top performing Small Cap Index stocks on the move are


|
||||||||||||||||||||||||||||||||||||||||||||||||
| 12Stocks.com: Investing in Smallcap Index using Exchange Traded Funds | |
|
The following table shows list of key exchange traded funds (ETF) that
help investors track Smallcap index. The following list also includes leveraged ETF funds that track twice or thrice the daily returns of Smallcap indices. Short or inverse ETF funds move in the opposite direction to the index they track and are useful during market pullbacks or during bear markets. Quick View: Move mouse or cursor over ETF symbol (ticker) to view short-term technical chart and over ETF name to view long term chart. Click on ticker or stock name for detailed view. Click on to add stock symbol to your watchlist and to view watchlist. |
12Stocks.com List of ETFs that track Smallcap Index
| Ticker | ETF Name | Watchlist | Recent Price | Smart Investing & Trading Score | Change % | Week % | Year-to-date % |
| IWM | iShares Russell 2000 | | 204.97 | 87 | 0.22 | 1.52 | 2.12% |
| IJR | iShares Core S&P Small-Cap | | 108.62 | 100 | 0.33 | 1.39 | 0.34% |
| VTWO | Vanguard Russell 2000 ETF | | 82.84 | 82 | 0.22 | 1.51 | 2.15% |
| IWN | iShares Russell 2000 Value | | 155.63 | 100 | -0.01 | 0.92 | 0.19% |
| IWO | iShares Russell 2000 Growth | | 262.30 | 82 | 0.49 | 2.11 | 4% |
| IJS | iShares S&P Small-Cap 600 Value | | 99.68 | 69 | -0.07 | 0.97 | -3.29% |
| IJT | iShares S&P Small-Cap 600 Growth | | 129.84 | 95 | 0.56 | 1.63 | 3.76% |
| XSLV | PowerShares S&P SmallCap Low Volatil ETF | | 44.00 | 100 | 0.96 | 1.8 | -0.34% |
| SAA | ProShares Ultra SmallCap600 | | 24.39 | 95 | 1.16 | 3.39 | -2.24% |
| SMLV | SPDR SSGA US Small Cap Low Volatil ETF | | 110.48 | 100 | -0.10 | 0.72 | -1.81% |
| SBB | ProShares Short SmallCap600 | | 15.97 | 0 | -0.50 | -1.18 | 0.25% |
| SDD | ProShares UltraShort SmallCap600 | | 18.22 | 10 | -1.10 | -3.33 | -1.13% |
| 12Stocks.com: Charts, Trends, Fundamental Data and Performances of SmallCap Stocks | |
|
We now take in-depth look at all SmallCap stocks including charts, multi-period performances and overall trends (as measured by Smart Investing & Trading Score). One can sort SmallCap stocks (click link to choose) by Daily, Weekly and by Year-to-Date performances. Also, one can sort by size of the company or by market capitalization. |
| Select Your Default Chart Type: | |||||
| |||||
| Click on stock symbol or name for detailed view. Click on to add stock symbol to your watchlist and to view watchlist. Quick View: Move mouse or cursor over "Daily" to quickly view daily technical stock chart and over "Weekly" to view weekly technical stock chart. | |||||

 | COGT Cogint, Inc. |
| Sector: Technology | |
| SubSector: Business Software & Services | |
| MarketCap: 214.55 Millions | |
| Recent Price: 7.76 Smart Investing & Trading Score: 19 | |
| Day Percent Change: 2.51% Day Change: 0.19 | |
| Week Change: 3.05% Year-to-date Change: 32.0% | |
| COGT Links: Profile News Message Board | |
| Charts:- Daily , Weekly | |
| Add COGT to Watchlist: View: Get Complete COGT Trend Analysis ➞ | |
 | EAT Brinker International, Inc. |
| Sector: Services & Goods | |
| SubSector: Restaurants | |
| MarketCap: 435.97 Millions | |
| Recent Price: 56.96 Smart Investing & Trading Score: 95 | |
| Day Percent Change: -0.99% Day Change: -0.57 | |
| Week Change: 3.6% Year-to-date Change: 31.9% | |
| EAT Links: Profile News Message Board | |
| Charts:- Daily , Weekly | |
| Add EAT to Watchlist: View: Get Complete EAT Trend Analysis ➞ | |
 | WIRE Encore Wire Corporation |
| Sector: Technology | |
| SubSector: Diversified Electronics | |
| MarketCap: 898.896 Millions | |
| Recent Price: 281.20 Smart Investing & Trading Score: 54 | |
| Day Percent Change: 0.09% Day Change: 0.26 | |
| Week Change: -0.65% Year-to-date Change: 31.7% | |
| WIRE Links: Profile News Message Board | |
| Charts:- Daily , Weekly | |
| Add WIRE to Watchlist: View: Get Complete WIRE Trend Analysis ➞ | |
 | CHEF The Chefs Warehouse, Inc. |
| Sector: Consumer Staples | |
| SubSector: Food Wholesale | |
| MarketCap: 207.529 Millions | |
| Recent Price: 38.73 Smart Investing & Trading Score: 100 | |
| Day Percent Change: 2.65% Day Change: 1.00 | |
| Week Change: 2.51% Year-to-date Change: 31.6% | |
| CHEF Links: Profile News Message Board | |
| Charts:- Daily , Weekly | |
| Add CHEF to Watchlist: View: Get Complete CHEF Trend Analysis ➞ | |
 | CLW Clearwater Paper Corporation |
| Sector: Consumer Staples | |
| SubSector: Paper & Paper Products | |
| MarketCap: 416.803 Millions | |
| Recent Price: 47.53 Smart Investing & Trading Score: 100 | |
| Day Percent Change: -0.65% Day Change: -0.31 | |
| Week Change: 5.11% Year-to-date Change: 31.6% | |
| CLW Links: Profile News Message Board | |
| Charts:- Daily , Weekly | |
| Add CLW to Watchlist: View: Get Complete CLW Trend Analysis ➞ | |
 | ATI Allegheny Technologies Incorporated |
| Sector: Industrials | |
| SubSector: Metal Fabrication | |
| MarketCap: 913.35 Millions | |
| Recent Price: 59.81 Smart Investing & Trading Score: 95 | |
| Day Percent Change: 1.24% Day Change: 0.73 | |
| Week Change: 2.84% Year-to-date Change: 31.5% | |
| ATI Links: Profile News Message Board | |
| Charts:- Daily , Weekly | |
| Add ATI to Watchlist: View: Get Complete ATI Trend Analysis ➞ | |
 | AESI Atlas Energy Solutions Inc. |
| Sector: Energy | |
| SubSector: Oil & Gas Equipment & Services | |
| MarketCap: 947 Millions | |
| Recent Price: 22.50 Smart Investing & Trading Score: 76 | |
| Day Percent Change: -1.81% Day Change: -0.41 | |
| Week Change: 2.88% Year-to-date Change: 31.4% | |
| AESI Links: Profile News Message Board | |
| Charts:- Daily , Weekly | |
| Add AESI to Watchlist: View: Get Complete AESI Trend Analysis ➞ | |
 | AZZ AZZ Inc. |
| Sector: Industrials | |
| SubSector: Diversified Machinery | |
| MarketCap: 743.416 Millions | |
| Recent Price: 76.26 Smart Investing & Trading Score: 85 | |
| Day Percent Change: 1.15% Day Change: 0.87 | |
| Week Change: 1.65% Year-to-date Change: 31.3% | |
| AZZ Links: Profile News Message Board | |
| Charts:- Daily , Weekly | |
| Add AZZ to Watchlist: View: Get Complete AZZ Trend Analysis ➞ | |
 | VSEC VSE Corporation |
| Sector: Services & Goods | |
| SubSector: Technical Services | |
| MarketCap: 183.61 Millions | |
| Recent Price: 84.82 Smart Investing & Trading Score: 100 | |
| Day Percent Change: 0.47% Day Change: 0.40 | |
| Week Change: 2.32% Year-to-date Change: 31.3% | |
| VSEC Links: Profile News Message Board | |
| Charts:- Daily , Weekly | |
| Add VSEC to Watchlist: View: Get Complete VSEC Trend Analysis ➞ | |
 | STRA Strategic Education, Inc. |
| Sector: Services & Goods | |
| SubSector: Education & Training Services | |
| MarketCap: 2621.56 Millions | |
| Recent Price: 121.16 Smart Investing & Trading Score: 90 | |
| Day Percent Change: -1.50% Day Change: -1.84 | |
| Week Change: 0.42% Year-to-date Change: 31.2% | |
| STRA Links: Profile News Message Board | |
| Charts:- Daily , Weekly | |
| Add STRA to Watchlist: View: Get Complete STRA Trend Analysis ➞ | |
 | AROC Archrock, Inc. |
| Sector: Energy | |
| SubSector: Oil & Gas Equipment & Services | |
| MarketCap: 614.961 Millions | |
| Recent Price: 20.17 Smart Investing & Trading Score: 78 | |
| Day Percent Change: 0.70% Day Change: 0.14 | |
| Week Change: -0.2% Year-to-date Change: 31.0% | |
| AROC Links: Profile News Message Board | |
| Charts:- Daily , Weekly | |
| Add AROC to Watchlist: View: Get Complete AROC Trend Analysis ➞ | |
 | KOD Kodiak Sciences Inc. |
| Sector: Health Care | |
| SubSector: Biotechnology | |
| MarketCap: 2132.15 Millions | |
| Recent Price: 3.98 Smart Investing & Trading Score: 69 | |
| Day Percent Change: 1.02% Day Change: 0.04 | |
| Week Change: 5.57% Year-to-date Change: 30.9% | |
| KOD Links: Profile News Message Board | |
| Charts:- Daily , Weekly | |
| Add KOD to Watchlist: View: Get Complete KOD Trend Analysis ➞ | |
 | MLR Miller Industries, Inc. |
| Sector: Consumer Staples | |
| SubSector: Auto Parts | |
| MarketCap: 335.239 Millions | |
| Recent Price: 55.32 Smart Investing & Trading Score: 100 | |
| Day Percent Change: 2.03% Day Change: 1.10 | |
| Week Change: 4.44% Year-to-date Change: 30.8% | |
| MLR Links: Profile News Message Board | |
| Charts:- Daily , Weekly | |
| Add MLR to Watchlist: View: Get Complete MLR Trend Analysis ➞ | |
 | ORGN Origin Materials, Inc. |
| Sector: Materials | |
| SubSector: Chemicals | |
| MarketCap: 586 Millions | |
| Recent Price: 1.10 Smart Investing & Trading Score: 95 | |
| Day Percent Change: 18.38% Day Change: 0.17 | |
| Week Change: -5.98% Year-to-date Change: 30.5% | |
| ORGN Links: Profile News Message Board | |
| Charts:- Daily , Weekly | |
| Add ORGN to Watchlist: View: Get Complete ORGN Trend Analysis ➞ | |
 | KRYS Krystal Biotech, Inc. |
| Sector: Health Care | |
| SubSector: Biotechnology | |
| MarketCap: 874.085 Millions | |
| Recent Price: 161.59 Smart Investing & Trading Score: 78 | |
| Day Percent Change: 2.96% Day Change: 4.65 | |
| Week Change: 0.3% Year-to-date Change: 30.3% | |
| KRYS Links: Profile News Message Board | |
| Charts:- Daily , Weekly | |
| Add KRYS to Watchlist: View: Get Complete KRYS Trend Analysis ➞ | |
 | VNDA Vanda Pharmaceuticals Inc. |
| Sector: Health Care | |
| SubSector: Biotechnology | |
| MarketCap: 464.585 Millions | |
| Recent Price: 5.48 Smart Investing & Trading Score: 100 | |
| Day Percent Change: 13.22% Day Change: 0.64 | |
| Week Change: 12.3% Year-to-date Change: 29.9% | |
| VNDA Links: Profile News Message Board | |
| Charts:- Daily , Weekly | |
| Add VNDA to Watchlist: View: Get Complete VNDA Trend Analysis ➞ | |
 | IBP Installed Building Products, Inc. |
| Sector: Industrials | |
| SubSector: General Building Materials | |
| MarketCap: 1284.23 Millions | |
| Recent Price: 236.93 Smart Investing & Trading Score: 22 | |
| Day Percent Change: -4.87% Day Change: -12.13 | |
| Week Change: -2.78% Year-to-date Change: 29.6% | |
| IBP Links: Profile News Message Board | |
| Charts:- Daily , Weekly | |
| Add IBP to Watchlist: View: Get Complete IBP Trend Analysis ➞ | |
 | FDMT 4D Molecular Therapeutics, Inc. |
| Sector: Health Care | |
| SubSector: Biotechnology | |
| MarketCap: 772 Millions | |
| Recent Price: 26.80 Smart Investing & Trading Score: 59 | |
| Day Percent Change: 0.15% Day Change: 0.04 | |
| Week Change: 0.37% Year-to-date Change: 29.5% | |
| FDMT Links: Profile News Message Board | |
| Charts:- Daily , Weekly | |
| Add FDMT to Watchlist: View: Get Complete FDMT Trend Analysis ➞ | |
 | XFOR X4 Pharmaceuticals, Inc. |
| Sector: Health Care | |
| SubSector: Biotechnology | |
| MarketCap: 143.385 Millions | |
| Recent Price: 1.09 Smart Investing & Trading Score: 56 | |
| Day Percent Change: -9.21% Day Change: -0.11 | |
| Week Change: -5.65% Year-to-date Change: 29.4% | |
| XFOR Links: Profile News Message Board | |
| Charts:- Daily , Weekly | |
| Add XFOR to Watchlist: View: Get Complete XFOR Trend Analysis ➞ | |
 | LYEL Lyell Immunopharma, Inc. |
| Sector: Health Care | |
| SubSector: Biotechnology | |
| MarketCap: 809 Millions | |
| Recent Price: 2.54 Smart Investing & Trading Score: 74 | |
| Day Percent Change: 0.40% Day Change: 0.01 | |
| Week Change: 4.31% Year-to-date Change: 29.3% | |
| LYEL Links: Profile News Message Board | |
| Charts:- Daily , Weekly | |
| Add LYEL to Watchlist: View: Get Complete LYEL Trend Analysis ➞ | |
 | AVIR Atea Pharmaceuticals, Inc. |
| Sector: Health Care | |
| SubSector: Biotechnology | |
| MarketCap: 22587 Millions | |
| Recent Price: 3.94 Smart Investing & Trading Score: 47 | |
| Day Percent Change: -1.50% Day Change: -0.06 | |
| Week Change: -0.51% Year-to-date Change: 29.2% | |
| AVIR Links: Profile News Message Board | |
| Charts:- Daily , Weekly | |
| Add AVIR to Watchlist: View: Get Complete AVIR Trend Analysis ➞ | |
 | DNOW NOW Inc. |
| Sector: Energy | |
| SubSector: Oil & Gas Equipment & Services | |
| MarketCap: 679.661 Millions | |
| Recent Price: 14.62 Smart Investing & Trading Score: 83 | |
| Day Percent Change: 0.27% Day Change: 0.04 | |
| Week Change: 1.95% Year-to-date Change: 29.2% | |
| DNOW Links: Profile News Message Board | |
| Charts:- Daily , Weekly | |
| Add DNOW to Watchlist: View: Get Complete DNOW Trend Analysis ➞ | |
 | UCTT Ultra Clean Holdings, Inc. |
| Sector: Technology | |
| SubSector: Semiconductor Equipment & Materials | |
| MarketCap: 528.518 Millions | |
| Recent Price: 44.07 Smart Investing & Trading Score: 100 | |
| Day Percent Change: 2.58% Day Change: 1.11 | |
| Week Change: 4.65% Year-to-date Change: 29.1% | |
| UCTT Links: Profile News Message Board | |
| Charts:- Daily , Weekly | |
| Add UCTT to Watchlist: View: Get Complete UCTT Trend Analysis ➞ | |
 | WWW Wolverine World Wide, Inc. |
| Sector: Consumer Staples | |
| SubSector: Textile - Apparel Footwear & Accessories | |
| MarketCap: 1390.7 Millions | |
| Recent Price: 11.42 Smart Investing & Trading Score: 100 | |
| Day Percent Change: -0.09% Day Change: -0.01 | |
| Week Change: 6.23% Year-to-date Change: 28.5% | |
| WWW Links: Profile News Message Board | |
| Charts:- Daily , Weekly | |
| Add WWW to Watchlist: View: Get Complete WWW Trend Analysis ➞ | |
 | MLP Maui Land & Pineapple Company, Inc. |
| Sector: Financials | |
| SubSector: Real Estate Development | |
| MarketCap: 186.619 Millions | |
| Recent Price: 20.40 Smart Investing & Trading Score: 90 | |
| Day Percent Change: 0.84% Day Change: 0.17 | |
| Week Change: 1.39% Year-to-date Change: 28.4% | |
| MLP Links: Profile News Message Board | |
| Charts:- Daily , Weekly | |
| Add MLP to Watchlist: View: Get Complete MLP Trend Analysis ➞ | |
| Too many stocks? View smallcap stocks filtered by marketcap & sector |
| Marketcap: All SmallCap Stocks (default-no microcap), Large, Mid-Range, Small & MicroCap |
| Sector: Tech, Finance, Energy, Staples, Retail, Industrial, Materials, Utilities & Medical |
|
Best Stocks Today 12Stocks.com |
© 2024 12Stocks.com Terms & Conditions Privacy Contact Us
All Information Provided Only For Education And Not To Be Used For Investing or Trading. See Terms & Conditions


One More Thing ... Get Best Stocks Delivered Daily!
Never Ever Miss A Move With Our Top Ten Stocks Lists
Find Best Stocks In Any Market - Bull or Bear Market
Take A Peek At Our Top Ten Stocks Lists: Daily, Weekly, Year-to-Date & Top Trends
Find Best Stocks In Any Market - Bull or Bear Market
Take A Peek At Our Top Ten Stocks Lists: Daily, Weekly, Year-to-Date & Top Trends
Smallcap Stocks With Best Up Trends [0-bearish to 100-bullish]: Design [100], Ambac Financial[100], Summit [100], EverQuote [100], Zeta Global[100], Coca-Cola Consolidated[100], J & J Snack Foods[100], Sterling Construction[100], Vanda [100], CPI Card[100], Semrush [100]
Best Smallcap Stocks Year-to-Date:
CareMax [570.1%], Janux [472.36%], Viking [327.78%], Longboard [260.8%], Alpine Immune[239.34%], Bakkt [226.91%], Vera [190.7%], Super Micro[188.22%], Cullinan Oncology[187.89%], Avidity Biosciences[180.86%], Y-mAbs [152.49%] Best Smallcap Stocks This Week:
Perficient [52.32%], Thoughtworks Holding[34.22%], Trupanion [28.72%], DASAN Zhone[26.29%], Great Lakes[25.72%], Workhorse Group[24.5%], Design [23.42%], Ambac Financial[22.97%], P3 Health[22.36%], Outset Medical[21.09%], Summit [20.96%] Best Smallcap Stocks Daily:
Design [28.85%], Great Lakes[24.29%], Thoughtworks Holding[19.84%], Ambac Financial[19.31%], Summit [18.79%], EverQuote [18.40%], Origin Materials[18.38%], Zeta Global[18.35%], FibroGen [18.10%], Coca-Cola Consolidated[17.65%], Children s[16.44%]