
 Login Sign Up


| |||||
 |  | ||||

| 12Stocks.com Market Intelligence |
Best SmallCap Stocks
|
| In a hurry? Small Cap Stock Lists: Performance Trends Table, Stock Charts
Sort Small Cap stocks: Daily, Weekly, Year-to-Date, Market Cap & Trends. Filter Small Cap stocks list by sector: Show all, Tech, Finance, Energy, Staples, Retail, Industrial, Materials, Utilities and HealthCare Filter Small Cap stocks list by size: All Large Medium Small and MicroCap |
| 12Stocks.com Small Cap Stocks Performances & Trends Daily | |||||||||
|
|  The overall Smart Investing & Trading Score is 70 (0-bearish to 100-bullish) which puts Small Cap index in short term neutral to bullish trend. The Smart Investing & Trading Score from previous trading session is 87 and hence a deterioration of trend.
| ||||||||
Here are the Smart Investing & Trading Scores of the most requested small cap stocks at 12Stocks.com (click stock name for detailed review):
|


| 12Stocks.com: Investing in Smallcap Index with Stocks | |
|
The following table helps investors and traders sort through current performance and trends (as measured by Smart Investing & Trading Score) of various
stocks in the Smallcap Index. Quick View: Move mouse or cursor over stock symbol (ticker) to view short-term technical chart and over stock name to view long term chart. Click on  to add stock symbol to your watchlist and to add stock symbol to your watchlist and  to view watchlist. Click on any ticker or stock name for detailed market intelligence report for that stock. to view watchlist. Click on any ticker or stock name for detailed market intelligence report for that stock. |
12Stocks.com Performance of Stocks in Smallcap Index
| Ticker | Stock Name | Watchlist | Category | Recent Price | Smart Investing & Trading Score | Change % | YTD Change% |
| LUMN | Lumen |   | Technology | 1.28 | 10 | -1.54% | -29.86% |
| PMVP | PMV | | Health Care | 2.17 | 95 | -0.46% | -30.00% |
| BBAI | BigBear.ai | | Technology | 1.49 | 15 | 0.68% | -30.05% |
| CBRL | Cracker Barrel | | Services & Goods | 53.90 | 0 | 0.47% | -30.07% |
| VLY | Valley National | | Financials | 7.59 | 32 | -0.59% | -30.16% |
| CALX | Calix | | Technology | 30.50 | 74 | 1.33% | -30.19% |
| AAN | Aaron s | | Transports | 7.56 | 74 | 3.85% | -30.51% |
| OOMA | Ooma | | Technology | 7.45 | 67 | 8.28% | -30.57% |
| ONEW | OneWater Marine | | Services & Goods | 23.33 | 52 | 1.86% | -30.96% |
| BMBL | Bumble | | Technology | 10.26 | 43 | -0.39% | -30.96% |
| LUNG | Pulmonx | | Health Care | 8.80 | 30 | -7.66% | -30.98% |
| IKNA | Ikena Oncology | | Health Care | 1.38 | 47 | -2.13% | -31.00% |
| HBIO | Harvard Bioscience | | Health Care | 3.69 | 17 | -1.60% | -31.03% |
| GH | Guardant Health | | Health Care | 18.65 | 42 | -1.01% | -31.05% |
| BIGC | BigCommerce | | Technology | 6.70 | 62 | -3.53% | -31.26% |
| TBI | TrueBlue | | Services & Goods | 10.54 | 45 | -0.19% | -31.29% |
| BBIO | BridgeBio Pharma | | Health Care | 27.73 | 40 | -0.20% | -31.30% |
| GWH | ESS Tech | | Industrials | 0.78 | 37 | -14.98% | -31.49% |
| RIGL | Rigel | | Health Care | 0.99 | 0 | -16.61% | -31.56% |
| HOFT | Hooker Furniture | | Consumer Staples | 17.80 | 42 | 0.88% | -31.77% |
| AMPH | Amphastar | | Health Care | 42.19 | 40 | -1.36% | -31.79% |
| CTKB | Cytek Biosciences | | Health Care | 6.26 | 50 | -1.80% | -31.87% |
| TUSK | Mammoth Energy | | Energy | 3.02 | 17 | 2.03% | -32.29% |
| FOXF | Fox Factory | | Consumer Staples | 45.68 | 74 | 4.53% | -32.31% |
| UDMY | Udemy | | Consumer Staples | 10.07 | 25 | -0.10% | -32.33% |


| Too many stocks? View smallcap stocks filtered by marketcap & sector |
| Marketcap: All SmallCap Stocks (default-no microcap), Large, Mid-Range, Small |
| Smallcap Sector: Tech, Finance, Energy, Staples, Retail, Industrial, Materials, & Medical |
|
Get the most comprehensive stock market coverage daily at 12Stocks.com ➞ Best Stocks Today ➞ Best Stocks Weekly ➞ Best Stocks Year-to-Date ➞ Best Stocks Trends ➞  Best Stocks Today 12Stocks.com Best Nasdaq Stocks ➞ Best S&P 500 Stocks ➞ Best Tech Stocks ➞ Best Biotech Stocks ➞ |
| Detailed Overview of SmallCap Stocks |
| SmallCap Technical Overview, Leaders & Laggards, Top SmallCap ETF Funds & Detailed SmallCap Stocks List, Charts, Trends & More |
| Smallcap: Technical Analysis, Trends & YTD Performance | |
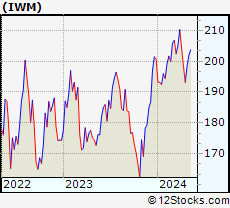
| SmallCap segment as represented by
IWM, an exchange-traded fund [ETF], holds basket of thousands of smallcap stocks from across all major sectors of the US stock market. The smallcap index (contains stocks like Riverbed & Sotheby's) is up by 1.53% and is currently underperforming the overall market by -6.51% year-to-date. Below is a quick view of technical charts and trends: | |
 IWM Weekly Chart |
|
| Long Term Trend: Very Good | |
| Medium Term Trend: Very Good | |
 IWM Daily Chart |
|
| Short Term Trend: Good | |
| Overall Trend Score: 70 | |
| YTD Performance: 1.53% | |
| **Trend Scores & Views Are Only For Educational Purposes And Not For Investing | |
| 12Stocks.com: Top Performing Small Cap Index Stocks | ||||||||||||||||||||||||||||||||||||||||||||||||
 The top performing Small Cap Index stocks year to date are
Now, more recently, over last week, the top performing Small Cap Index stocks on the move are


|
||||||||||||||||||||||||||||||||||||||||||||||||
| 12Stocks.com: Investing in Smallcap Index using Exchange Traded Funds | |
|
The following table shows list of key exchange traded funds (ETF) that
help investors track Smallcap index. The following list also includes leveraged ETF funds that track twice or thrice the daily returns of Smallcap indices. Short or inverse ETF funds move in the opposite direction to the index they track and are useful during market pullbacks or during bear markets. Quick View: Move mouse or cursor over ETF symbol (ticker) to view short-term technical chart and over ETF name to view long term chart. Click on ticker or stock name for detailed view. Click on to add stock symbol to your watchlist and to view watchlist. |
12Stocks.com List of ETFs that track Smallcap Index
| Ticker | ETF Name | Watchlist | Recent Price | Smart Investing & Trading Score | Change % | Week % | Year-to-date % |
| IWM | iShares Russell 2000 | | 203.78 | 70 | -0.58 | 0.93 | 1.53% |
| IJR | iShares Core S&P Small-Cap | | 108.26 | 88 | -0.33 | 1.05 | 0.01% |
| IWN | iShares Russell 2000 Value | | 155.37 | 88 | -0.17 | 0.75 | 0.03% |
| VTWO | Vanguard Russell 2000 ETF | | 82.40 | 57 | -0.53 | 0.97 | 1.6% |
| IWO | iShares Russell 2000 Growth | | 260.10 | 57 | -0.84 | 1.26 | 3.12% |
| IJS | iShares S&P Small-Cap 600 Value | | 99.80 | 70 | 0.12 | 1.09 | -3.17% |
| IJT | iShares S&P Small-Cap 600 Growth | | 129.03 | 83 | -0.62 | 0.99 | 3.11% |
| XSLV | PowerShares S&P SmallCap Low Volatil ETF | | 43.94 | 100 | -0.14 | 1.67 | -0.48% |
| SMLV | SPDR SSGA US Small Cap Low Volatil ETF | | 110.32 | 68 | -0.15 | 0.57 | -1.96% |
| SDD | ProShares UltraShort SmallCap600 | | 18.66 | 40 | 2.43 | -0.98 | 1.27% |
| SBB | ProShares Short SmallCap600 | | 16.08 | 38 | 0.69 | -0.5 | 0.94% |
| SAA | ProShares Ultra SmallCap600 | | 24.21 | 70 | -0.75 | 2.62 | -2.98% |
| 12Stocks.com: Charts, Trends, Fundamental Data and Performances of SmallCap Stocks | |
|
We now take in-depth look at all SmallCap stocks including charts, multi-period performances and overall trends (as measured by Smart Investing & Trading Score). One can sort SmallCap stocks (click link to choose) by Daily, Weekly and by Year-to-Date performances. Also, one can sort by size of the company or by market capitalization. |
| Select Your Default Chart Type: | |||||
| |||||
| Click on stock symbol or name for detailed view. Click on to add stock symbol to your watchlist and to view watchlist. Quick View: Move mouse or cursor over "Daily" to quickly view daily technical stock chart and over "Weekly" to view weekly technical stock chart. | |||||

 | LUMN Lumen Technologies, Inc. |
| Sector: Technology | |
| SubSector: Telecom Services - Domestic | |
| MarketCap: 1242 Millions | |
| Recent Price: 1.28 Smart Investing & Trading Score: 10 | |
| Day Percent Change: -1.54% Day Change: -0.02 | |
| Week Change: -3.03% Year-to-date Change: -29.9% | |
| LUMN Links: Profile News Message Board | |
| Charts:- Daily , Weekly | |
| Add LUMN to Watchlist: View: Get Complete LUMN Trend Analysis ➞ | |
 | PMVP PMV Pharmaceuticals, Inc. |
| Sector: Health Care | |
| SubSector: Biotechnology | |
| MarketCap: 20187 Millions | |
| Recent Price: 2.17 Smart Investing & Trading Score: 95 | |
| Day Percent Change: -0.46% Day Change: -0.01 | |
| Week Change: 9.87% Year-to-date Change: -30.0% | |
| PMVP Links: Profile News Message Board | |
| Charts:- Daily , Weekly | |
| Add PMVP to Watchlist: View: Get Complete PMVP Trend Analysis ➞ | |
 | BBAI BigBear.ai Holdings, Inc. |
| Sector: Technology | |
| SubSector: Information Technology Services | |
| MarketCap: 339 Millions | |
| Recent Price: 1.49 Smart Investing & Trading Score: 15 | |
| Day Percent Change: 0.68% Day Change: 0.01 | |
| Week Change: -0.33% Year-to-date Change: -30.1% | |
| BBAI Links: Profile News Message Board | |
| Charts:- Daily , Weekly | |
| Add BBAI to Watchlist: View: Get Complete BBAI Trend Analysis ➞ | |
 | CBRL Cracker Barrel Old Country Store, Inc. |
| Sector: Services & Goods | |
| SubSector: Restaurants | |
| MarketCap: 1839.6 Millions | |
| Recent Price: 53.90 Smart Investing & Trading Score: 0 | |
| Day Percent Change: 0.47% Day Change: 0.25 | |
| Week Change: -4.04% Year-to-date Change: -30.1% | |
| CBRL Links: Profile News Message Board | |
| Charts:- Daily , Weekly | |
| Add CBRL to Watchlist: View: Get Complete CBRL Trend Analysis ➞ | |
 | VLY Valley National Bancorp |
| Sector: Financials | |
| SubSector: Regional - Northeast Banks | |
| MarketCap: 2843.09 Millions | |
| Recent Price: 7.59 Smart Investing & Trading Score: 32 | |
| Day Percent Change: -0.59% Day Change: -0.04 | |
| Week Change: -1.88% Year-to-date Change: -30.2% | |
| VLY Links: Profile News Message Board | |
| Charts:- Daily , Weekly | |
| Add VLY to Watchlist: View: Get Complete VLY Trend Analysis ➞ | |
 | CALX Calix, Inc. |
| Sector: Technology | |
| SubSector: Communication Equipment | |
| MarketCap: 390.039 Millions | |
| Recent Price: 30.50 Smart Investing & Trading Score: 74 | |
| Day Percent Change: 1.33% Day Change: 0.40 | |
| Week Change: 3.18% Year-to-date Change: -30.2% | |
| CALX Links: Profile News Message Board | |
| Charts:- Daily , Weekly | |
| Add CALX to Watchlist: View: Get Complete CALX Trend Analysis ➞ | |
 | AAN Aaron s, Inc. |
| Sector: Transports | |
| SubSector: Rental & Leasing Services | |
| MarketCap: 1087.04 Millions | |
| Recent Price: 7.56 Smart Investing & Trading Score: 74 | |
| Day Percent Change: 3.85% Day Change: 0.28 | |
| Week Change: 8.78% Year-to-date Change: -30.5% | |
| AAN Links: Profile News Message Board | |
| Charts:- Daily , Weekly | |
| Add AAN to Watchlist: View: Get Complete AAN Trend Analysis ➞ | |
 | OOMA Ooma, Inc. |
| Sector: Technology | |
| SubSector: Diversified Communication Services | |
| MarketCap: 222.064 Millions | |
| Recent Price: 7.45 Smart Investing & Trading Score: 67 | |
| Day Percent Change: 8.28% Day Change: 0.57 | |
| Week Change: 3.04% Year-to-date Change: -30.6% | |
| OOMA Links: Profile News Message Board | |
| Charts:- Daily , Weekly | |
| Add OOMA to Watchlist: View: Get Complete OOMA Trend Analysis ➞ | |
 | ONEW OneWater Marine Inc. |
| Sector: Services & Goods | |
| SubSector: Recreational Vehicles | |
| MarketCap: 42027 Millions | |
| Recent Price: 23.33 Smart Investing & Trading Score: 52 | |
| Day Percent Change: 1.86% Day Change: 0.42 | |
| Week Change: 2.87% Year-to-date Change: -31.0% | |
| ONEW Links: Profile News Message Board | |
| Charts:- Daily , Weekly | |
| Add ONEW to Watchlist: View: Get Complete ONEW Trend Analysis ➞ | |
 | BMBL Bumble Inc. |
| Sector: Technology | |
| SubSector: Software - Application | |
| MarketCap: 2290 Millions | |
| Recent Price: 10.26 Smart Investing & Trading Score: 43 | |
| Day Percent Change: -0.39% Day Change: -0.04 | |
| Week Change: 2.19% Year-to-date Change: -31.0% | |
| BMBL Links: Profile News Message Board | |
| Charts:- Daily , Weekly | |
| Add BMBL to Watchlist: View: Get Complete BMBL Trend Analysis ➞ | |
 | LUNG Pulmonx Corporation |
| Sector: Health Care | |
| SubSector: Medical Devices | |
| MarketCap: 18187 Millions | |
| Recent Price: 8.80 Smart Investing & Trading Score: 30 | |
| Day Percent Change: -7.66% Day Change: -0.73 | |
| Week Change: -10.39% Year-to-date Change: -31.0% | |
| LUNG Links: Profile News Message Board | |
| Charts:- Daily , Weekly | |
| Add LUNG to Watchlist: View: Get Complete LUNG Trend Analysis ➞ | |
 | IKNA Ikena Oncology, Inc. |
| Sector: Health Care | |
| SubSector: Biotechnology | |
| MarketCap: 277 Millions | |
| Recent Price: 1.38 Smart Investing & Trading Score: 47 | |
| Day Percent Change: -2.13% Day Change: -0.03 | |
| Week Change: 3.37% Year-to-date Change: -31.0% | |
| IKNA Links: Profile News Message Board | |
| Charts:- Daily , Weekly | |
| Add IKNA to Watchlist: View: Get Complete IKNA Trend Analysis ➞ | |
 | HBIO Harvard Bioscience, Inc. |
| Sector: Health Care | |
| SubSector: Medical Instruments & Supplies | |
| MarketCap: 63.086 Millions | |
| Recent Price: 3.69 Smart Investing & Trading Score: 17 | |
| Day Percent Change: -1.60% Day Change: -0.06 | |
| Week Change: -4.16% Year-to-date Change: -31.0% | |
| HBIO Links: Profile News Message Board | |
| Charts:- Daily , Weekly | |
| Add HBIO to Watchlist: View: Get Complete HBIO Trend Analysis ➞ | |
 | GH Guardant Health, Inc. |
| Sector: Health Care | |
| SubSector: Medical Laboratories & Research | |
| MarketCap: 5678.7 Millions | |
| Recent Price: 18.65 Smart Investing & Trading Score: 42 | |
| Day Percent Change: -1.01% Day Change: -0.19 | |
| Week Change: -1.22% Year-to-date Change: -31.1% | |
| GH Links: Profile News Message Board | |
| Charts:- Daily , Weekly | |
| Add GH to Watchlist: View: Get Complete GH Trend Analysis ➞ | |
 | BIGC BigCommerce Holdings, Inc. |
| Sector: Technology | |
| SubSector: Software Application | |
| MarketCap: 47587 Millions | |
| Recent Price: 6.70 Smart Investing & Trading Score: 62 | |
| Day Percent Change: -3.53% Day Change: -0.25 | |
| Week Change: 12.33% Year-to-date Change: -31.3% | |
| BIGC Links: Profile News Message Board | |
| Charts:- Daily , Weekly | |
| Add BIGC to Watchlist: View: Get Complete BIGC Trend Analysis ➞ | |
 | TBI TrueBlue, Inc. |
| Sector: Services & Goods | |
| SubSector: Staffing & Outsourcing Services | |
| MarketCap: 563.228 Millions | |
| Recent Price: 10.54 Smart Investing & Trading Score: 45 | |
| Day Percent Change: -0.19% Day Change: -0.02 | |
| Week Change: -0.28% Year-to-date Change: -31.3% | |
| TBI Links: Profile News Message Board | |
| Charts:- Daily , Weekly | |
| Add TBI to Watchlist: View: Get Complete TBI Trend Analysis ➞ | |
 | BBIO BridgeBio Pharma, Inc. |
| Sector: Health Care | |
| SubSector: Biotechnology | |
| MarketCap: 3879.35 Millions | |
| Recent Price: 27.73 Smart Investing & Trading Score: 40 | |
| Day Percent Change: -0.20% Day Change: -0.05 | |
| Week Change: -0.34% Year-to-date Change: -31.3% | |
| BBIO Links: Profile News Message Board | |
| Charts:- Daily , Weekly | |
| Add BBIO to Watchlist: View: Get Complete BBIO Trend Analysis ➞ | |
 | GWH ESS Tech, Inc. |
| Sector: Industrials | |
| SubSector: Electrical Equipment & Parts | |
| MarketCap: 239 Millions | |
| Recent Price: 0.78 Smart Investing & Trading Score: 37 | |
| Day Percent Change: -14.98% Day Change: -0.14 | |
| Week Change: -3.85% Year-to-date Change: -31.5% | |
| GWH Links: Profile News Message Board | |
| Charts:- Daily , Weekly | |
| Add GWH to Watchlist: View: Get Complete GWH Trend Analysis ➞ | |
 | RIGL Rigel Pharmaceuticals, Inc. |
| Sector: Health Care | |
| SubSector: Biotechnology | |
| MarketCap: 256.585 Millions | |
| Recent Price: 0.99 Smart Investing & Trading Score: 0 | |
| Day Percent Change: -16.61% Day Change: -0.20 | |
| Week Change: -17.3% Year-to-date Change: -31.6% | |
| RIGL Links: Profile News Message Board | |
| Charts:- Daily , Weekly | |
| Add RIGL to Watchlist: View: Get Complete RIGL Trend Analysis ➞ | |
 | HOFT Hooker Furniture Corporation |
| Sector: Consumer Staples | |
| SubSector: Home Furnishings & Fixtures | |
| MarketCap: 173.235 Millions | |
| Recent Price: 17.80 Smart Investing & Trading Score: 42 | |
| Day Percent Change: 0.88% Day Change: 0.16 | |
| Week Change: 1.11% Year-to-date Change: -31.8% | |
| HOFT Links: Profile News Message Board | |
| Charts:- Daily , Weekly | |
| Add HOFT to Watchlist: View: Get Complete HOFT Trend Analysis ➞ | |
 | AMPH Amphastar Pharmaceuticals, Inc. |
| Sector: Health Care | |
| SubSector: Drug Manufacturers - Other | |
| MarketCap: 655.533 Millions | |
| Recent Price: 42.19 Smart Investing & Trading Score: 40 | |
| Day Percent Change: -1.36% Day Change: -0.58 | |
| Week Change: -0.64% Year-to-date Change: -31.8% | |
| AMPH Links: Profile News Message Board | |
| Charts:- Daily , Weekly | |
| Add AMPH to Watchlist: View: Get Complete AMPH Trend Analysis ➞ | |
 | CTKB Cytek Biosciences, Inc. |
| Sector: Health Care | |
| SubSector: Medical Devices | |
| MarketCap: 1140 Millions | |
| Recent Price: 6.26 Smart Investing & Trading Score: 50 | |
| Day Percent Change: -1.80% Day Change: -0.12 | |
| Week Change: 1.05% Year-to-date Change: -31.9% | |
| CTKB Links: Profile News Message Board | |
| Charts:- Daily , Weekly | |
| Add CTKB to Watchlist: View: Get Complete CTKB Trend Analysis ➞ | |
 | TUSK Mammoth Energy Services, Inc. |
| Sector: Energy | |
| SubSector: Oil & Gas Drilling & Exploration | |
| MarketCap: 59.5139 Millions | |
| Recent Price: 3.02 Smart Investing & Trading Score: 17 | |
| Day Percent Change: 2.03% Day Change: 0.06 | |
| Week Change: -1.95% Year-to-date Change: -32.3% | |
| TUSK Links: Profile News Message Board | |
| Charts:- Daily , Weekly | |
| Add TUSK to Watchlist: View: Get Complete TUSK Trend Analysis ➞ | |
 | FOXF Fox Factory Holding Corp. |
| Sector: Consumer Staples | |
| SubSector: Recreational Vehicles | |
| MarketCap: 2093.29 Millions | |
| Recent Price: 45.68 Smart Investing & Trading Score: 74 | |
| Day Percent Change: 4.53% Day Change: 1.98 | |
| Week Change: 4.96% Year-to-date Change: -32.3% | |
| FOXF Links: Profile News Message Board | |
| Charts:- Daily , Weekly | |
| Add FOXF to Watchlist: View: Get Complete FOXF Trend Analysis ➞ | |
 | UDMY Udemy, Inc. |
| Sector: Consumer Staples | |
| SubSector: Education & Training Services | |
| MarketCap: 1570 Millions | |
| Recent Price: 10.07 Smart Investing & Trading Score: 25 | |
| Day Percent Change: -0.10% Day Change: -0.01 | |
| Week Change: -5.76% Year-to-date Change: -32.3% | |
| UDMY Links: Profile News Message Board | |
| Charts:- Daily , Weekly | |
| Add UDMY to Watchlist: View: Get Complete UDMY Trend Analysis ➞ | |
| Too many stocks? View smallcap stocks filtered by marketcap & sector |
| Marketcap: All SmallCap Stocks (default-no microcap), Large, Mid-Range, Small & MicroCap |
| Sector: Tech, Finance, Energy, Staples, Retail, Industrial, Materials, Utilities & Medical |
|
Best Stocks Today 12Stocks.com |
© 2024 12Stocks.com Terms & Conditions Privacy Contact Us
All Information Provided Only For Education And Not To Be Used For Investing or Trading. See Terms & Conditions


One More Thing ... Get Best Stocks Delivered Daily!
Never Ever Miss A Move With Our Top Ten Stocks Lists
Find Best Stocks In Any Market - Bull or Bear Market
Take A Peek At Our Top Ten Stocks Lists: Daily, Weekly, Year-to-Date & Top Trends
Find Best Stocks In Any Market - Bull or Bear Market
Take A Peek At Our Top Ten Stocks Lists: Daily, Weekly, Year-to-Date & Top Trends
Smallcap Stocks With Best Up Trends [0-bearish to 100-bullish]: Innodata [100], Cricut [100], DASAN Zhone[100], Latham Group[100], Hyster-Yale Materials[100], Myriad Genetics[100], Ameresco [100], Alpha and[100], Vigil Neuroscience[100], Hannon Armstrong[100], Ardmore Shipping[100]
Best Smallcap Stocks Year-to-Date:
CareMax [580.41%], Janux [415.82%], Viking [329.77%], Bakkt [295.29%], Longboard [255.4%], Alpine Immune[239.73%], Vera [190.25%], Super Micro[189.4%], Avidity Biosciences[188.27%], Cullinan Oncology[172%], Arcutis Bio[147.06%] Best Smallcap Stocks This Week:
DASAN Zhone[64.32%], Innodata [55.88%], Perficient [52.92%], Cricut [42.32%], Vigil Neuroscience[39.52%], Thoughtworks Holding[36.89%], Latham Group[35.9%], Great Lakes[32.18%], Bakkt [31.96%], Outset Medical[31.95%], P3 Health[27.95%] Best Smallcap Stocks Daily:
Innodata [55.42%], Cricut [47.47%], DASAN Zhone[30.11%], Latham Group[24.08%], Hyster-Yale Materials[23.55%], iRobot [21.40%], Myriad Genetics[21.13%], Ameresco [21.13%], Bakkt [20.92%], Alpha and[20.78%], Vigil Neuroscience[18.97%]