
 Login Sign Up


| |||||
 |  | ||||

| 12Stocks.com Market Intelligence |
Best SmallCap Stocks
|
| In a hurry? Small Cap Stock Lists: Performance Trends Table, Stock Charts
Sort Small Cap stocks: Daily, Weekly, Year-to-Date, Market Cap & Trends. Filter Small Cap stocks list by sector: Show all, Tech, Finance, Energy, Staples, Retail, Industrial, Materials, Utilities and HealthCare Filter Small Cap stocks list by size: All Large Medium Small and MicroCap |
| 12Stocks.com Small Cap Stocks Performances & Trends Daily | |||||||||
|
|  The overall Smart Investing & Trading Score is 70 (0-bearish to 100-bullish) which puts Small Cap index in short term neutral to bullish trend. The Smart Investing & Trading Score from previous trading session is 87 and hence a deterioration of trend.
| ||||||||
Here are the Smart Investing & Trading Scores of the most requested small cap stocks at 12Stocks.com (click stock name for detailed review):
|


| 12Stocks.com: Investing in Smallcap Index with Stocks | |
|
The following table helps investors and traders sort through current performance and trends (as measured by Smart Investing & Trading Score) of various
stocks in the Smallcap Index. Quick View: Move mouse or cursor over stock symbol (ticker) to view short-term technical chart and over stock name to view long term chart. Click on  to add stock symbol to your watchlist and to add stock symbol to your watchlist and  to view watchlist. Click on any ticker or stock name for detailed market intelligence report for that stock. to view watchlist. Click on any ticker or stock name for detailed market intelligence report for that stock. |
12Stocks.com Performance of Stocks in Smallcap Index
| Ticker | Stock Name | Watchlist | Category | Recent Price | Smart Investing & Trading Score | Change % | YTD Change% |
| GIII | G-III Apparel |   | Consumer Staples | 27.83 | 25 | -2.01% | -18.10% |
| BOH | Bank of Hawaii | | Financials | 59.31 | 62 | 0.68% | -18.15% |
| ARL | American Realty | | Financials | 14.25 | 42 | 1.14% | -18.15% |
| IHRT | iHeartMedia | | Services & Goods | 2.19 | 57 | -3.96% | -18.16% |
| ETNB | 89bio | | Health Care | 9.14 | 57 | -2.56% | -18.17% |
| FENC | Fennec | | Health Care | 9.18 | 18 | -1.92% | -18.18% |
| UTMD | Utah Medical | | Health Care | 68.88 | 67 | -0.85% | -18.21% |
| RMBS | Rambus | | Technology | 55.81 | 43 | -0.94% | -18.23% |
| FLWS | 1-800-FLOWERS.COM | | Services & Goods | 8.81 | 10 | 0.23% | -18.27% |
| LZ | LegalZoom.com | | Industrials | 9.28 | 0 | -23.91% | -18.32% |
| HELE | Helen of Troy | | Consumer Staples | 98.61 | 42 | 0.57% | -18.38% |
| BBCP | Concrete Pumping | | Industrials | 6.69 | 32 | 0.90% | -18.41% |
| TITN | Titan Machinery | | Services & Goods | 23.56 | 60 | 0.94% | -18.42% |
| RMR | RMR Group | | Financials | 23.03 | 15 | -3.32% | -18.42% |
| EVLV | Evolv | | Industrials | 3.85 | 46 | -0.77% | -18.43% |
| BCBP | BCB Bancorp | | Financials | 10.48 | 74 | 0.87% | -18.44% |
| PRLB | Proto Labs | | Industrials | 31.77 | 35 | 0.95% | -18.45% |
| EWCZ | European Wax | | Consumer Staples | 11.04 | 10 | -2.30% | -18.46% |
| EVBN | Evans Bancorp | | Financials | 25.70 | 42 | 0.45% | -18.47% |
| PAX | Patria s | | Financials | 12.79 | 25 | -0.85% | -18.48% |
| NAPA | Duckhorn Portfolio | | Consumer Staples | 8.02 | 42 | -0.37% | -18.50% |
| IBTX | Independent Bank | | Financials | 41.45 | 59 | 1.77% | -18.53% |
| HLLY | Holley | | Services & Goods | 4.04 | 42 | -3.00% | -18.53% |
| PLOW | Douglas Dynamics | | Consumer Staples | 24.18 | 74 | 1.49% | -18.55% |
| SASR | Sandy Spring | | Financials | 22.18 | 42 | 2.73% | -18.58% |


| Too many stocks? View smallcap stocks filtered by marketcap & sector |
| Marketcap: All SmallCap Stocks (default-no microcap), Large, Mid-Range, Small |
| Smallcap Sector: Tech, Finance, Energy, Staples, Retail, Industrial, Materials, & Medical |
|
Get the most comprehensive stock market coverage daily at 12Stocks.com ➞ Best Stocks Today ➞ Best Stocks Weekly ➞ Best Stocks Year-to-Date ➞ Best Stocks Trends ➞  Best Stocks Today 12Stocks.com Best Nasdaq Stocks ➞ Best S&P 500 Stocks ➞ Best Tech Stocks ➞ Best Biotech Stocks ➞ |
| Detailed Overview of SmallCap Stocks |
| SmallCap Technical Overview, Leaders & Laggards, Top SmallCap ETF Funds & Detailed SmallCap Stocks List, Charts, Trends & More |
| Smallcap: Technical Analysis, Trends & YTD Performance | |
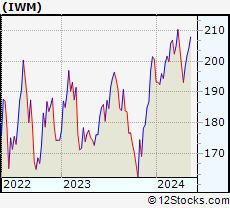
| SmallCap segment as represented by
IWM, an exchange-traded fund [ETF], holds basket of thousands of smallcap stocks from across all major sectors of the US stock market. The smallcap index (contains stocks like Riverbed & Sotheby's) is up by 1.45% and is currently underperforming the overall market by -6.57% year-to-date. Below is a quick view of technical charts and trends: | |
 IWM Weekly Chart |
|
| Long Term Trend: Deteriorating | |
| Medium Term Trend: Very Good | |
 IWM Daily Chart |
|
| Short Term Trend: Good | |
| Overall Trend Score: 70 | |
| YTD Performance: 1.45% | |
| **Trend Scores & Views Are Only For Educational Purposes And Not For Investing | |
| 12Stocks.com: Top Performing Small Cap Index Stocks | ||||||||||||||||||||||||||||||||||||||||||||||||
 The top performing Small Cap Index stocks year to date are
Now, more recently, over last week, the top performing Small Cap Index stocks on the move are


|
||||||||||||||||||||||||||||||||||||||||||||||||
| 12Stocks.com: Investing in Smallcap Index using Exchange Traded Funds | |
|
The following table shows list of key exchange traded funds (ETF) that
help investors track Smallcap index. The following list also includes leveraged ETF funds that track twice or thrice the daily returns of Smallcap indices. Short or inverse ETF funds move in the opposite direction to the index they track and are useful during market pullbacks or during bear markets. Quick View: Move mouse or cursor over ETF symbol (ticker) to view short-term technical chart and over ETF name to view long term chart. Click on ticker or stock name for detailed view. Click on to add stock symbol to your watchlist and to view watchlist. |
12Stocks.com List of ETFs that track Smallcap Index
| Ticker | ETF Name | Watchlist | Recent Price | Smart Investing & Trading Score | Change % | Week % | Year-to-date % |
| IWM | iShares Russell 2000 | | 203.62 | 70 | -0.66 | 0.85 | 1.45% |
| IJR | iShares Core S&P Small-Cap | | 108.15 | 58 | -0.44 | 0.95 | -0.1% |
| IWN | iShares Russell 2000 Value | | 155.08 | 76 | -0.35 | 0.56 | -0.16% |
| VTWO | Vanguard Russell 2000 ETF | | 82.27 | 57 | -0.69 | 0.81 | 1.44% |
| IWO | iShares Russell 2000 Growth | | 259.82 | 57 | -0.95 | 1.15 | 3.01% |
| IJS | iShares S&P Small-Cap 600 Value | | 99.06 | 40 | -0.62 | 0.34 | -3.89% |
| IJT | iShares S&P Small-Cap 600 Growth | | 128.54 | 71 | -1.00 | 0.61 | 2.72% |
| XSLV | PowerShares S&P SmallCap Low Volatil ETF | | 43.77 | 95 | -0.52 | 1.27 | -0.86% |
| SDD | ProShares UltraShort SmallCap600 | | 18.66 | 40 | 2.43 | -0.98 | 1.27% |
| SMLV | SPDR SSGA US Small Cap Low Volatil ETF | | 109.87 | 63 | -0.55 | 0.17 | -2.36% |
| SBB | ProShares Short SmallCap600 | | 16.11 | 25 | 0.91 | -0.28 | 1.16% |
| SAA | ProShares Ultra SmallCap600 | | 24.21 | 70 | -0.75 | 2.62 | -2.98% |
| 12Stocks.com: Charts, Trends, Fundamental Data and Performances of SmallCap Stocks | |
|
We now take in-depth look at all SmallCap stocks including charts, multi-period performances and overall trends (as measured by Smart Investing & Trading Score). One can sort SmallCap stocks (click link to choose) by Daily, Weekly and by Year-to-Date performances. Also, one can sort by size of the company or by market capitalization. |
| Select Your Default Chart Type: | |||||
| |||||
| Click on stock symbol or name for detailed view. Click on to add stock symbol to your watchlist and to view watchlist. Quick View: Move mouse or cursor over "Daily" to quickly view daily technical stock chart and over "Weekly" to view weekly technical stock chart. | |||||

 | GIII G-III Apparel Group, Ltd. |
| Sector: Consumer Staples | |
| SubSector: Textile - Apparel Clothing | |
| MarketCap: 354.365 Millions | |
| Recent Price: 27.83 Smart Investing & Trading Score: 25 | |
| Day Percent Change: -2.01% Day Change: -0.57 | |
| Week Change: -2.66% Year-to-date Change: -18.1% | |
| GIII Links: Profile News Message Board | |
| Charts:- Daily , Weekly | |
| Add GIII to Watchlist: View: Get Complete GIII Trend Analysis ➞ | |
 | BOH Bank of Hawaii Corporation |
| Sector: Financials | |
| SubSector: Regional - Pacific Banks | |
| MarketCap: 2305.19 Millions | |
| Recent Price: 59.31 Smart Investing & Trading Score: 62 | |
| Day Percent Change: 0.68% Day Change: 0.40 | |
| Week Change: 0.76% Year-to-date Change: -18.2% | |
| BOH Links: Profile News Message Board | |
| Charts:- Daily , Weekly | |
| Add BOH to Watchlist: View: Get Complete BOH Trend Analysis ➞ | |
 | ARL American Realty Investors, Inc. |
| Sector: Financials | |
| SubSector: Property Management | |
| MarketCap: 132.242 Millions | |
| Recent Price: 14.25 Smart Investing & Trading Score: 42 | |
| Day Percent Change: 1.14% Day Change: 0.16 | |
| Week Change: 4.7% Year-to-date Change: -18.2% | |
| ARL Links: Profile News Message Board | |
| Charts:- Daily , Weekly | |
| Add ARL to Watchlist: View: Get Complete ARL Trend Analysis ➞ | |
 | IHRT iHeartMedia, Inc. |
| Sector: Services & Goods | |
| SubSector: Broadcasting - Radio | |
| MarketCap: 694 Millions | |
| Recent Price: 2.19 Smart Investing & Trading Score: 57 | |
| Day Percent Change: -3.96% Day Change: -0.09 | |
| Week Change: -2.89% Year-to-date Change: -18.2% | |
| IHRT Links: Profile News Message Board | |
| Charts:- Daily , Weekly | |
| Add IHRT to Watchlist: View: Get Complete IHRT Trend Analysis ➞ | |
 | ETNB 89bio, Inc. |
| Sector: Health Care | |
| SubSector: Biotechnology | |
| MarketCap: 517.485 Millions | |
| Recent Price: 9.14 Smart Investing & Trading Score: 57 | |
| Day Percent Change: -2.56% Day Change: -0.24 | |
| Week Change: -0.87% Year-to-date Change: -18.2% | |
| ETNB Links: Profile News Message Board | |
| Charts:- Daily , Weekly | |
| Add ETNB to Watchlist: View: Get Complete ETNB Trend Analysis ➞ | |
 | FENC Fennec Pharmaceuticals Inc. |
| Sector: Health Care | |
| SubSector: Biotechnology | |
| MarketCap: 126.785 Millions | |
| Recent Price: 9.18 Smart Investing & Trading Score: 18 | |
| Day Percent Change: -1.92% Day Change: -0.18 | |
| Week Change: -0.54% Year-to-date Change: -18.2% | |
| FENC Links: Profile News Message Board | |
| Charts:- Daily , Weekly | |
| Add FENC to Watchlist: View: Get Complete FENC Trend Analysis ➞ | |
 | UTMD Utah Medical Products, Inc. |
| Sector: Health Care | |
| SubSector: Medical Instruments & Supplies | |
| MarketCap: 285.86 Millions | |
| Recent Price: 68.88 Smart Investing & Trading Score: 67 | |
| Day Percent Change: -0.85% Day Change: -0.59 | |
| Week Change: 1.41% Year-to-date Change: -18.2% | |
| UTMD Links: Profile News Message Board | |
| Charts:- Daily , Weekly | |
| Add UTMD to Watchlist: View: Get Complete UTMD Trend Analysis ➞ | |
 | RMBS Rambus Inc. |
| Sector: Technology | |
| SubSector: Semiconductor- Memory Chips | |
| MarketCap: 1296 Millions | |
| Recent Price: 55.81 Smart Investing & Trading Score: 43 | |
| Day Percent Change: -0.94% Day Change: -0.53 | |
| Week Change: -0.48% Year-to-date Change: -18.2% | |
| RMBS Links: Profile News Message Board | |
| Charts:- Daily , Weekly | |
| Add RMBS to Watchlist: View: Get Complete RMBS Trend Analysis ➞ | |
 | FLWS 1-800-FLOWERS.COM, Inc. |
| Sector: Services & Goods | |
| SubSector: Specialty Retail, Other | |
| MarketCap: 940 Millions | |
| Recent Price: 8.81 Smart Investing & Trading Score: 10 | |
| Day Percent Change: 0.23% Day Change: 0.02 | |
| Week Change: -1.01% Year-to-date Change: -18.3% | |
| FLWS Links: Profile News Message Board | |
| Charts:- Daily , Weekly | |
| Add FLWS to Watchlist: View: Get Complete FLWS Trend Analysis ➞ | |
 | LZ LegalZoom.com, Inc. |
| Sector: Industrials | |
| SubSector: Specialty Business Services | |
| MarketCap: 2330 Millions | |
| Recent Price: 9.28 Smart Investing & Trading Score: 0 | |
| Day Percent Change: -23.91% Day Change: -2.91 | |
| Week Change: -23.03% Year-to-date Change: -18.3% | |
| LZ Links: Profile News Message Board | |
| Charts:- Daily , Weekly | |
| Add LZ to Watchlist: View: Get Complete LZ Trend Analysis ➞ | |
 | HELE Helen of Troy Limited |
| Sector: Consumer Staples | |
| SubSector: Housewares & Accessories | |
| MarketCap: 3199.53 Millions | |
| Recent Price: 98.61 Smart Investing & Trading Score: 42 | |
| Day Percent Change: 0.57% Day Change: 0.56 | |
| Week Change: 2.14% Year-to-date Change: -18.4% | |
| HELE Links: Profile News Message Board | |
| Charts:- Daily , Weekly | |
| Add HELE to Watchlist: View: Get Complete HELE Trend Analysis ➞ | |
 | BBCP Concrete Pumping Holdings, Inc. |
| Sector: Industrials | |
| SubSector: General Building Materials | |
| MarketCap: 263.653 Millions | |
| Recent Price: 6.69 Smart Investing & Trading Score: 32 | |
| Day Percent Change: 0.90% Day Change: 0.06 | |
| Week Change: -1.18% Year-to-date Change: -18.4% | |
| BBCP Links: Profile News Message Board | |
| Charts:- Daily , Weekly | |
| Add BBCP to Watchlist: View: Get Complete BBCP Trend Analysis ➞ | |
 | TITN Titan Machinery Inc. |
| Sector: Services & Goods | |
| SubSector: Industrial Equipment Wholesale | |
| MarketCap: 208.958 Millions | |
| Recent Price: 23.56 Smart Investing & Trading Score: 60 | |
| Day Percent Change: 0.94% Day Change: 0.22 | |
| Week Change: 3.24% Year-to-date Change: -18.4% | |
| TITN Links: Profile News Message Board | |
| Charts:- Daily , Weekly | |
| Add TITN to Watchlist: View: Get Complete TITN Trend Analysis ➞ | |
 | RMR The RMR Group Inc. |
| Sector: Financials | |
| SubSector: Real Estate Development | |
| MarketCap: 797.419 Millions | |
| Recent Price: 23.03 Smart Investing & Trading Score: 15 | |
| Day Percent Change: -3.32% Day Change: -0.79 | |
| Week Change: -4.99% Year-to-date Change: -18.4% | |
| RMR Links: Profile News Message Board | |
| Charts:- Daily , Weekly | |
| Add RMR to Watchlist: View: Get Complete RMR Trend Analysis ➞ | |
 | EVLV Evolv Technologies Holdings, Inc. |
| Sector: Industrials | |
| SubSector: Security & Protection Services | |
| MarketCap: 853 Millions | |
| Recent Price: 3.85 Smart Investing & Trading Score: 46 | |
| Day Percent Change: -0.77% Day Change: -0.03 | |
| Week Change: -0.77% Year-to-date Change: -18.4% | |
| EVLV Links: Profile News Message Board | |
| Charts:- Daily , Weekly | |
| Add EVLV to Watchlist: View: Get Complete EVLV Trend Analysis ➞ | |
 | BCBP BCB Bancorp, Inc. |
| Sector: Financials | |
| SubSector: Regional - Northeast Banks | |
| MarketCap: 196.799 Millions | |
| Recent Price: 10.48 Smart Investing & Trading Score: 74 | |
| Day Percent Change: 0.87% Day Change: 0.09 | |
| Week Change: 6.72% Year-to-date Change: -18.4% | |
| BCBP Links: Profile News Message Board | |
| Charts:- Daily , Weekly | |
| Add BCBP to Watchlist: View: Get Complete BCBP Trend Analysis ➞ | |
 | PRLB Proto Labs, Inc. |
| Sector: Industrials | |
| SubSector: Machine Tools & Accessories | |
| MarketCap: 1944.78 Millions | |
| Recent Price: 31.77 Smart Investing & Trading Score: 35 | |
| Day Percent Change: 0.95% Day Change: 0.30 | |
| Week Change: 2.19% Year-to-date Change: -18.5% | |
| PRLB Links: Profile News Message Board | |
| Charts:- Daily , Weekly | |
| Add PRLB to Watchlist: View: Get Complete PRLB Trend Analysis ➞ | |
 | EWCZ European Wax Center, Inc. |
| Sector: Consumer Staples | |
| SubSector: Household & Personal Products | |
| MarketCap: 1180 Millions | |
| Recent Price: 11.04 Smart Investing & Trading Score: 10 | |
| Day Percent Change: -2.30% Day Change: -0.26 | |
| Week Change: -6.84% Year-to-date Change: -18.5% | |
| EWCZ Links: Profile News Message Board | |
| Charts:- Daily , Weekly | |
| Add EWCZ to Watchlist: View: Get Complete EWCZ Trend Analysis ➞ | |
 | EVBN Evans Bancorp, Inc. |
| Sector: Financials | |
| SubSector: Regional - Northeast Banks | |
| MarketCap: 124.899 Millions | |
| Recent Price: 25.70 Smart Investing & Trading Score: 42 | |
| Day Percent Change: 0.45% Day Change: 0.11 | |
| Week Change: 0.61% Year-to-date Change: -18.5% | |
| EVBN Links: Profile News Message Board | |
| Charts:- Daily , Weekly | |
| Add EVBN to Watchlist: View: Get Complete EVBN Trend Analysis ➞ | |
 | PAX Patria Investments Limited |
| Sector: Financials | |
| SubSector: Asset Management | |
| MarketCap: 2130 Millions | |
| Recent Price: 12.79 Smart Investing & Trading Score: 25 | |
| Day Percent Change: -0.85% Day Change: -0.11 | |
| Week Change: -0.31% Year-to-date Change: -18.5% | |
| PAX Links: Profile News Message Board | |
| Charts:- Daily , Weekly | |
| Add PAX to Watchlist: View: Get Complete PAX Trend Analysis ➞ | |
 | NAPA The Duckhorn Portfolio, Inc. |
| Sector: Consumer Staples | |
| SubSector: Beverages - Wineries & Distilleries | |
| MarketCap: 1500 Millions | |
| Recent Price: 8.02 Smart Investing & Trading Score: 42 | |
| Day Percent Change: -0.37% Day Change: -0.03 | |
| Week Change: 1.91% Year-to-date Change: -18.5% | |
| NAPA Links: Profile News Message Board | |
| Charts:- Daily , Weekly | |
| Add NAPA to Watchlist: View: Get Complete NAPA Trend Analysis ➞ | |
 | IBTX Independent Bank Group, Inc. |
| Sector: Financials | |
| SubSector: Regional - Southeast Banks | |
| MarketCap: 1133.35 Millions | |
| Recent Price: 41.45 Smart Investing & Trading Score: 59 | |
| Day Percent Change: 1.77% Day Change: 0.72 | |
| Week Change: 2.83% Year-to-date Change: -18.5% | |
| IBTX Links: Profile News Message Board | |
| Charts:- Daily , Weekly | |
| Add IBTX to Watchlist: View: Get Complete IBTX Trend Analysis ➞ | |
 | HLLY Holley Inc. |
| Sector: Services & Goods | |
| SubSector: Auto Parts | |
| MarketCap: 469 Millions | |
| Recent Price: 4.04 Smart Investing & Trading Score: 42 | |
| Day Percent Change: -3.00% Day Change: -0.13 | |
| Week Change: -1.34% Year-to-date Change: -18.5% | |
| HLLY Links: Profile News Message Board | |
| Charts:- Daily , Weekly | |
| Add HLLY to Watchlist: View: Get Complete HLLY Trend Analysis ➞ | |
 | PLOW Douglas Dynamics, Inc. |
| Sector: Consumer Staples | |
| SubSector: Auto Parts | |
| MarketCap: 654.739 Millions | |
| Recent Price: 24.18 Smart Investing & Trading Score: 74 | |
| Day Percent Change: 1.49% Day Change: 0.36 | |
| Week Change: 2.7% Year-to-date Change: -18.6% | |
| PLOW Links: Profile News Message Board | |
| Charts:- Daily , Weekly | |
| Add PLOW to Watchlist: View: Get Complete PLOW Trend Analysis ➞ | |
 | SASR Sandy Spring Bancorp, Inc. |
| Sector: Financials | |
| SubSector: Regional - Mid-Atlantic Banks | |
| MarketCap: 764.659 Millions | |
| Recent Price: 22.18 Smart Investing & Trading Score: 42 | |
| Day Percent Change: 2.73% Day Change: 0.59 | |
| Week Change: -0.27% Year-to-date Change: -18.6% | |
| SASR Links: Profile News Message Board | |
| Charts:- Daily , Weekly | |
| Add SASR to Watchlist: View: Get Complete SASR Trend Analysis ➞ | |
| Too many stocks? View smallcap stocks filtered by marketcap & sector |
| Marketcap: All SmallCap Stocks (default-no microcap), Large, Mid-Range, Small & MicroCap |
| Sector: Tech, Finance, Energy, Staples, Retail, Industrial, Materials, Utilities & Medical |
|
Best Stocks Today 12Stocks.com |
© 2024 12Stocks.com Terms & Conditions Privacy Contact Us
All Information Provided Only For Education And Not To Be Used For Investing or Trading. See Terms & Conditions


One More Thing ... Get Best Stocks Delivered Daily!
Never Ever Miss A Move With Our Top Ten Stocks Lists
Find Best Stocks In Any Market - Bull or Bear Market
Take A Peek At Our Top Ten Stocks Lists: Daily, Weekly, Year-to-Date & Top Trends
Find Best Stocks In Any Market - Bull or Bear Market
Take A Peek At Our Top Ten Stocks Lists: Daily, Weekly, Year-to-Date & Top Trends
Smallcap Stocks With Best Up Trends [0-bearish to 100-bullish]: Cricut [100], DASAN Zhone[100], Hyster-Yale Materials[100], Latham Group[100], Alpha and[100], Vigil Neuroscience[100], Myriad Genetics[100], Hannon Armstrong[100], Ardmore Shipping[100], Pacira BioSciences[100], Wolverine World[100]
Best Smallcap Stocks Year-to-Date:
CareMax [568.04%], Janux [398.37%], Viking [325.04%], Bakkt [273.09%], Longboard [253.85%], Alpine Immune[239.73%], Super Micro[190.86%], Avidity Biosciences[186.17%], Vera [183.88%], Cullinan Oncology[174.2%], Arcutis Bio[146.28%] Best Smallcap Stocks This Week:
DASAN Zhone[64.32%], Perficient [52.7%], Innodata [49.03%], Vigil Neuroscience[37.87%], Latham Group[37.73%], Cricut [37.35%], Thoughtworks Holding[34.67%], Children s[31.88%], Great Lakes[31.03%], Outset Medical[30.19%], Hyster-Yale Materials[26.56%] Best Smallcap Stocks Daily:
Innodata [48.59%], Cricut [42.31%], DASAN Zhone[30.11%], Hyster-Yale Materials[26.08%], Latham Group[25.75%], Ameresco [21.54%], Alpha and[20.06%], iRobot [19.18%], Vigil Neuroscience[17.55%], Myriad Genetics[17.09%], PowerSchool [16.53%]