
 Login Sign Up


| |||||
 |  | ||||

| 12Stocks.com Market Intelligence |
Best SmallCap Stocks
|
| In a hurry? Small Cap Stock Lists: Performance Trends Table, Stock Charts
Sort Small Cap stocks: Daily, Weekly, Year-to-Date, Market Cap & Trends. Filter Small Cap stocks list by sector: Show all, Tech, Finance, Energy, Staples, Retail, Industrial, Materials, Utilities and HealthCare Filter Small Cap stocks list by size: All Large Medium Small and MicroCap |
| 12Stocks.com Small Cap Stocks Performances & Trends Daily | |||||||||
|
|  The overall Smart Investing & Trading Score is 49 (0-bearish to 100-bullish) which puts Small Cap index in short term neutral trend. The Smart Investing & Trading Score from previous trading session is 14 and hence an improvement of trend.
| ||||||||
Here are the Smart Investing & Trading Scores of the most requested small cap stocks at 12Stocks.com (click stock name for detailed review):
|


| 12Stocks.com: Investing in Smallcap Index with Stocks | |
|
The following table helps investors and traders sort through current performance and trends (as measured by Smart Investing & Trading Score) of various
stocks in the Smallcap Index. Quick View: Move mouse or cursor over stock symbol (ticker) to view short-term technical chart and over stock name to view long term chart. Click on  to add stock symbol to your watchlist and to add stock symbol to your watchlist and  to view watchlist. Click on any ticker or stock name for detailed market intelligence report for that stock. to view watchlist. Click on any ticker or stock name for detailed market intelligence report for that stock. |
12Stocks.com Performance of Stocks in Smallcap Index
| Ticker | Stock Name | Watchlist | Category | Recent Price | Smart Investing & Trading Score | Change % | Weekly Change% |
| AMRC | Ameresco |   | Services & Goods | 21.45 | 93 | 4.69% | -0.14% |
| PWP | Perella Weinberg | | Financials | 15.28 | 63 | 1.70% | -0.23% |
| AKRO | Akero | | Health Care | 19.69 | 35 | -1.94% | -0.25% |
| RCUS | Arcus Biosciences | | Health Care | 15.50 | 24 | 0.00% | -0.32% |
| ACHR | Archer Aviation | | Industrials | 4.00 | 35 | 0.13% | -0.37% |
| LZB | La-Z-Boy | | Consumer Staples | 32.98 | 10 | 0.83% | -0.39% |
| PLAB | Photronics | | Technology | 28.16 | 42 | 4.65% | -0.42% |
| PRM | Perimeter Solutions | | Materials | 7.02 | 53 | 1.15% | -0.57% |
| WGO | Winnebago Industries | | Consumer Staples | 62.69 | 10 | 1.97% | -0.60% |
| KALU | Kaiser Aluminum | | Materials | 94.31 | 75 | 2.68% | -0.64% |
| GLNG | Golar LNG | | Transports | 24.93 | 68 | 1.47% | -0.68% |
| GABC | German American | | Financials | 32.02 | 68 | 1.07% | -0.71% |
| PGEN | Precigen | | Health Care | 1.40 | 0 | 0.00% | -0.71% |
| HY | Hyster-Yale Materials | | Consumer Staples | 58.25 | 0 | 0.83% | -0.73% |
| REZI | Resideo | | Services & Goods | 19.73 | 10 | 2.28% | -0.75% |
| STEM | Stem | | Technology | 1.81 | 47 | -1.89% | -0.82% |
| AROC | Archrock | | Energy | 20.03 | 56 | 2.72% | -0.84% |
| PETS | PetMed Express | | Health Care | 3.98 | 30 | 0.63% | -0.87% |
| SMP | Standard Motor | | Consumer Staples | 32.17 | 83 | -1.86% | -0.89% |
| PSFE | Paysafe | | Technology | 14.33 | 28 | 1.13% | -0.90% |
| WHD | Cactus | | Energy | 51.30 | 68 | 3.55% | -0.97% |
| CADE | Cadence Ban | | Financials | 28.73 | 88 | 1.77% | -1.00% |
| RVLV | Revolve Group | | Services & Goods | 19.61 | 32 | -0.51% | -1.01% |
| TRS | TriMas | | Industrials | 26.20 | 68 | 1.59% | -1.06% |
| MYPS | PLAYSTUDIOS | | Services & Goods | 2.22 | 20 | -0.67% | -1.11% |
| For chart view version of above stock list: Chart View ➞ 0 - 25 , 25 - 50 , 50 - 75 , 75 - 100 , 100 - 125 , 125 - 150 , 150 - 175 , 175 - 200 , 200 - 225 , 225 - 250 , 250 - 275 , 275 - 300 , 300 - 325 , 325 - 350 | ||
 | Click To Change The Sort Order: By Market Cap or Company Size Performance: Year-to-date, Week and Day |  |
| Too many stocks? View smallcap stocks filtered by marketcap & sector |
| Marketcap: All SmallCap Stocks (default-no microcap), Large, Mid-Range, Small |
| Smallcap Sector: Tech, Finance, Energy, Staples, Retail, Industrial, Materials, & Medical |
|
Get the most comprehensive stock market coverage daily at 12Stocks.com ➞ Best Stocks Today ➞ Best Stocks Weekly ➞ Best Stocks Year-to-Date ➞ Best Stocks Trends ➞  Best Stocks Today 12Stocks.com Best Nasdaq Stocks ➞ Best S&P 500 Stocks ➞ Best Tech Stocks ➞ Best Biotech Stocks ➞ |
| Detailed Overview of SmallCap Stocks |
| SmallCap Technical Overview, Leaders & Laggards, Top SmallCap ETF Funds & Detailed SmallCap Stocks List, Charts, Trends & More |
| Smallcap: Technical Analysis, Trends & YTD Performance | |
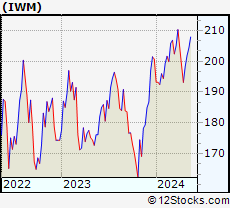
| SmallCap segment as represented by
IWM, an exchange-traded fund [ETF], holds basket of thousands of smallcap stocks from across all major sectors of the US stock market. The smallcap index (contains stocks like Riverbed & Sotheby's) is down by -0.39% and is currently underperforming the overall market by -6.01% year-to-date. Below is a quick view of technical charts and trends: | |
 IWM Weekly Chart |
|
| Long Term Trend: Not Good | |
| Medium Term Trend: Good | |
 IWM Daily Chart |
|
| Short Term Trend: Deteriorating | |
| Overall Trend Score: 49 | |
| YTD Performance: -0.39% | |
| **Trend Scores & Views Are Only For Educational Purposes And Not For Investing | |
| 12Stocks.com: Top Performing Small Cap Index Stocks | ||||||||||||||||||||||||||||||||||||||||||||||||
 The top performing Small Cap Index stocks year to date are
Now, more recently, over last week, the top performing Small Cap Index stocks on the move are


|
||||||||||||||||||||||||||||||||||||||||||||||||
| 12Stocks.com: Investing in Smallcap Index using Exchange Traded Funds | |
|
The following table shows list of key exchange traded funds (ETF) that
help investors track Smallcap index. The following list also includes leveraged ETF funds that track twice or thrice the daily returns of Smallcap indices. Short or inverse ETF funds move in the opposite direction to the index they track and are useful during market pullbacks or during bear markets. Quick View: Move mouse or cursor over ETF symbol (ticker) to view short-term technical chart and over ETF name to view long term chart. Click on ticker or stock name for detailed view. Click on to add stock symbol to your watchlist and to view watchlist. |
12Stocks.com List of ETFs that track Smallcap Index
| Ticker | ETF Name | Watchlist | Recent Price | Smart Investing & Trading Score | Change % | Week % | Year-to-date % |
| IWM | iShares Russell 2000 | | 199.92 | 49 | 1.84 | 0.77 | -0.39% |
| IJR | iShares Core S&P Small-Cap | | 106.33 | 50 | 1.52 | 0.64 | -1.77% |
| VTWO | Vanguard Russell 2000 ETF | | 80.83 | 7 | 1.85 | 0.76 | -0.33% |
| IWN | iShares Russell 2000 Value | | 152.88 | 57 | 2.04 | 1.15 | -1.58% |
| IWO | iShares Russell 2000 Growth | | 254.34 | 17 | 1.91 | 0.49 | 0.84% |
| IJS | iShares S&P Small-Cap 600 Value | | 98.02 | 13 | 1.68 | 0.85 | -4.9% |
| IJT | iShares S&P Small-Cap 600 Growth | | 126.47 | 20 | 1.22 | 0.3 | 1.06% |
| XSLV | PowerShares S&P SmallCap Low Volatil ETF | | 43.19 | 42 | 0.84 | 1.1 | -2.17% |
| SDD | ProShares UltraShort SmallCap600 | | 19.31 | 61 | -2.02 | -0.21 | 4.79% |
| SMLV | SPDR SSGA US Small Cap Low Volatil ETF | | 108.83 | 44 | 1.30 | 1.22 | -3.27% |
| SAA | ProShares Ultra SmallCap600 | | 22.93 | 32 | 1.56 | -0.46 | -8.08% |
| SBB | ProShares Short SmallCap600 | | 16.37 | 71 | -1.14 | -0.09 | 2.76% |
| 12Stocks.com: Charts, Trends, Fundamental Data and Performances of SmallCap Stocks | |
|
We now take in-depth look at all SmallCap stocks including charts, multi-period performances and overall trends (as measured by Smart Investing & Trading Score). One can sort SmallCap stocks (click link to choose) by Daily, Weekly and by Year-to-Date performances. Also, one can sort by size of the company or by market capitalization. |
| Select Your Default Chart Type: | |||||
| |||||
| Click on stock symbol or name for detailed view. Click on to add stock symbol to your watchlist and to view watchlist. Quick View: Move mouse or cursor over "Daily" to quickly view daily technical stock chart and over "Weekly" to view weekly technical stock chart. | |||||

 | AMRC Ameresco, Inc. |
| Sector: Services & Goods | |
| SubSector: Technical Services | |
| MarketCap: 898.91 Millions | |
| Recent Price: 21.45 Smart Investing & Trading Score: 93 | |
| Day Percent Change: 4.69% Day Change: 0.96 | |
| Week Change: -0.14% Year-to-date Change: -32.3% | |
| AMRC Links: Profile News Message Board | |
| Charts:- Daily , Weekly | |
| Add AMRC to Watchlist: View: Get Complete AMRC Trend Analysis ➞ | |
 | PWP Perella Weinberg Partners |
| Sector: Financials | |
| SubSector: Capital Markets | |
| MarketCap: 705 Millions | |
| Recent Price: 15.28 Smart Investing & Trading Score: 63 | |
| Day Percent Change: 1.70% Day Change: 0.26 | |
| Week Change: -0.23% Year-to-date Change: 23.7% | |
| PWP Links: Profile News Message Board | |
| Charts:- Daily , Weekly | |
| Add PWP to Watchlist: View: Get Complete PWP Trend Analysis ➞ | |
 | AKRO Akero Therapeutics, Inc. |
| Sector: Health Care | |
| SubSector: Biotechnology | |
| MarketCap: 675.085 Millions | |
| Recent Price: 19.69 Smart Investing & Trading Score: 35 | |
| Day Percent Change: -1.94% Day Change: -0.39 | |
| Week Change: -0.25% Year-to-date Change: -15.7% | |
| AKRO Links: Profile News Message Board | |
| Charts:- Daily , Weekly | |
| Add AKRO to Watchlist: View: Get Complete AKRO Trend Analysis ➞ | |
 | RCUS Arcus Biosciences, Inc. |
| Sector: Health Care | |
| SubSector: Biotechnology | |
| MarketCap: 539.285 Millions | |
| Recent Price: 15.50 Smart Investing & Trading Score: 24 | |
| Day Percent Change: 0.00% Day Change: 0.00 | |
| Week Change: -0.32% Year-to-date Change: -18.9% | |
| RCUS Links: Profile News Message Board | |
| Charts:- Daily , Weekly | |
| Add RCUS to Watchlist: View: Get Complete RCUS Trend Analysis ➞ | |
 | ACHR Archer Aviation Inc. |
| Sector: Industrials | |
| SubSector: Aerospace & Defense | |
| MarketCap: 976 Millions | |
| Recent Price: 4.00 Smart Investing & Trading Score: 35 | |
| Day Percent Change: 0.13% Day Change: 0.00 | |
| Week Change: -0.37% Year-to-date Change: -34.6% | |
| ACHR Links: Profile News Message Board | |
| Charts:- Daily , Weekly | |
| Add ACHR to Watchlist: View: Get Complete ACHR Trend Analysis ➞ | |
 | LZB La-Z-Boy Incorporated |
| Sector: Consumer Staples | |
| SubSector: Home Furnishings & Fixtures | |
| MarketCap: 951.635 Millions | |
| Recent Price: 32.98 Smart Investing & Trading Score: 10 | |
| Day Percent Change: 0.83% Day Change: 0.27 | |
| Week Change: -0.39% Year-to-date Change: -10.7% | |
| LZB Links: Profile News Message Board | |
| Charts:- Daily , Weekly | |
| Add LZB to Watchlist: View: Get Complete LZB Trend Analysis ➞ | |
 | PLAB Photronics, Inc. |
| Sector: Technology | |
| SubSector: Semiconductor Equipment & Materials | |
| MarketCap: 709.018 Millions | |
| Recent Price: 28.16 Smart Investing & Trading Score: 42 | |
| Day Percent Change: 4.65% Day Change: 1.25 | |
| Week Change: -0.42% Year-to-date Change: -10.2% | |
| PLAB Links: Profile News Message Board | |
| Charts:- Daily , Weekly | |
| Add PLAB to Watchlist: View: Get Complete PLAB Trend Analysis ➞ | |
 | PRM Perimeter Solutions, SA |
| Sector: Materials | |
| SubSector: Specialty Chemicals | |
| MarketCap: 930 Millions | |
| Recent Price: 7.02 Smart Investing & Trading Score: 53 | |
| Day Percent Change: 1.15% Day Change: 0.08 | |
| Week Change: -0.57% Year-to-date Change: 52.8% | |
| PRM Links: Profile News Message Board | |
| Charts:- Daily , Weekly | |
| Add PRM to Watchlist: View: Get Complete PRM Trend Analysis ➞ | |
 | WGO Winnebago Industries, Inc. |
| Sector: Consumer Staples | |
| SubSector: Recreational Vehicles | |
| MarketCap: 896.559 Millions | |
| Recent Price: 62.69 Smart Investing & Trading Score: 10 | |
| Day Percent Change: 1.97% Day Change: 1.21 | |
| Week Change: -0.6% Year-to-date Change: -14.0% | |
| WGO Links: Profile News Message Board | |
| Charts:- Daily , Weekly | |
| Add WGO to Watchlist: View: Get Complete WGO Trend Analysis ➞ | |
 | KALU Kaiser Aluminum Corporation |
| Sector: Materials | |
| SubSector: Aluminum | |
| MarketCap: 969.808 Millions | |
| Recent Price: 94.31 Smart Investing & Trading Score: 75 | |
| Day Percent Change: 2.68% Day Change: 2.46 | |
| Week Change: -0.64% Year-to-date Change: 32.5% | |
| KALU Links: Profile News Message Board | |
| Charts:- Daily , Weekly | |
| Add KALU to Watchlist: View: Get Complete KALU Trend Analysis ➞ | |
 | GLNG Golar LNG Limited |
| Sector: Transports | |
| SubSector: Shipping | |
| MarketCap: 854.414 Millions | |
| Recent Price: 24.93 Smart Investing & Trading Score: 68 | |
| Day Percent Change: 1.47% Day Change: 0.36 | |
| Week Change: -0.68% Year-to-date Change: 8.4% | |
| GLNG Links: Profile News Message Board | |
| Charts:- Daily , Weekly | |
| Add GLNG to Watchlist: View: Get Complete GLNG Trend Analysis ➞ | |
 | GABC German American Bancorp, Inc. |
| Sector: Financials | |
| SubSector: Regional - Midwest Banks | |
| MarketCap: 731.47 Millions | |
| Recent Price: 32.02 Smart Investing & Trading Score: 68 | |
| Day Percent Change: 1.07% Day Change: 0.34 | |
| Week Change: -0.71% Year-to-date Change: -1.2% | |
| GABC Links: Profile News Message Board | |
| Charts:- Daily , Weekly | |
| Add GABC to Watchlist: View: Get Complete GABC Trend Analysis ➞ | |
 | PGEN Precigen, Inc. |
| Sector: Health Care | |
| SubSector: Biotechnology | |
| MarketCap: 564.785 Millions | |
| Recent Price: 1.40 Smart Investing & Trading Score: 0 | |
| Day Percent Change: 0.00% Day Change: 0.00 | |
| Week Change: -0.71% Year-to-date Change: 4.5% | |
| PGEN Links: Profile News Message Board | |
| Charts:- Daily , Weekly | |
| Add PGEN to Watchlist: View: Get Complete PGEN Trend Analysis ➞ | |
 | HY Hyster-Yale Materials Handling, Inc. |
| Sector: Consumer Staples | |
| SubSector: Trucks & Other Vehicles | |
| MarketCap: 660 Millions | |
| Recent Price: 58.25 Smart Investing & Trading Score: 0 | |
| Day Percent Change: 0.83% Day Change: 0.48 | |
| Week Change: -0.73% Year-to-date Change: -6.3% | |
| HY Links: Profile News Message Board | |
| Charts:- Daily , Weekly | |
| Add HY to Watchlist: View: Get Complete HY Trend Analysis ➞ | |
 | REZI Resideo Technologies, Inc. |
| Sector: Services & Goods | |
| SubSector: Security & Protection Services | |
| MarketCap: 712.603 Millions | |
| Recent Price: 19.73 Smart Investing & Trading Score: 10 | |
| Day Percent Change: 2.28% Day Change: 0.44 | |
| Week Change: -0.75% Year-to-date Change: 4.8% | |
| REZI Links: Profile News Message Board | |
| Charts:- Daily , Weekly | |
| Add REZI to Watchlist: View: Get Complete REZI Trend Analysis ➞ | |
 | STEM Stem, Inc. |
| Sector: Technology | |
| SubSector: Software - Infrastructure | |
| MarketCap: 836 Millions | |
| Recent Price: 1.81 Smart Investing & Trading Score: 47 | |
| Day Percent Change: -1.89% Day Change: -0.04 | |
| Week Change: -0.82% Year-to-date Change: -52.7% | |
| STEM Links: Profile News Message Board | |
| Charts:- Daily , Weekly | |
| Add STEM to Watchlist: View: Get Complete STEM Trend Analysis ➞ | |
 | AROC Archrock, Inc. |
| Sector: Energy | |
| SubSector: Oil & Gas Equipment & Services | |
| MarketCap: 614.961 Millions | |
| Recent Price: 20.03 Smart Investing & Trading Score: 56 | |
| Day Percent Change: 2.72% Day Change: 0.53 | |
| Week Change: -0.84% Year-to-date Change: 30.1% | |
| AROC Links: Profile News Message Board | |
| Charts:- Daily , Weekly | |
| Add AROC to Watchlist: View: Get Complete AROC Trend Analysis ➞ | |
 | PETS PetMed Express, Inc. |
| Sector: Health Care | |
| SubSector: Drug Delivery | |
| MarketCap: 528.23 Millions | |
| Recent Price: 3.98 Smart Investing & Trading Score: 30 | |
| Day Percent Change: 0.63% Day Change: 0.02 | |
| Week Change: -0.87% Year-to-date Change: -47.3% | |
| PETS Links: Profile News Message Board | |
| Charts:- Daily , Weekly | |
| Add PETS to Watchlist: View: Get Complete PETS Trend Analysis ➞ | |
 | SMP Standard Motor Products, Inc. |
| Sector: Consumer Staples | |
| SubSector: Auto Parts | |
| MarketCap: 909.939 Millions | |
| Recent Price: 32.17 Smart Investing & Trading Score: 83 | |
| Day Percent Change: -1.86% Day Change: -0.61 | |
| Week Change: -0.89% Year-to-date Change: -19.2% | |
| SMP Links: Profile News Message Board | |
| Charts:- Daily , Weekly | |
| Add SMP to Watchlist: View: Get Complete SMP Trend Analysis ➞ | |
 | PSFE Paysafe Limited |
| Sector: Technology | |
| SubSector: Software - Infrastructure | |
| MarketCap: 605 Millions | |
| Recent Price: 14.33 Smart Investing & Trading Score: 28 | |
| Day Percent Change: 1.13% Day Change: 0.16 | |
| Week Change: -0.9% Year-to-date Change: 11.1% | |
| PSFE Links: Profile News Message Board | |
| Charts:- Daily , Weekly | |
| Add PSFE to Watchlist: View: Get Complete PSFE Trend Analysis ➞ | |
 | WHD Cactus, Inc. |
| Sector: Energy | |
| SubSector: Oil & Gas Equipment & Services | |
| MarketCap: 920.261 Millions | |
| Recent Price: 51.30 Smart Investing & Trading Score: 68 | |
| Day Percent Change: 3.55% Day Change: 1.76 | |
| Week Change: -0.97% Year-to-date Change: 13.0% | |
| WHD Links: Profile News Message Board | |
| Charts:- Daily , Weekly | |
| Add WHD to Watchlist: View: Get Complete WHD Trend Analysis ➞ | |
 | CADE Cadence Bancorporation |
| Sector: Financials | |
| SubSector: Regional - Southeast Banks | |
| MarketCap: 756.335 Millions | |
| Recent Price: 28.73 Smart Investing & Trading Score: 88 | |
| Day Percent Change: 1.77% Day Change: 0.50 | |
| Week Change: -1% Year-to-date Change: -2.9% | |
| CADE Links: Profile News Message Board | |
| Charts:- Daily , Weekly | |
| Add CADE to Watchlist: View: Get Complete CADE Trend Analysis ➞ | |
 | RVLV Revolve Group, Inc. |
| Sector: Services & Goods | |
| SubSector: Specialty Retail, Other | |
| MarketCap: 652.244 Millions | |
| Recent Price: 19.61 Smart Investing & Trading Score: 32 | |
| Day Percent Change: -0.51% Day Change: -0.10 | |
| Week Change: -1.01% Year-to-date Change: 18.3% | |
| RVLV Links: Profile News Message Board | |
| Charts:- Daily , Weekly | |
| Add RVLV to Watchlist: View: Get Complete RVLV Trend Analysis ➞ | |
 | TRS TriMas Corporation |
| Sector: Industrials | |
| SubSector: Industrial Equipment & Components | |
| MarketCap: 963.509 Millions | |
| Recent Price: 26.20 Smart Investing & Trading Score: 68 | |
| Day Percent Change: 1.59% Day Change: 0.41 | |
| Week Change: -1.06% Year-to-date Change: 3.4% | |
| TRS Links: Profile News Message Board | |
| Charts:- Daily , Weekly | |
| Add TRS to Watchlist: View: Get Complete TRS Trend Analysis ➞ | |
 | MYPS PLAYSTUDIOS, Inc. |
| Sector: Services & Goods | |
| SubSector: Electronic Gaming & Multimedia | |
| MarketCap: 635 Millions | |
| Recent Price: 2.22 Smart Investing & Trading Score: 20 | |
| Day Percent Change: -0.67% Day Change: -0.01 | |
| Week Change: -1.11% Year-to-date Change: -17.0% | |
| MYPS Links: Profile News Message Board | |
| Charts:- Daily , Weekly | |
| Add MYPS to Watchlist: View: Get Complete MYPS Trend Analysis ➞ | |
| For tabular summary view of above stock list: Summary View ➞ 0 - 25 , 25 - 50 , 50 - 75 , 75 - 100 , 100 - 125 , 125 - 150 , 150 - 175 , 175 - 200 , 200 - 225 , 225 - 250 , 250 - 275 , 275 - 300 , 300 - 325 , 325 - 350 | ||
| Click To Change The Sort Order: By Market Cap or Company Size Performance: Year-to-date, Week and Day | |
| Select Chart Type: | ||
| Too many stocks? View smallcap stocks filtered by marketcap & sector |
| Marketcap: All SmallCap Stocks (default-no microcap), Large, Mid-Range, Small & MicroCap |
| Sector: Tech, Finance, Energy, Staples, Retail, Industrial, Materials, Utilities & Medical |
|
Best Stocks Today 12Stocks.com |
© 2024 12Stocks.com Terms & Conditions Privacy Contact Us
All Information Provided Only For Education And Not To Be Used For Investing or Trading. See Terms & Conditions


One More Thing ... Get Best Stocks Delivered Daily!
Never Ever Miss A Move With Our Top Ten Stocks Lists
Find Best Stocks In Any Market - Bull or Bear Market
Take A Peek At Our Top Ten Stocks Lists: Daily, Weekly, Year-to-Date & Top Trends
Find Best Stocks In Any Market - Bull or Bear Market
Take A Peek At Our Top Ten Stocks Lists: Daily, Weekly, Year-to-Date & Top Trends
Smallcap Stocks With Best Up Trends [0-bearish to 100-bullish]: Emergent BioSolutions[100], Aspen Aerogels[100], Perdoceo Education[100], Gannett Co[100], Pitney Bowes[100], Benchmark Electronics[100], Origin Materials[100], FormFactor [100], Lantheus [100], Q2 [100], Blueprint Medicines[100]
Best Smallcap Stocks Year-to-Date:
Janux [440.16%], Viking [307.15%], Longboard [273.98%], Alpine Immune[239.23%], Bakkt [187.89%], Avidity Biosciences[182.96%], Vera [170.74%], Cullinan Oncology[169.74%], Super Micro[168.13%], Arcutis Bio[166.1%], Y-mAbs [153.08%] Best Smallcap Stocks This Week:
Deciphera [73.17%], Emergent BioSolutions[71.88%], Eyenovia [48.36%], Aspen Aerogels[47.89%], P3 Health[38.51%], Carvana Co[38.18%], Cue Biopharma[36.26%], Origin Materials[36.24%], TransMedics Group[35.13%], Seres [33.33%], Enovix [32.07%] Best Smallcap Stocks Daily:
Emergent BioSolutions[70.98%], Aspen Aerogels[56.44%], Carvana Co[33.77%], Perdoceo Education[31.79%], Enovix [31.06%], Office Properties[29.00%], Gannett Co[26.97%], Sunnova Energy[25.21%], Pitney Bowes[24.70%], Pulmonx [21.37%], CommScope Holding[20.38%]