
 Login Sign Up


| |||||
 |  | ||||

| 12Stocks.com Market Intelligence |
Best SmallCap Stocks
|
| In a hurry? Small Cap Stock Lists: Performance Trends Table, Stock Charts
Sort Small Cap stocks: Daily, Weekly, Year-to-Date, Market Cap & Trends. Filter Small Cap stocks list by sector: Show all, Tech, Finance, Energy, Staples, Retail, Industrial, Materials, Utilities and HealthCare Filter Small Cap stocks list by size: All Large Medium Small and MicroCap |
| 12Stocks.com Small Cap Stocks Performances & Trends Daily | |||||||||
|
|  The overall Smart Investing & Trading Score is 14 (0-bearish to 100-bullish) which puts Small Cap index in short term bearish trend. The Smart Investing & Trading Score from previous trading session is 41 and hence a deterioration of trend.
| ||||||||
Here are the Smart Investing & Trading Scores of the most requested small cap stocks at 12Stocks.com (click stock name for detailed review):
|


| 12Stocks.com: Investing in Smallcap Index with Stocks | |
|
The following table helps investors and traders sort through current performance and trends (as measured by Smart Investing & Trading Score) of various
stocks in the Smallcap Index. Quick View: Move mouse or cursor over stock symbol (ticker) to view short-term technical chart and over stock name to view long term chart. Click on  to add stock symbol to your watchlist and to add stock symbol to your watchlist and  to view watchlist. Click on any ticker or stock name for detailed market intelligence report for that stock. to view watchlist. Click on any ticker or stock name for detailed market intelligence report for that stock. |
12Stocks.com Performance of Stocks in Smallcap Index
| Ticker | Stock Name | Watchlist | Category | Recent Price | Smart Investing & Trading Score | Change % | Weekly Change% |
| OFIX | Orthofix Medical |   | Health Care | 13.00 | 55 | -0.19% | 0.08% |
| EGBN | Eagle Bancorp | | Financials | 19.43 | 27 | 2.40% | 0.08% |
| WHD | Cactus | | Energy | 51.84 | 36 | 4.64% | 0.08% |
| SST | System1 | | Industrials | 1.73 | 41 | 0.58% | 0.00% |
| NWLI | National Western | | Financials | 488.20 | 55 | 0.00% | -0.02% |
| IRT | Independence Realty | | Financials | 15.86 | 61 | 0.60% | -0.03% |
| FBNC | First Bancorp | | Financials | 31.50 | 17 | 0.78% | -0.08% |
| NMRK | Newmark Group | | Financials | 9.75 | 17 | 1.56% | -0.10% |
| SASR | Sandy Spring | | Financials | 21.47 | 52 | 1.49% | -0.12% |
| TCMD | Tactile Systems | | Health Care | 14.28 | 25 | -0.42% | -0.14% |
| RGR | Sturm Ruger | | Industrials | 46.38 | 83 | -0.15% | -0.19% |
| SCSC | ScanSource | | Technology | 41.83 | 22 | 0.87% | -0.33% |
| KELYA | Kelly Services | | Services & Goods | 23.37 | 32 | 0.04% | -0.38% |
| BATRK | Liberty Braves | | Services & Goods | 38.05 | 35 | 0.30% | -0.38% |
| OCFC | OceanFirst Financial | | Financials | 15.31 | 52 | 1.39% | -0.39% |
| PWP | Perella Weinberg | | Financials | 15.25 | 33 | 1.53% | -0.39% |
| NPO | EnPro Industries | | Industrials | 149.96 | 17 | 0.56% | -0.45% |
| VREX | Varex Imaging | | Health Care | 16.72 | 10 | 0.81% | -0.45% |
| ACHR | Archer Aviation | | Industrials | 4.00 | 27 | 0.00% | -0.50% |
| PRIM | Primoris Services | | Industrials | 46.17 | 46 | 0.91% | -0.53% |
| RVLV | Revolve Group | | Services & Goods | 19.70 | 47 | -0.03% | -0.53% |
| UNFI | United Natural | | Consumer Staples | 9.08 | 37 | 0.44% | -0.55% |
| LADR | Ladder Capital | | Financials | 10.94 | 75 | 0.37% | -0.55% |
| WINA | Winmark | | Services & Goods | 358.00 | 33 | -0.36% | -0.56% |
| PRM | Perimeter Solutions | | Materials | 7.02 | 53 | 1.15% | -0.57% |
| For chart view version of above stock list: Chart View ➞ 0 - 25 , 25 - 50 , 50 - 75 , 75 - 100 , 100 - 125 , 125 - 150 , 150 - 175 , 175 - 200 , 200 - 225 , 225 - 250 , 250 - 275 , 275 - 300 , 300 - 325 , 325 - 350 | ||
 | Click To Change The Sort Order: By Market Cap or Company Size Performance: Year-to-date, Week and Day |  |
| Too many stocks? View smallcap stocks filtered by marketcap & sector |
| Marketcap: All SmallCap Stocks (default-no microcap), Large, Mid-Range, Small |
| Smallcap Sector: Tech, Finance, Energy, Staples, Retail, Industrial, Materials, & Medical |
|
Get the most comprehensive stock market coverage daily at 12Stocks.com ➞ Best Stocks Today ➞ Best Stocks Weekly ➞ Best Stocks Year-to-Date ➞ Best Stocks Trends ➞  Best Stocks Today 12Stocks.com Best Nasdaq Stocks ➞ Best S&P 500 Stocks ➞ Best Tech Stocks ➞ Best Biotech Stocks ➞ |
| Detailed Overview of SmallCap Stocks |
| SmallCap Technical Overview, Leaders & Laggards, Top SmallCap ETF Funds & Detailed SmallCap Stocks List, Charts, Trends & More |
| Smallcap: Technical Analysis, Trends & YTD Performance | |
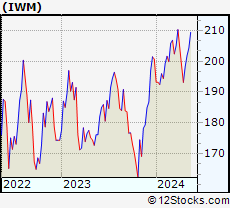
| SmallCap segment as represented by
IWM, an exchange-traded fund [ETF], holds basket of thousands of smallcap stocks from across all major sectors of the US stock market. The smallcap index (contains stocks like Riverbed & Sotheby's) is down by -1.78% and is currently underperforming the overall market by -6.59% year-to-date. Below is a quick view of technical charts and trends: | |
 IWM Weekly Chart |
|
| Long Term Trend: Not Good | |
| Medium Term Trend: Not Good | |
 IWM Daily Chart |
|
| Short Term Trend: Not Good | |
| Overall Trend Score: 14 | |
| YTD Performance: -1.78% | |
| **Trend Scores & Views Are Only For Educational Purposes And Not For Investing | |
| 12Stocks.com: Top Performing Small Cap Index Stocks | ||||||||||||||||||||||||||||||||||||||||||||||||
 The top performing Small Cap Index stocks year to date are
Now, more recently, over last week, the top performing Small Cap Index stocks on the move are


|
||||||||||||||||||||||||||||||||||||||||||||||||
| 12Stocks.com: Investing in Smallcap Index using Exchange Traded Funds | |
|
The following table shows list of key exchange traded funds (ETF) that
help investors track Smallcap index. The following list also includes leveraged ETF funds that track twice or thrice the daily returns of Smallcap indices. Short or inverse ETF funds move in the opposite direction to the index they track and are useful during market pullbacks or during bear markets. Quick View: Move mouse or cursor over ETF symbol (ticker) to view short-term technical chart and over ETF name to view long term chart. Click on ticker or stock name for detailed view. Click on to add stock symbol to your watchlist and to view watchlist. |
12Stocks.com List of ETFs that track Smallcap Index
| Ticker | ETF Name | Watchlist | Recent Price | Smart Investing & Trading Score | Change % | Week % | Year-to-date % |
| IWM | iShares Russell 2000 | | 197.13 | 14 | 0.42 | -0.64 | -1.78% |
| 12Stocks.com: Charts, Trends, Fundamental Data and Performances of SmallCap Stocks | |
|
We now take in-depth look at all SmallCap stocks including charts, multi-period performances and overall trends (as measured by Smart Investing & Trading Score). One can sort SmallCap stocks (click link to choose) by Daily, Weekly and by Year-to-Date performances. Also, one can sort by size of the company or by market capitalization. |
| Select Your Default Chart Type: | |||||
| |||||
| Click on stock symbol or name for detailed view. Click on to add stock symbol to your watchlist and to view watchlist. Quick View: Move mouse or cursor over "Daily" to quickly view daily technical stock chart and over "Weekly" to view weekly technical stock chart. | |||||

 | OFIX Orthofix Medical Inc. |
| Sector: Health Care | |
| SubSector: Medical Appliances & Equipment | |
| MarketCap: 508.18 Millions | |
| Recent Price: 13.00 Smart Investing & Trading Score: 55 | |
| Day Percent Change: -0.19% Day Change: -0.03 | |
| Week Change: 0.08% Year-to-date Change: -3.6% | |
| OFIX Links: Profile News Message Board | |
| Charts:- Daily , Weekly | |
| Add OFIX to Watchlist: View: Get Complete OFIX Trend Analysis ➞ | |
 | EGBN Eagle Bancorp, Inc. |
| Sector: Financials | |
| SubSector: Regional - Mid-Atlantic Banks | |
| MarketCap: 906.559 Millions | |
| Recent Price: 19.43 Smart Investing & Trading Score: 27 | |
| Day Percent Change: 2.40% Day Change: 0.46 | |
| Week Change: 0.08% Year-to-date Change: -35.6% | |
| EGBN Links: Profile News Message Board | |
| Charts:- Daily , Weekly | |
| Add EGBN to Watchlist: View: Get Complete EGBN Trend Analysis ➞ | |
 | WHD Cactus, Inc. |
| Sector: Energy | |
| SubSector: Oil & Gas Equipment & Services | |
| MarketCap: 920.261 Millions | |
| Recent Price: 51.84 Smart Investing & Trading Score: 36 | |
| Day Percent Change: 4.64% Day Change: 2.30 | |
| Week Change: 0.08% Year-to-date Change: 14.2% | |
| WHD Links: Profile News Message Board | |
| Charts:- Daily , Weekly | |
| Add WHD to Watchlist: View: Get Complete WHD Trend Analysis ➞ | |
 | SST System1, Inc. |
| Sector: Industrials | |
| SubSector: Specialty Business Services | |
| MarketCap: 504 Millions | |
| Recent Price: 1.73 Smart Investing & Trading Score: 41 | |
| Day Percent Change: 0.58% Day Change: 0.01 | |
| Week Change: 0% Year-to-date Change: -28.2% | |
| SST Links: Profile News Message Board | |
| Charts:- Daily , Weekly | |
| Add SST to Watchlist: View: Get Complete SST Trend Analysis ➞ | |
 | NWLI National Western Life Group, Inc. |
| Sector: Financials | |
| SubSector: Life Insurance | |
| MarketCap: 529 Millions | |
| Recent Price: 488.20 Smart Investing & Trading Score: 55 | |
| Day Percent Change: 0.00% Day Change: 0.00 | |
| Week Change: -0.02% Year-to-date Change: 1.1% | |
| NWLI Links: Profile News Message Board | |
| Charts:- Daily , Weekly | |
| Add NWLI to Watchlist: View: Get Complete NWLI Trend Analysis ➞ | |
 | IRT Independence Realty Trust, Inc. |
| Sector: Financials | |
| SubSector: REIT - Residential | |
| MarketCap: 980.161 Millions | |
| Recent Price: 15.86 Smart Investing & Trading Score: 61 | |
| Day Percent Change: 0.60% Day Change: 0.10 | |
| Week Change: -0.03% Year-to-date Change: 3.6% | |
| IRT Links: Profile News Message Board | |
| Charts:- Daily , Weekly | |
| Add IRT to Watchlist: View: Get Complete IRT Trend Analysis ➞ | |
 | FBNC First Bancorp |
| Sector: Financials | |
| SubSector: Regional - Mid-Atlantic Banks | |
| MarketCap: 664.959 Millions | |
| Recent Price: 31.50 Smart Investing & Trading Score: 17 | |
| Day Percent Change: 0.78% Day Change: 0.25 | |
| Week Change: -0.08% Year-to-date Change: -14.9% | |
| FBNC Links: Profile News Message Board | |
| Charts:- Daily , Weekly | |
| Add FBNC to Watchlist: View: Get Complete FBNC Trend Analysis ➞ | |
 | NMRK Newmark Group, Inc. |
| Sector: Financials | |
| SubSector: Property Management | |
| MarketCap: 767.542 Millions | |
| Recent Price: 9.75 Smart Investing & Trading Score: 17 | |
| Day Percent Change: 1.56% Day Change: 0.15 | |
| Week Change: -0.1% Year-to-date Change: -11.0% | |
| NMRK Links: Profile News Message Board | |
| Charts:- Daily , Weekly | |
| Add NMRK to Watchlist: View: Get Complete NMRK Trend Analysis ➞ | |
 | SASR Sandy Spring Bancorp, Inc. |
| Sector: Financials | |
| SubSector: Regional - Mid-Atlantic Banks | |
| MarketCap: 764.659 Millions | |
| Recent Price: 21.47 Smart Investing & Trading Score: 52 | |
| Day Percent Change: 1.49% Day Change: 0.32 | |
| Week Change: -0.12% Year-to-date Change: -21.2% | |
| SASR Links: Profile News Message Board | |
| Charts:- Daily , Weekly | |
| Add SASR to Watchlist: View: Get Complete SASR Trend Analysis ➞ | |
 | TCMD Tactile Systems Technology, Inc. |
| Sector: Health Care | |
| SubSector: Medical Instruments & Supplies | |
| MarketCap: 655.96 Millions | |
| Recent Price: 14.28 Smart Investing & Trading Score: 25 | |
| Day Percent Change: -0.42% Day Change: -0.06 | |
| Week Change: -0.14% Year-to-date Change: -0.1% | |
| TCMD Links: Profile News Message Board | |
| Charts:- Daily , Weekly | |
| Add TCMD to Watchlist: View: Get Complete TCMD Trend Analysis ➞ | |
 | RGR Sturm, Ruger & Company, Inc. |
| Sector: Industrials | |
| SubSector: Aerospace/Defense Products & Services | |
| MarketCap: 752 Millions | |
| Recent Price: 46.38 Smart Investing & Trading Score: 83 | |
| Day Percent Change: -0.15% Day Change: -0.07 | |
| Week Change: -0.19% Year-to-date Change: 2.1% | |
| RGR Links: Profile News Message Board | |
| Charts:- Daily , Weekly | |
| Add RGR to Watchlist: View: Get Complete RGR Trend Analysis ➞ | |
 | SCSC ScanSource, Inc. |
| Sector: Technology | |
| SubSector: Technical & System Software | |
| MarketCap: 541 Millions | |
| Recent Price: 41.83 Smart Investing & Trading Score: 22 | |
| Day Percent Change: 0.87% Day Change: 0.36 | |
| Week Change: -0.33% Year-to-date Change: 5.6% | |
| SCSC Links: Profile News Message Board | |
| Charts:- Daily , Weekly | |
| Add SCSC to Watchlist: View: Get Complete SCSC Trend Analysis ➞ | |
 | KELYA Kelly Services, Inc. |
| Sector: Services & Goods | |
| SubSector: Staffing & Outsourcing Services | |
| MarketCap: 587.228 Millions | |
| Recent Price: 23.37 Smart Investing & Trading Score: 32 | |
| Day Percent Change: 0.04% Day Change: 0.01 | |
| Week Change: -0.38% Year-to-date Change: 8.1% | |
| KELYA Links: Profile News Message Board | |
| Charts:- Daily , Weekly | |
| Add KELYA to Watchlist: View: Get Complete KELYA Trend Analysis ➞ | |
 | BATRK The Liberty Braves Group |
| Sector: Services & Goods | |
| SubSector: Broadcasting - TV | |
| MarketCap: 638.363 Millions | |
| Recent Price: 38.05 Smart Investing & Trading Score: 35 | |
| Day Percent Change: 0.30% Day Change: 0.12 | |
| Week Change: -0.38% Year-to-date Change: -3.9% | |
| BATRK Links: Profile News Message Board | |
| Charts:- Daily , Weekly | |
| Add BATRK to Watchlist: View: Get Complete BATRK Trend Analysis ➞ | |
 | OCFC OceanFirst Financial Corp. |
| Sector: Financials | |
| SubSector: Savings & Loans | |
| MarketCap: 867.43 Millions | |
| Recent Price: 15.31 Smart Investing & Trading Score: 52 | |
| Day Percent Change: 1.39% Day Change: 0.21 | |
| Week Change: -0.39% Year-to-date Change: -11.8% | |
| OCFC Links: Profile News Message Board | |
| Charts:- Daily , Weekly | |
| Add OCFC to Watchlist: View: Get Complete OCFC Trend Analysis ➞ | |
 | PWP Perella Weinberg Partners |
| Sector: Financials | |
| SubSector: Capital Markets | |
| MarketCap: 705 Millions | |
| Recent Price: 15.25 Smart Investing & Trading Score: 33 | |
| Day Percent Change: 1.53% Day Change: 0.23 | |
| Week Change: -0.39% Year-to-date Change: 23.5% | |
| PWP Links: Profile News Message Board | |
| Charts:- Daily , Weekly | |
| Add PWP to Watchlist: View: Get Complete PWP Trend Analysis ➞ | |
 | NPO EnPro Industries, Inc. |
| Sector: Industrials | |
| SubSector: Industrial Equipment & Components | |
| MarketCap: 734.309 Millions | |
| Recent Price: 149.96 Smart Investing & Trading Score: 17 | |
| Day Percent Change: 0.56% Day Change: 0.84 | |
| Week Change: -0.45% Year-to-date Change: -4.3% | |
| NPO Links: Profile News Message Board | |
| Charts:- Daily , Weekly | |
| Add NPO to Watchlist: View: Get Complete NPO Trend Analysis ➞ | |
 | VREX Varex Imaging Corporation |
| Sector: Health Care | |
| SubSector: Medical Appliances & Equipment | |
| MarketCap: 718.78 Millions | |
| Recent Price: 16.72 Smart Investing & Trading Score: 10 | |
| Day Percent Change: 0.81% Day Change: 0.14 | |
| Week Change: -0.45% Year-to-date Change: -18.5% | |
| VREX Links: Profile News Message Board | |
| Charts:- Daily , Weekly | |
| Add VREX to Watchlist: View: Get Complete VREX Trend Analysis ➞ | |
 | ACHR Archer Aviation Inc. |
| Sector: Industrials | |
| SubSector: Aerospace & Defense | |
| MarketCap: 976 Millions | |
| Recent Price: 4.00 Smart Investing & Trading Score: 27 | |
| Day Percent Change: 0.00% Day Change: 0.00 | |
| Week Change: -0.5% Year-to-date Change: -34.6% | |
| ACHR Links: Profile News Message Board | |
| Charts:- Daily , Weekly | |
| Add ACHR to Watchlist: View: Get Complete ACHR Trend Analysis ➞ | |
 | PRIM Primoris Services Corporation |
| Sector: Industrials | |
| SubSector: Heavy Construction | |
| MarketCap: 931.895 Millions | |
| Recent Price: 46.17 Smart Investing & Trading Score: 46 | |
| Day Percent Change: 0.91% Day Change: 0.41 | |
| Week Change: -0.53% Year-to-date Change: 39.0% | |
| PRIM Links: Profile News Message Board | |
| Charts:- Daily , Weekly | |
| Add PRIM to Watchlist: View: Get Complete PRIM Trend Analysis ➞ | |
 | RVLV Revolve Group, Inc. |
| Sector: Services & Goods | |
| SubSector: Specialty Retail, Other | |
| MarketCap: 652.244 Millions | |
| Recent Price: 19.70 Smart Investing & Trading Score: 47 | |
| Day Percent Change: -0.03% Day Change: -0.01 | |
| Week Change: -0.53% Year-to-date Change: 18.9% | |
| RVLV Links: Profile News Message Board | |
| Charts:- Daily , Weekly | |
| Add RVLV to Watchlist: View: Get Complete RVLV Trend Analysis ➞ | |
 | UNFI United Natural Foods, Inc. |
| Sector: Consumer Staples | |
| SubSector: Food Wholesale | |
| MarketCap: 746.329 Millions | |
| Recent Price: 9.08 Smart Investing & Trading Score: 37 | |
| Day Percent Change: 0.44% Day Change: 0.04 | |
| Week Change: -0.55% Year-to-date Change: -44.1% | |
| UNFI Links: Profile News Message Board | |
| Charts:- Daily , Weekly | |
| Add UNFI to Watchlist: View: Get Complete UNFI Trend Analysis ➞ | |
 | LADR Ladder Capital Corp |
| Sector: Financials | |
| SubSector: Mortgage Investment | |
| MarketCap: 660.039 Millions | |
| Recent Price: 10.94 Smart Investing & Trading Score: 75 | |
| Day Percent Change: 0.37% Day Change: 0.04 | |
| Week Change: -0.55% Year-to-date Change: -5.0% | |
| LADR Links: Profile News Message Board | |
| Charts:- Daily , Weekly | |
| Add LADR to Watchlist: View: Get Complete LADR Trend Analysis ➞ | |
 | WINA Winmark Corporation |
| Sector: Services & Goods | |
| SubSector: Specialty Retail, Other | |
| MarketCap: 520.444 Millions | |
| Recent Price: 358.00 Smart Investing & Trading Score: 33 | |
| Day Percent Change: -0.36% Day Change: -1.30 | |
| Week Change: -0.56% Year-to-date Change: -14.3% | |
| WINA Links: Profile News Message Board | |
| Charts:- Daily , Weekly | |
| Add WINA to Watchlist: View: Get Complete WINA Trend Analysis ➞ | |
 | PRM Perimeter Solutions, SA |
| Sector: Materials | |
| SubSector: Specialty Chemicals | |
| MarketCap: 930 Millions | |
| Recent Price: 7.02 Smart Investing & Trading Score: 53 | |
| Day Percent Change: 1.15% Day Change: 0.08 | |
| Week Change: -0.57% Year-to-date Change: 52.8% | |
| PRM Links: Profile News Message Board | |
| Charts:- Daily , Weekly | |
| Add PRM to Watchlist: View: Get Complete PRM Trend Analysis ➞ | |
| For tabular summary view of above stock list: Summary View ➞ 0 - 25 , 25 - 50 , 50 - 75 , 75 - 100 , 100 - 125 , 125 - 150 , 150 - 175 , 175 - 200 , 200 - 225 , 225 - 250 , 250 - 275 , 275 - 300 , 300 - 325 , 325 - 350 | ||
| Click To Change The Sort Order: By Market Cap or Company Size Performance: Year-to-date, Week and Day | |
| Select Chart Type: | ||
| Too many stocks? View smallcap stocks filtered by marketcap & sector |
| Marketcap: All SmallCap Stocks (default-no microcap), Large, Mid-Range, Small & MicroCap |
| Sector: Tech, Finance, Energy, Staples, Retail, Industrial, Materials, Utilities & Medical |
|
Best Stocks Today 12Stocks.com |
© 2024 12Stocks.com Terms & Conditions Privacy Contact Us
All Information Provided Only For Education And Not To Be Used For Investing or Trading. See Terms & Conditions


One More Thing ... Get Best Stocks Delivered Daily!
Never Ever Miss A Move With Our Top Ten Stocks Lists
Find Best Stocks In Any Market - Bull or Bear Market
Take A Peek At Our Top Ten Stocks Lists: Daily, Weekly, Year-to-Date & Top Trends
Find Best Stocks In Any Market - Bull or Bear Market
Take A Peek At Our Top Ten Stocks Lists: Daily, Weekly, Year-to-Date & Top Trends
Smallcap Stocks With Best Up Trends [0-bearish to 100-bullish]: UFP [100], Gray Television[100], USCB Financial[100], Outbrain [100], BankUnited [100], PMV [100], Bancshares[100], First Interstate[100], OneSpaWorld [100], Preferred Bank[100], PROCEPT BioRobotics[100]
Best Smallcap Stocks Year-to-Date:
Janux [434.2%], Longboard [253.44%], Alpine Immune[239.36%], Avidity Biosciences[180.42%], Cullinan Oncology[171.9%], Bakkt [169.51%], Vera [168.8%], Arcutis Bio[163.93%], Super Micro[150.63%], Y-mAbs [145.23%], Sana [130.96%] Best Smallcap Stocks This Week:
Emergent BioSolutions[61.72%], Eyenovia [44.86%], Cue Biopharma[35.9%], Poseida [34.51%], P3 Health[30.18%], Surmodics [29.08%], Phibro Animal[28.91%], TransMedics Group[28.2%], Enovix [27.36%], MediaAlpha [26.88%], Seres [26.67%] Best Smallcap Stocks Daily:
Emergent BioSolutions[60.88%], Enovix [26.38%], Gannett Co[23.65%], Office Properties[22.00%], Perdoceo Education[19.25%], Pitney Bowes[18.76%], Benchmark Electronics[17.86%], Butterfly [16.81%], Pulmonx [15.80%], MediaAlpha [13.63%], Sunnova Energy[13.46%]