
 Login Sign Up


| |||||
 |  | ||||

| 12Stocks.com Market Intelligence |
Best SmallCap Stocks
|
| In a hurry? Small Cap Stock Lists: Performance Trends Table, Stock Charts
Sort Small Cap stocks: Daily, Weekly, Year-to-Date, Market Cap & Trends. Filter Small Cap stocks list by sector: Show all, Tech, Finance, Energy, Staples, Retail, Industrial, Materials, Utilities and HealthCare Filter Small Cap stocks list by size: All Large Medium Small and MicroCap |
| 12Stocks.com Small Cap Stocks Performances & Trends Daily | |||||||||
|
|  The overall Smart Investing & Trading Score is 24 (0-bearish to 100-bullish) which puts Small Cap index in short term bearish to neutral trend. The Smart Investing & Trading Score from previous trading session is 14 and hence an improvement of trend.
| ||||||||
Here are the Smart Investing & Trading Scores of the most requested small cap stocks at 12Stocks.com (click stock name for detailed review):
|


| 12Stocks.com: Investing in Smallcap Index with Stocks | |
|
The following table helps investors and traders sort through current performance and trends (as measured by Smart Investing & Trading Score) of various
stocks in the Smallcap Index. Quick View: Move mouse or cursor over stock symbol (ticker) to view short-term technical chart and over stock name to view long term chart. Click on  to add stock symbol to your watchlist and to add stock symbol to your watchlist and  to view watchlist. Click on any ticker or stock name for detailed market intelligence report for that stock. to view watchlist. Click on any ticker or stock name for detailed market intelligence report for that stock. |
12Stocks.com Performance of Stocks in Smallcap Index
| Ticker | Stock Name | Watchlist | Category | Recent Price | Smart Investing & Trading Score | Change % | Weekly Change% |
| OXM | Oxford Industries |   | Consumer Staples | 109.22 | 80 | 1.50% | 2.35% |
| APOG | Apogee Enterprises | | Industrials | 63.48 | 95 | 1.52% | 2.30% |
| SBCF | Seacoast Banking | | Financials | 23.90 | 62 | 1.66% | 2.22% |
| NTB | Bank of N.T. Butterfield & Son | | Financials | 34.81 | 95 | 1.22% | 2.20% |
| DDD | 3D Systems | | Technology | 3.50 | 45 | 1.30% | 2.19% |
| RCKT | Rocket | | Health Care | 22.46 | 42 | -0.31% | 2.18% |
| RMR | RMR Group | | Financials | 24.03 | 49 | -0.08% | 2.12% |
| UNFI | United Natural | | Consumer Staples | 9.31 | 37 | 3.04% | 2.03% |
| TCX | Tucows | | Technology | 18.30 | 54 | 1.39% | 1.95% |
| SMRT | SmartRent | | Technology | 2.40 | 17 | 2.78% | 1.91% |
| ABR | Arbor Realty | | Financials | 13.07 | 69 | 0.73% | 1.91% |
| SFL | SFL | | Transports | 13.49 | 52 | 1.73% | 1.89% |
| MGPI | MGP Ingredients | | Consumer Staples | 82.05 | 42 | 4.86% | 1.87% |
| NBHC | National Bank | | Financials | 34.12 | 42 | 2.06% | 1.85% |
| USPH | U.S. Physical | | Health Care | 102.43 | 39 | 0.85% | 1.80% |
| OABI | OmniAb | | Health Care | 4.55 | 35 | 0.22% | 1.79% |
| ZUMZ | Zumiez | | Services & Goods | 17.25 | 64 | 0.76% | 1.77% |
| KRYS | Krystal Biotech | | Health Care | 159.54 | 45 | -0.08% | 1.70% |
| TTGT | TechTarget | | Technology | 27.96 | 74 | -1.72% | 1.67% |
| AMBC | Ambac Financial | | Financials | 14.83 | 49 | 0.07% | 1.64% |
| ROIC | Retail Opportunity | | Financials | 12.45 | 62 | 0.73% | 1.63% |
| ANF | Abercrombie & Fitch Co | | Services & Goods | 123.96 | 44 | 2.94% | 1.54% |
| PETQ | PetIQ | | Health Care | 16.78 | 64 | -0.53% | 1.51% |
| CDRE | Cadre | | Industrials | 33.62 | 57 | -0.31% | 1.49% |
| EFSC | Enterprise Financial | | Financials | 39.37 | 60 | 1.03% | 1.47% |
| For chart view version of above stock list: Chart View ➞ 0 - 25 , 25 - 50 , 50 - 75 , 75 - 100 , 100 - 125 , 125 - 150 , 150 - 175 , 175 - 200 , 200 - 225 , 225 - 250 , 250 - 275 , 275 - 300 , 300 - 325 , 325 - 350 | ||
 | Click To Change The Sort Order: By Market Cap or Company Size Performance: Year-to-date, Week and Day |  |
| Too many stocks? View smallcap stocks filtered by marketcap & sector |
| Marketcap: All SmallCap Stocks (default-no microcap), Large, Mid-Range, Small |
| Smallcap Sector: Tech, Finance, Energy, Staples, Retail, Industrial, Materials, & Medical |
|
Get the most comprehensive stock market coverage daily at 12Stocks.com ➞ Best Stocks Today ➞ Best Stocks Weekly ➞ Best Stocks Year-to-Date ➞ Best Stocks Trends ➞  Best Stocks Today 12Stocks.com Best Nasdaq Stocks ➞ Best S&P 500 Stocks ➞ Best Tech Stocks ➞ Best Biotech Stocks ➞ |
| Detailed Overview of SmallCap Stocks |
| SmallCap Technical Overview, Leaders & Laggards, Top SmallCap ETF Funds & Detailed SmallCap Stocks List, Charts, Trends & More |
| Smallcap: Technical Analysis, Trends & YTD Performance | |
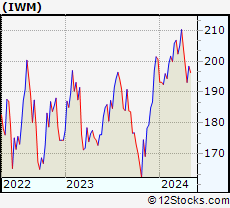
| SmallCap segment as represented by
IWM, an exchange-traded fund [ETF], holds basket of thousands of smallcap stocks from across all major sectors of the US stock market. The smallcap index (contains stocks like Riverbed & Sotheby's) is down by -1.02% and is currently underperforming the overall market by -6.17% year-to-date. Below is a quick view of technical charts and trends: | |
 IWM Weekly Chart |
|
| Long Term Trend: Not Good | |
| Medium Term Trend: Not Good | |
 IWM Daily Chart |
|
| Short Term Trend: Deteriorating | |
| Overall Trend Score: 24 | |
| YTD Performance: -1.02% | |
| **Trend Scores & Views Are Only For Educational Purposes And Not For Investing | |
| 12Stocks.com: Top Performing Small Cap Index Stocks | ||||||||||||||||||||||||||||||||||||||||||||||||
 The top performing Small Cap Index stocks year to date are
Now, more recently, over last week, the top performing Small Cap Index stocks on the move are


|
||||||||||||||||||||||||||||||||||||||||||||||||
| 12Stocks.com: Investing in Smallcap Index using Exchange Traded Funds | |
|
The following table shows list of key exchange traded funds (ETF) that
help investors track Smallcap index. The following list also includes leveraged ETF funds that track twice or thrice the daily returns of Smallcap indices. Short or inverse ETF funds move in the opposite direction to the index they track and are useful during market pullbacks or during bear markets. Quick View: Move mouse or cursor over ETF symbol (ticker) to view short-term technical chart and over ETF name to view long term chart. Click on ticker or stock name for detailed view. Click on to add stock symbol to your watchlist and to view watchlist. |
12Stocks.com List of ETFs that track Smallcap Index
| Ticker | ETF Name | Watchlist | Recent Price | Smart Investing & Trading Score | Change % | Week % | Year-to-date % |
| IWM | iShares Russell 2000 | | 198.66 | 24 | 1.20 | 0.14 | -1.02% |
| IJR | iShares Core S&P Small-Cap | | 105.66 | 15 | 0.88 | 0.01 | -2.39% |
| IWN | iShares Russell 2000 Value | | 151.74 | 15 | 1.28 | 0.39 | -2.31% |
| IWO | iShares Russell 2000 Growth | | 252.43 | 7 | 1.14 | -0.26 | 0.08% |
| 12Stocks.com: Charts, Trends, Fundamental Data and Performances of SmallCap Stocks | |
|
We now take in-depth look at all SmallCap stocks including charts, multi-period performances and overall trends (as measured by Smart Investing & Trading Score). One can sort SmallCap stocks (click link to choose) by Daily, Weekly and by Year-to-Date performances. Also, one can sort by size of the company or by market capitalization. |
| Select Your Default Chart Type: | |||||
| |||||
| Click on stock symbol or name for detailed view. Click on to add stock symbol to your watchlist and to view watchlist. Quick View: Move mouse or cursor over "Daily" to quickly view daily technical stock chart and over "Weekly" to view weekly technical stock chart. | |||||

 | OXM Oxford Industries, Inc. |
| Sector: Consumer Staples | |
| SubSector: Textile - Apparel Clothing | |
| MarketCap: 647.665 Millions | |
| Recent Price: 109.22 Smart Investing & Trading Score: 80 | |
| Day Percent Change: 1.50% Day Change: 1.61 | |
| Week Change: 2.35% Year-to-date Change: 9.2% | |
| OXM Links: Profile News Message Board | |
| Charts:- Daily , Weekly | |
| Add OXM to Watchlist: View: Get Complete OXM Trend Analysis ➞ | |
 | APOG Apogee Enterprises, Inc. |
| Sector: Industrials | |
| SubSector: General Building Materials | |
| MarketCap: 510.653 Millions | |
| Recent Price: 63.48 Smart Investing & Trading Score: 95 | |
| Day Percent Change: 1.52% Day Change: 0.95 | |
| Week Change: 2.3% Year-to-date Change: 18.9% | |
| APOG Links: Profile News Message Board | |
| Charts:- Daily , Weekly | |
| Add APOG to Watchlist: View: Get Complete APOG Trend Analysis ➞ | |
 | SBCF Seacoast Banking Corporation of Florida |
| Sector: Financials | |
| SubSector: Regional - Mid-Atlantic Banks | |
| MarketCap: 881.559 Millions | |
| Recent Price: 23.90 Smart Investing & Trading Score: 62 | |
| Day Percent Change: 1.66% Day Change: 0.39 | |
| Week Change: 2.22% Year-to-date Change: -16.0% | |
| SBCF Links: Profile News Message Board | |
| Charts:- Daily , Weekly | |
| Add SBCF to Watchlist: View: Get Complete SBCF Trend Analysis ➞ | |
 | NTB The Bank of N.T. Butterfield & Son Limited |
| Sector: Financials | |
| SubSector: Foreign Regional Banks | |
| MarketCap: 889.379 Millions | |
| Recent Price: 34.81 Smart Investing & Trading Score: 95 | |
| Day Percent Change: 1.22% Day Change: 0.42 | |
| Week Change: 2.2% Year-to-date Change: 8.8% | |
| NTB Links: Profile News Message Board | |
| Charts:- Daily , Weekly | |
| Add NTB to Watchlist: View: Get Complete NTB Trend Analysis ➞ | |
 | DDD 3D Systems Corporation |
| Sector: Technology | |
| SubSector: Computer Peripherals | |
| MarketCap: 842.989 Millions | |
| Recent Price: 3.50 Smart Investing & Trading Score: 45 | |
| Day Percent Change: 1.30% Day Change: 0.04 | |
| Week Change: 2.19% Year-to-date Change: -44.8% | |
| DDD Links: Profile News Message Board | |
| Charts:- Daily , Weekly | |
| Add DDD to Watchlist: View: Get Complete DDD Trend Analysis ➞ | |
 | RCKT Rocket Pharmaceuticals, Inc. |
| Sector: Health Care | |
| SubSector: Biotechnology | |
| MarketCap: 899.585 Millions | |
| Recent Price: 22.46 Smart Investing & Trading Score: 42 | |
| Day Percent Change: -0.31% Day Change: -0.07 | |
| Week Change: 2.18% Year-to-date Change: -25.1% | |
| RCKT Links: Profile News Message Board | |
| Charts:- Daily , Weekly | |
| Add RCKT to Watchlist: View: Get Complete RCKT Trend Analysis ➞ | |
 | RMR The RMR Group Inc. |
| Sector: Financials | |
| SubSector: Real Estate Development | |
| MarketCap: 797.419 Millions | |
| Recent Price: 24.03 Smart Investing & Trading Score: 49 | |
| Day Percent Change: -0.08% Day Change: -0.02 | |
| Week Change: 2.12% Year-to-date Change: -14.9% | |
| RMR Links: Profile News Message Board | |
| Charts:- Daily , Weekly | |
| Add RMR to Watchlist: View: Get Complete RMR Trend Analysis ➞ | |
 | UNFI United Natural Foods, Inc. |
| Sector: Consumer Staples | |
| SubSector: Food Wholesale | |
| MarketCap: 746.329 Millions | |
| Recent Price: 9.31 Smart Investing & Trading Score: 37 | |
| Day Percent Change: 3.04% Day Change: 0.28 | |
| Week Change: 2.03% Year-to-date Change: -42.6% | |
| UNFI Links: Profile News Message Board | |
| Charts:- Daily , Weekly | |
| Add UNFI to Watchlist: View: Get Complete UNFI Trend Analysis ➞ | |
 | TCX Tucows Inc. |
| Sector: Technology | |
| SubSector: Internet Information Providers | |
| MarketCap: 557.78 Millions | |
| Recent Price: 18.30 Smart Investing & Trading Score: 54 | |
| Day Percent Change: 1.39% Day Change: 0.25 | |
| Week Change: 1.95% Year-to-date Change: -32.2% | |
| TCX Links: Profile News Message Board | |
| Charts:- Daily , Weekly | |
| Add TCX to Watchlist: View: Get Complete TCX Trend Analysis ➞ | |
 | SMRT SmartRent, Inc. |
| Sector: Technology | |
| SubSector: Software - Application | |
| MarketCap: 733 Millions | |
| Recent Price: 2.40 Smart Investing & Trading Score: 17 | |
| Day Percent Change: 2.78% Day Change: 0.06 | |
| Week Change: 1.91% Year-to-date Change: -24.6% | |
| SMRT Links: Profile News Message Board | |
| Charts:- Daily , Weekly | |
| Add SMRT to Watchlist: View: Get Complete SMRT Trend Analysis ➞ | |
 | ABR Arbor Realty Trust, Inc. |
| Sector: Financials | |
| SubSector: Mortgage Investment | |
| MarketCap: 648.939 Millions | |
| Recent Price: 13.07 Smart Investing & Trading Score: 69 | |
| Day Percent Change: 0.73% Day Change: 0.09 | |
| Week Change: 1.91% Year-to-date Change: -13.9% | |
| ABR Links: Profile News Message Board | |
| Charts:- Daily , Weekly | |
| Add ABR to Watchlist: View: Get Complete ABR Trend Analysis ➞ | |
 | SFL SFL Corporation Ltd. |
| Sector: Transports | |
| SubSector: Shipping | |
| MarketCap: 890.414 Millions | |
| Recent Price: 13.49 Smart Investing & Trading Score: 52 | |
| Day Percent Change: 1.73% Day Change: 0.23 | |
| Week Change: 1.89% Year-to-date Change: 19.6% | |
| SFL Links: Profile News Message Board | |
| Charts:- Daily , Weekly | |
| Add SFL to Watchlist: View: Get Complete SFL Trend Analysis ➞ | |
 | MGPI MGP Ingredients, Inc. |
| Sector: Consumer Staples | |
| SubSector: Beverages - Wineries & Distillers | |
| MarketCap: 502.635 Millions | |
| Recent Price: 82.05 Smart Investing & Trading Score: 42 | |
| Day Percent Change: 4.86% Day Change: 3.80 | |
| Week Change: 1.87% Year-to-date Change: -16.7% | |
| MGPI Links: Profile News Message Board | |
| Charts:- Daily , Weekly | |
| Add MGPI to Watchlist: View: Get Complete MGPI Trend Analysis ➞ | |
 | NBHC National Bank Holdings Corporation |
| Sector: Financials | |
| SubSector: Regional - Midwest Banks | |
| MarketCap: 766.87 Millions | |
| Recent Price: 34.12 Smart Investing & Trading Score: 42 | |
| Day Percent Change: 2.06% Day Change: 0.69 | |
| Week Change: 1.85% Year-to-date Change: -8.3% | |
| NBHC Links: Profile News Message Board | |
| Charts:- Daily , Weekly | |
| Add NBHC to Watchlist: View: Get Complete NBHC Trend Analysis ➞ | |
 | USPH U.S. Physical Therapy, Inc. |
| Sector: Health Care | |
| SubSector: Specialized Health Services | |
| MarketCap: 793.556 Millions | |
| Recent Price: 102.43 Smart Investing & Trading Score: 39 | |
| Day Percent Change: 0.85% Day Change: 0.86 | |
| Week Change: 1.8% Year-to-date Change: 10.0% | |
| USPH Links: Profile News Message Board | |
| Charts:- Daily , Weekly | |
| Add USPH to Watchlist: View: Get Complete USPH Trend Analysis ➞ | |
 | OABI OmniAb, Inc. |
| Sector: Health Care | |
| SubSector: Biotechnology | |
| MarketCap: 570 Millions | |
| Recent Price: 4.55 Smart Investing & Trading Score: 35 | |
| Day Percent Change: 0.22% Day Change: 0.01 | |
| Week Change: 1.79% Year-to-date Change: -24.9% | |
| OABI Links: Profile News Message Board | |
| Charts:- Daily , Weekly | |
| Add OABI to Watchlist: View: Get Complete OABI Trend Analysis ➞ | |
 | ZUMZ Zumiez Inc. |
| Sector: Services & Goods | |
| SubSector: Specialty Retail, Other | |
| MarketCap: 526.244 Millions | |
| Recent Price: 17.25 Smart Investing & Trading Score: 64 | |
| Day Percent Change: 0.76% Day Change: 0.13 | |
| Week Change: 1.77% Year-to-date Change: -15.2% | |
| ZUMZ Links: Profile News Message Board | |
| Charts:- Daily , Weekly | |
| Add ZUMZ to Watchlist: View: Get Complete ZUMZ Trend Analysis ➞ | |
 | KRYS Krystal Biotech, Inc. |
| Sector: Health Care | |
| SubSector: Biotechnology | |
| MarketCap: 874.085 Millions | |
| Recent Price: 159.54 Smart Investing & Trading Score: 45 | |
| Day Percent Change: -0.08% Day Change: -0.13 | |
| Week Change: 1.7% Year-to-date Change: 28.6% | |
| KRYS Links: Profile News Message Board | |
| Charts:- Daily , Weekly | |
| Add KRYS to Watchlist: View: Get Complete KRYS Trend Analysis ➞ | |
 | TTGT TechTarget, Inc. |
| Sector: Technology | |
| SubSector: Internet Information Providers | |
| MarketCap: 560.78 Millions | |
| Recent Price: 27.96 Smart Investing & Trading Score: 74 | |
| Day Percent Change: -1.72% Day Change: -0.49 | |
| Week Change: 1.67% Year-to-date Change: -19.8% | |
| TTGT Links: Profile News Message Board | |
| Charts:- Daily , Weekly | |
| Add TTGT to Watchlist: View: Get Complete TTGT Trend Analysis ➞ | |
 | AMBC Ambac Financial Group, Inc. |
| Sector: Financials | |
| SubSector: Surety & Title Insurance | |
| MarketCap: 587.818 Millions | |
| Recent Price: 14.83 Smart Investing & Trading Score: 49 | |
| Day Percent Change: 0.07% Day Change: 0.01 | |
| Week Change: 1.64% Year-to-date Change: -10.0% | |
| AMBC Links: Profile News Message Board | |
| Charts:- Daily , Weekly | |
| Add AMBC to Watchlist: View: Get Complete AMBC Trend Analysis ➞ | |
 | ROIC Retail Opportunity Investments Corp. |
| Sector: Financials | |
| SubSector: REIT - Retail | |
| MarketCap: 943.414 Millions | |
| Recent Price: 12.45 Smart Investing & Trading Score: 62 | |
| Day Percent Change: 0.73% Day Change: 0.09 | |
| Week Change: 1.63% Year-to-date Change: -11.3% | |
| ROIC Links: Profile News Message Board | |
| Charts:- Daily , Weekly | |
| Add ROIC to Watchlist: View: Get Complete ROIC Trend Analysis ➞ | |
 | ANF Abercrombie & Fitch Co. |
| Sector: Services & Goods | |
| SubSector: Apparel Stores | |
| MarketCap: 589.108 Millions | |
| Recent Price: 123.96 Smart Investing & Trading Score: 44 | |
| Day Percent Change: 2.94% Day Change: 3.55 | |
| Week Change: 1.54% Year-to-date Change: 40.5% | |
| ANF Links: Profile News Message Board | |
| Charts:- Daily , Weekly | |
| Add ANF to Watchlist: View: Get Complete ANF Trend Analysis ➞ | |
 | PETQ PetIQ, Inc. |
| Sector: Health Care | |
| SubSector: Drugs - Generic | |
| MarketCap: 587.585 Millions | |
| Recent Price: 16.78 Smart Investing & Trading Score: 64 | |
| Day Percent Change: -0.53% Day Change: -0.09 | |
| Week Change: 1.51% Year-to-date Change: -15.0% | |
| PETQ Links: Profile News Message Board | |
| Charts:- Daily , Weekly | |
| Add PETQ to Watchlist: View: Get Complete PETQ Trend Analysis ➞ | |
 | CDRE Cadre Holdings, Inc. |
| Sector: Industrials | |
| SubSector: Aerospace & Defense | |
| MarketCap: 817 Millions | |
| Recent Price: 33.62 Smart Investing & Trading Score: 57 | |
| Day Percent Change: -0.31% Day Change: -0.10 | |
| Week Change: 1.49% Year-to-date Change: 2.0% | |
| CDRE Links: Profile News Message Board | |
| Charts:- Daily , Weekly | |
| Add CDRE to Watchlist: View: Get Complete CDRE Trend Analysis ➞ | |
 | EFSC Enterprise Financial Services Corp |
| Sector: Financials | |
| SubSector: Regional - Southwest Banks | |
| MarketCap: 770.165 Millions | |
| Recent Price: 39.37 Smart Investing & Trading Score: 60 | |
| Day Percent Change: 1.03% Day Change: 0.40 | |
| Week Change: 1.47% Year-to-date Change: -11.8% | |
| EFSC Links: Profile News Message Board | |
| Charts:- Daily , Weekly | |
| Add EFSC to Watchlist: View: Get Complete EFSC Trend Analysis ➞ | |
| For tabular summary view of above stock list: Summary View ➞ 0 - 25 , 25 - 50 , 50 - 75 , 75 - 100 , 100 - 125 , 125 - 150 , 150 - 175 , 175 - 200 , 200 - 225 , 225 - 250 , 250 - 275 , 275 - 300 , 300 - 325 , 325 - 350 | ||
| Click To Change The Sort Order: By Market Cap or Company Size Performance: Year-to-date, Week and Day | |
| Select Chart Type: | ||
| Too many stocks? View smallcap stocks filtered by marketcap & sector |
| Marketcap: All SmallCap Stocks (default-no microcap), Large, Mid-Range, Small & MicroCap |
| Sector: Tech, Finance, Energy, Staples, Retail, Industrial, Materials, Utilities & Medical |
|
Best Stocks Today 12Stocks.com |
© 2024 12Stocks.com Terms & Conditions Privacy Contact Us
All Information Provided Only For Education And Not To Be Used For Investing or Trading. See Terms & Conditions


One More Thing ... Get Best Stocks Delivered Daily!
Never Ever Miss A Move With Our Top Ten Stocks Lists
Find Best Stocks In Any Market - Bull or Bear Market
Take A Peek At Our Top Ten Stocks Lists: Daily, Weekly, Year-to-Date & Top Trends
Find Best Stocks In Any Market - Bull or Bear Market
Take A Peek At Our Top Ten Stocks Lists: Daily, Weekly, Year-to-Date & Top Trends
Smallcap Stocks With Best Up Trends [0-bearish to 100-bullish]: Gannett Co[100], Pitney Bowes[100], Sprouts Farmers[100], Herbalife Nutrition[100], Gray Television[100], Surmodics [100], TPI Composites[100], Outbrain [100], Fluence Energy[100], Heartland Financial[100], Mercury General[100]
Best Smallcap Stocks Year-to-Date:
Janux [440.16%], Viking [306.02%], Longboard [258.92%], Alpine Immune[239.44%], Bakkt [187.89%], Avidity Biosciences[184.07%], Vera [170.74%], Cullinan Oncology[169.74%], Arcutis Bio[163.93%], Super Micro[161.15%], Y-mAbs [145.23%] Best Smallcap Stocks This Week:
Emergent BioSolutions[110.94%], Eyenovia [45.27%], P3 Health[38.51%], Aspen Aerogels[37.17%], Origin Materials[36.24%], Cue Biopharma[35.9%], Poseida [34.98%], Enovix [32.07%], Surmodics [31.94%], Phibro Animal[28.44%], TransMedics Group[28.2%] Best Smallcap Stocks Daily:
Emergent BioSolutions[109.84%], Aspen Aerogels[45.11%], Gannett Co[31.12%], Enovix [31.06%], Pitney Bowes[23.87%], Office Properties[22.00%], Pulmonx [20.21%], Perdoceo Education[19.25%], Origin Materials[17.75%], Benchmark Electronics[17.40%], Children s[14.21%]