
 Login Sign Up


| |||||
 |  | ||||

| 12Stocks.com Market Intelligence |
Best SmallCap Stocks
|
| In a hurry? Small Cap Stock Lists: Performance Trends Table, Stock Charts
Sort Small Cap stocks: Daily, Weekly, Year-to-Date, Market Cap & Trends. Filter Small Cap stocks list by sector: Show all, Tech, Finance, Energy, Staples, Retail, Industrial, Materials, Utilities and HealthCare Filter Small Cap stocks list by size: All Large Medium Small and MicroCap |
| 12Stocks.com Small Cap Stocks Performances & Trends Daily | |||||||||
|
|  The overall Smart Investing & Trading Score is 44 (0-bearish to 100-bullish) which puts Small Cap index in short term neutral trend. The Smart Investing & Trading Score from previous trading session is 58 and hence a deterioration of trend.
| ||||||||
Here are the Smart Investing & Trading Scores of the most requested small cap stocks at 12Stocks.com (click stock name for detailed review):
|


| 12Stocks.com: Investing in Smallcap Index with Stocks | |
|
The following table helps investors and traders sort through current performance and trends (as measured by Smart Investing & Trading Score) of various
stocks in the Smallcap Index. Quick View: Move mouse or cursor over stock symbol (ticker) to view short-term technical chart and over stock name to view long term chart. Click on  to add stock symbol to your watchlist and to add stock symbol to your watchlist and  to view watchlist. Click on any ticker or stock name for detailed market intelligence report for that stock. to view watchlist. Click on any ticker or stock name for detailed market intelligence report for that stock. |
12Stocks.com Performance of Stocks in Smallcap Index
| Ticker | Stock Name | Watchlist | Category | Recent Price | Smart Investing & Trading Score | Change % | YTD Change% |
| NWE | NorthWestern |   | Utilities | 49.91 | 93 | -1.38 | -1.93% |
| SSTK | Shutterstock | | Services & Goods | 42.18 | 52 | -1.38 | -12.63% |
| QLYS | Qualys | | Technology | 169.74 | 57 | -1.38 | -13.52% |
| RPD | Rapid7 | | Technology | 45.85 | 35 | -1.38 | -19.70% |
| RXRX | Recursion | | Health Care | 7.84 | 25 | -1.38 | -19.92% |
| XRX | Xerox | | Technology | 14.18 | 0 | -1.39 | -22.64% |
| MRNS | Marinus | | Health Care | 1.42 | 32 | -1.39 | -86.94% |
| PETQ | PetIQ | | Health Care | 16.30 | 42 | -1.39 | -17.47% |
| AMWL | American Well | | Health Care | 0.53 | 10 | -1.39 | -64.67% |
| SIGI | Selective Insurance | | Financials | 101.70 | 25 | -1.40 | 2.23% |
| PL | Planet Labs | | Industrials | 1.76 | 37 | -1.40 | -29.03% |
| OXM | Oxford Industries | | Consumer Staples | 105.75 | 83 | -1.40 | 5.75% |
| GSBC | Great Southern | | Financials | 52.91 | 93 | -1.40 | -10.85% |
| MFA | MFA Financial | | Financials | 10.54 | 18 | -1.40 | -6.48% |
| SMBK | SmartFinancial | | Financials | 20.49 | 67 | -1.40 | -16.33% |
| NSSC | Napco Security | | Services & Goods | 43.38 | 93 | -1.41 | 26.66% |
| PGEN | Precigen | | Health Care | 1.40 | 55 | -1.41 | 4.48% |
| GBCI | Glacier Bancorp | | Financials | 37.40 | 52 | -1.42 | -9.49% |
| MSGE | Madison Square | | Technology | 38.90 | 68 | -1.42 | 22.29% |
| OLO | Olo | | Technology | 4.84 | 31 | -1.43 | -15.38% |
| VCEL | Vericel | | Health Care | 45.45 | 56 | -1.43 | 27.63% |
| UIS | Unisys | | Technology | 5.46 | 35 | -1.44 | -2.85% |
| THRM | Gentherm | | Consumer Staples | 50.01 | 61 | -1.44 | -4.49% |
| EVTC | EVERTEC | | Technology | 38.27 | 60 | -1.44 | -6.52% |
| TRDA | Entrada | | Health Care | 12.36 | 35 | -1.44 | -24.68% |


| Too many stocks? View smallcap stocks filtered by marketcap & sector |
| Marketcap: All SmallCap Stocks (default-no microcap), Large, Mid-Range, Small |
| Smallcap Sector: Tech, Finance, Energy, Staples, Retail, Industrial, Materials, & Medical |
|
Get the most comprehensive stock market coverage daily at 12Stocks.com ➞ Best Stocks Today ➞ Best Stocks Weekly ➞ Best Stocks Year-to-Date ➞ Best Stocks Trends ➞  Best Stocks Today 12Stocks.com Best Nasdaq Stocks ➞ Best S&P 500 Stocks ➞ Best Tech Stocks ➞ Best Biotech Stocks ➞ |
| Detailed Overview of SmallCap Stocks |
| SmallCap Technical Overview, Leaders & Laggards, Top SmallCap ETF Funds & Detailed SmallCap Stocks List, Charts, Trends & More |
| Smallcap: Technical Analysis, Trends & YTD Performance | |
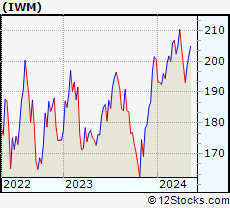
| SmallCap segment as represented by
IWM, an exchange-traded fund [ETF], holds basket of thousands of smallcap stocks from across all major sectors of the US stock market. The smallcap index (contains stocks like Riverbed & Sotheby's) is down by -2.11% and is currently underperforming the overall market by -7.27% year-to-date. Below is a quick view of technical charts and trends: | |
 IWM Weekly Chart |
|
| Long Term Trend: Good | |
| Medium Term Trend: Not Good | |
 IWM Daily Chart |
|
| Short Term Trend: Very Good | |
| Overall Trend Score: 44 | |
| YTD Performance: -2.11% | |
| **Trend Scores & Views Are Only For Educational Purposes And Not For Investing | |
| 12Stocks.com: Top Performing Small Cap Index Stocks | ||||||||||||||||||||||||||||||||||||||||||||||||
 The top performing Small Cap Index stocks year to date are
Now, more recently, over last week, the top performing Small Cap Index stocks on the move are


|
||||||||||||||||||||||||||||||||||||||||||||||||
| 12Stocks.com: Investing in Smallcap Index using Exchange Traded Funds | |
|
The following table shows list of key exchange traded funds (ETF) that
help investors track Smallcap index. The following list also includes leveraged ETF funds that track twice or thrice the daily returns of Smallcap indices. Short or inverse ETF funds move in the opposite direction to the index they track and are useful during market pullbacks or during bear markets. Quick View: Move mouse or cursor over ETF symbol (ticker) to view short-term technical chart and over ETF name to view long term chart. Click on ticker or stock name for detailed view. Click on to add stock symbol to your watchlist and to view watchlist. |
12Stocks.com List of ETFs that track Smallcap Index
| Ticker | ETF Name | Watchlist | Recent Price | Smart Investing & Trading Score | Change % | Week % | Year-to-date % |
| IWM | iShares Russell 2000 | | 196.48 | 44 | -0.61 | 1.73 | -2.11% |
| IJR | iShares Core S&P Small-Cap | | 104.86 | 78 | -0.80 | 1.59 | -3.13% |
| VTWO | Vanguard Russell 2000 ETF | | 79.45 | 63 | -0.60 | 1.75 | -2.03% |
| IWN | iShares Russell 2000 Value | | 150.18 | 68 | -0.73 | 1.62 | -3.32% |
| IWO | iShares Russell 2000 Growth | | 249.86 | 51 | -0.56 | 1.86 | -0.94% |
| IJS | iShares S&P Small-Cap 600 Value | | 96.69 | 60 | -1.04 | 1.13 | -6.19% |
| IJT | iShares S&P Small-Cap 600 Growth | | 125.06 | 63 | -0.25 | 2.33 | -0.06% |
| XSLV | PowerShares S&P SmallCap Low Volatil ETF | | 42.54 | 73 | -0.93 | 0.85 | -3.65% |
| SDD | ProShares UltraShort SmallCap600 | | 19.58 | 42 | 0.46 | -3.74 | 6.26% |
| SBB | ProShares Short SmallCap600 | | 16.50 | 40 | 0.79 | -2.02 | 3.58% |
| SMLV | SPDR SSGA US Small Cap Low Volatil ETF | | 107.33 | 73 | -1.01 | 1.17 | -4.61% |
| SAA | ProShares Ultra SmallCap600 | | 22.66 | 58 | -1.52 | 3.94 | -9.18% |
| 12Stocks.com: Charts, Trends, Fundamental Data and Performances of SmallCap Stocks | |
|
We now take in-depth look at all SmallCap stocks including charts, multi-period performances and overall trends (as measured by Smart Investing & Trading Score). One can sort SmallCap stocks (click link to choose) by Daily, Weekly and by Year-to-Date performances. Also, one can sort by size of the company or by market capitalization. |
| Select Your Default Chart Type: | |||||
| |||||
| Click on stock symbol or name for detailed view. Click on to add stock symbol to your watchlist and to view watchlist. Quick View: Move mouse or cursor over "Daily" to quickly view daily technical stock chart and over "Weekly" to view weekly technical stock chart. | |||||

 | NWE NorthWestern Corporation |
| Sector: Utilities | |
| SubSector: Diversified Utilities | |
| MarketCap: 2801.8 Millions | |
| Recent Price: 49.91 Smart Investing & Trading Score: 93 | |
| Day Percent Change: -1.38% Day Change: -0.70 | |
| Week Change: -0.44% Year-to-date Change: -1.9% | |
| NWE Links: Profile News Message Board | |
| Charts:- Daily , Weekly | |
| Add NWE to Watchlist: View: Get Complete NWE Trend Analysis ➞ | |
 | SSTK Shutterstock, Inc. |
| Sector: Services & Goods | |
| SubSector: Business Services | |
| MarketCap: 1409.62 Millions | |
| Recent Price: 42.18 Smart Investing & Trading Score: 52 | |
| Day Percent Change: -1.38% Day Change: -0.59 | |
| Week Change: 2.9% Year-to-date Change: -12.6% | |
| SSTK Links: Profile News Message Board | |
| Charts:- Daily , Weekly | |
| Add SSTK to Watchlist: View: Get Complete SSTK Trend Analysis ➞ | |
 | QLYS Qualys, Inc. |
| Sector: Technology | |
| SubSector: Application Software | |
| MarketCap: 3475.02 Millions | |
| Recent Price: 169.74 Smart Investing & Trading Score: 57 | |
| Day Percent Change: -1.38% Day Change: -2.37 | |
| Week Change: 3.78% Year-to-date Change: -13.5% | |
| QLYS Links: Profile News Message Board | |
| Charts:- Daily , Weekly | |
| Add QLYS to Watchlist: View: Get Complete QLYS Trend Analysis ➞ | |
 | RPD Rapid7, Inc. |
| Sector: Technology | |
| SubSector: Application Software | |
| MarketCap: 1981.12 Millions | |
| Recent Price: 45.85 Smart Investing & Trading Score: 35 | |
| Day Percent Change: -1.38% Day Change: -0.64 | |
| Week Change: 3.48% Year-to-date Change: -19.7% | |
| RPD Links: Profile News Message Board | |
| Charts:- Daily , Weekly | |
| Add RPD to Watchlist: View: Get Complete RPD Trend Analysis ➞ | |
 | RXRX Recursion Pharmaceuticals, Inc. |
| Sector: Health Care | |
| SubSector: Biotechnology | |
| MarketCap: 1470 Millions | |
| Recent Price: 7.84 Smart Investing & Trading Score: 25 | |
| Day Percent Change: -1.38% Day Change: -0.11 | |
| Week Change: 6.67% Year-to-date Change: -19.9% | |
| RXRX Links: Profile News Message Board | |
| Charts:- Daily , Weekly | |
| Add RXRX to Watchlist: View: Get Complete RXRX Trend Analysis ➞ | |
 | XRX Xerox Holdings Corporation |
| Sector: Technology | |
| SubSector: Information Technology Services | |
| MarketCap: 4077.48 Millions | |
| Recent Price: 14.18 Smart Investing & Trading Score: 0 | |
| Day Percent Change: -1.39% Day Change: -0.20 | |
| Week Change: -13.75% Year-to-date Change: -22.6% | |
| XRX Links: Profile News Message Board | |
| Charts:- Daily , Weekly | |
| Add XRX to Watchlist: View: Get Complete XRX Trend Analysis ➞ | |
 | MRNS Marinus Pharmaceuticals, Inc. |
| Sector: Health Care | |
| SubSector: Biotechnology | |
| MarketCap: 222.885 Millions | |
| Recent Price: 1.42 Smart Investing & Trading Score: 32 | |
| Day Percent Change: -1.39% Day Change: -0.02 | |
| Week Change: 2.9% Year-to-date Change: -86.9% | |
| MRNS Links: Profile News Message Board | |
| Charts:- Daily , Weekly | |
| Add MRNS to Watchlist: View: Get Complete MRNS Trend Analysis ➞ | |
 | PETQ PetIQ, Inc. |
| Sector: Health Care | |
| SubSector: Drugs - Generic | |
| MarketCap: 587.585 Millions | |
| Recent Price: 16.30 Smart Investing & Trading Score: 42 | |
| Day Percent Change: -1.39% Day Change: -0.23 | |
| Week Change: 0.12% Year-to-date Change: -17.5% | |
| PETQ Links: Profile News Message Board | |
| Charts:- Daily , Weekly | |
| Add PETQ to Watchlist: View: Get Complete PETQ Trend Analysis ➞ | |
 | AMWL American Well Corporation |
| Sector: Health Care | |
| SubSector: Health Information Services | |
| MarketCap: 71987 Millions | |
| Recent Price: 0.53 Smart Investing & Trading Score: 10 | |
| Day Percent Change: -1.39% Day Change: -0.01 | |
| Week Change: -3.89% Year-to-date Change: -64.7% | |
| AMWL Links: Profile News Message Board | |
| Charts:- Daily , Weekly | |
| Add AMWL to Watchlist: View: Get Complete AMWL Trend Analysis ➞ | |
 | SIGI Selective Insurance Group, Inc. |
| Sector: Financials | |
| SubSector: Property & Casualty Insurance | |
| MarketCap: 3039.12 Millions | |
| Recent Price: 101.70 Smart Investing & Trading Score: 25 | |
| Day Percent Change: -1.40% Day Change: -1.44 | |
| Week Change: -0.77% Year-to-date Change: 2.2% | |
| SIGI Links: Profile News Message Board | |
| Charts:- Daily , Weekly | |
| Add SIGI to Watchlist: View: Get Complete SIGI Trend Analysis ➞ | |
 | PL Planet Labs PBC |
| Sector: Industrials | |
| SubSector: Aerospace & Defense | |
| MarketCap: 874 Millions | |
| Recent Price: 1.76 Smart Investing & Trading Score: 37 | |
| Day Percent Change: -1.40% Day Change: -0.02 | |
| Week Change: 0.57% Year-to-date Change: -29.0% | |
| PL Links: Profile News Message Board | |
| Charts:- Daily , Weekly | |
| Add PL to Watchlist: View: Get Complete PL Trend Analysis ➞ | |
 | OXM Oxford Industries, Inc. |
| Sector: Consumer Staples | |
| SubSector: Textile - Apparel Clothing | |
| MarketCap: 647.665 Millions | |
| Recent Price: 105.75 Smart Investing & Trading Score: 83 | |
| Day Percent Change: -1.40% Day Change: -1.50 | |
| Week Change: 0.98% Year-to-date Change: 5.8% | |
| OXM Links: Profile News Message Board | |
| Charts:- Daily , Weekly | |
| Add OXM to Watchlist: View: Get Complete OXM Trend Analysis ➞ | |
 | GSBC Great Southern Bancorp, Inc. |
| Sector: Financials | |
| SubSector: Regional - Southwest Banks | |
| MarketCap: 524.765 Millions | |
| Recent Price: 52.91 Smart Investing & Trading Score: 93 | |
| Day Percent Change: -1.40% Day Change: -0.75 | |
| Week Change: 0.88% Year-to-date Change: -10.9% | |
| GSBC Links: Profile News Message Board | |
| Charts:- Daily , Weekly | |
| Add GSBC to Watchlist: View: Get Complete GSBC Trend Analysis ➞ | |
 | MFA MFA Financial, Inc. |
| Sector: Financials | |
| SubSector: Mortgage Investment | |
| MarketCap: 1869.69 Millions | |
| Recent Price: 10.54 Smart Investing & Trading Score: 18 | |
| Day Percent Change: -1.40% Day Change: -0.15 | |
| Week Change: 1.05% Year-to-date Change: -6.5% | |
| MFA Links: Profile News Message Board | |
| Charts:- Daily , Weekly | |
| Add MFA to Watchlist: View: Get Complete MFA Trend Analysis ➞ | |
 | SMBK SmartFinancial, Inc. |
| Sector: Financials | |
| SubSector: Regional - Southeast Banks | |
| MarketCap: 174.035 Millions | |
| Recent Price: 20.49 Smart Investing & Trading Score: 67 | |
| Day Percent Change: -1.40% Day Change: -0.29 | |
| Week Change: 2.96% Year-to-date Change: -16.3% | |
| SMBK Links: Profile News Message Board | |
| Charts:- Daily , Weekly | |
| Add SMBK to Watchlist: View: Get Complete SMBK Trend Analysis ➞ | |
 | NSSC Napco Security Technologies, Inc. |
| Sector: Services & Goods | |
| SubSector: Security & Protection Services | |
| MarketCap: 339.103 Millions | |
| Recent Price: 43.38 Smart Investing & Trading Score: 93 | |
| Day Percent Change: -1.41% Day Change: -0.62 | |
| Week Change: 8.4% Year-to-date Change: 26.7% | |
| NSSC Links: Profile News Message Board | |
| Charts:- Daily , Weekly | |
| Add NSSC to Watchlist: View: Get Complete NSSC Trend Analysis ➞ | |
 | PGEN Precigen, Inc. |
| Sector: Health Care | |
| SubSector: Biotechnology | |
| MarketCap: 564.785 Millions | |
| Recent Price: 1.40 Smart Investing & Trading Score: 55 | |
| Day Percent Change: -1.41% Day Change: -0.02 | |
| Week Change: 5.26% Year-to-date Change: 4.5% | |
| PGEN Links: Profile News Message Board | |
| Charts:- Daily , Weekly | |
| Add PGEN to Watchlist: View: Get Complete PGEN Trend Analysis ➞ | |
 | GBCI Glacier Bancorp, Inc. |
| Sector: Financials | |
| SubSector: Regional - Pacific Banks | |
| MarketCap: 3142.89 Millions | |
| Recent Price: 37.40 Smart Investing & Trading Score: 52 | |
| Day Percent Change: -1.42% Day Change: -0.54 | |
| Week Change: 1.25% Year-to-date Change: -9.5% | |
| GBCI Links: Profile News Message Board | |
| Charts:- Daily , Weekly | |
| Add GBCI to Watchlist: View: Get Complete GBCI Trend Analysis ➞ | |
 | MSGE Madison Square Garden Entertainment Corp. |
| Sector: Technology | |
| SubSector: Entertainment | |
| MarketCap: 18837 Millions | |
| Recent Price: 38.90 Smart Investing & Trading Score: 68 | |
| Day Percent Change: -1.42% Day Change: -0.56 | |
| Week Change: 2.91% Year-to-date Change: 22.3% | |
| MSGE Links: Profile News Message Board | |
| Charts:- Daily , Weekly | |
| Add MSGE to Watchlist: View: Get Complete MSGE Trend Analysis ➞ | |
 | OLO Olo Inc. |
| Sector: Technology | |
| SubSector: Software - Application | |
| MarketCap: 1030 Millions | |
| Recent Price: 4.84 Smart Investing & Trading Score: 31 | |
| Day Percent Change: -1.43% Day Change: -0.07 | |
| Week Change: 3.64% Year-to-date Change: -15.4% | |
| OLO Links: Profile News Message Board | |
| Charts:- Daily , Weekly | |
| Add OLO to Watchlist: View: Get Complete OLO Trend Analysis ➞ | |
 | VCEL Vericel Corporation |
| Sector: Health Care | |
| SubSector: Biotechnology | |
| MarketCap: 391.885 Millions | |
| Recent Price: 45.45 Smart Investing & Trading Score: 56 | |
| Day Percent Change: -1.43% Day Change: -0.66 | |
| Week Change: 3.91% Year-to-date Change: 27.6% | |
| VCEL Links: Profile News Message Board | |
| Charts:- Daily , Weekly | |
| Add VCEL to Watchlist: View: Get Complete VCEL Trend Analysis ➞ | |
 | UIS Unisys Corporation |
| Sector: Technology | |
| SubSector: Information Technology Services | |
| MarketCap: 803.868 Millions | |
| Recent Price: 5.46 Smart Investing & Trading Score: 35 | |
| Day Percent Change: -1.44% Day Change: -0.08 | |
| Week Change: -0.36% Year-to-date Change: -2.9% | |
| UIS Links: Profile News Message Board | |
| Charts:- Daily , Weekly | |
| Add UIS to Watchlist: View: Get Complete UIS Trend Analysis ➞ | |
 | THRM Gentherm Incorporated |
| Sector: Consumer Staples | |
| SubSector: Auto Parts | |
| MarketCap: 1032.59 Millions | |
| Recent Price: 50.01 Smart Investing & Trading Score: 61 | |
| Day Percent Change: -1.44% Day Change: -0.73 | |
| Week Change: 0.04% Year-to-date Change: -4.5% | |
| THRM Links: Profile News Message Board | |
| Charts:- Daily , Weekly | |
| Add THRM to Watchlist: View: Get Complete THRM Trend Analysis ➞ | |
 | EVTC EVERTEC, Inc. |
| Sector: Technology | |
| SubSector: Business Software & Services | |
| MarketCap: 1646.08 Millions | |
| Recent Price: 38.27 Smart Investing & Trading Score: 60 | |
| Day Percent Change: -1.44% Day Change: -0.56 | |
| Week Change: 1.27% Year-to-date Change: -6.5% | |
| EVTC Links: Profile News Message Board | |
| Charts:- Daily , Weekly | |
| Add EVTC to Watchlist: View: Get Complete EVTC Trend Analysis ➞ | |
 | TRDA Entrada Therapeutics, Inc. |
| Sector: Health Care | |
| SubSector: Biotechnology | |
| MarketCap: 481 Millions | |
| Recent Price: 12.36 Smart Investing & Trading Score: 35 | |
| Day Percent Change: -1.44% Day Change: -0.18 | |
| Week Change: 1.73% Year-to-date Change: -24.7% | |
| TRDA Links: Profile News Message Board | |
| Charts:- Daily , Weekly | |
| Add TRDA to Watchlist: View: Get Complete TRDA Trend Analysis ➞ | |
| Too many stocks? View smallcap stocks filtered by marketcap & sector |
| Marketcap: All SmallCap Stocks (default-no microcap), Large, Mid-Range, Small & MicroCap |
| Sector: Tech, Finance, Energy, Staples, Retail, Industrial, Materials, Utilities & Medical |
|
Best Stocks Today 12Stocks.com |
© 2024 12Stocks.com Terms & Conditions Privacy Contact Us
All Information Provided Only For Education And Not To Be Used For Investing or Trading. See Terms & Conditions


One More Thing ... Get Best Stocks Delivered Daily!
Never Ever Miss A Move With Our Top Ten Stocks Lists
Find Best Stocks In Any Market - Bull or Bear Market
Take A Peek At Our Top Ten Stocks Lists: Daily, Weekly, Year-to-Date & Top Trends
Find Best Stocks In Any Market - Bull or Bear Market
Take A Peek At Our Top Ten Stocks Lists: Daily, Weekly, Year-to-Date & Top Trends
Smallcap Stocks With Best Up Trends [0-bearish to 100-bullish]: B. Riley[100], Central Pacific[100], California Water[100], Cricut [100], Carpenter [100], Haemonetics [100], Sanmina [100], Trustmark [100], Comstock Resources[100], EchoStar [100], Mueller Industries[100]
Best Smallcap Stocks Year-to-Date:
CareMax [490.72%], Janux [338.34%], Viking [270.02%], Alpine Immune[239.52%], Longboard [218%], Super Micro[177%], Arcutis Bio[166.56%], Avidity Biosciences[159.79%], Vera [149.94%], Hippo [128.87%], Stoke [122.15%] Best Smallcap Stocks This Week:
Matterport [168.97%], B. Riley[73.54%], Impinj [33.73%], ProKidney [32.84%], Seres [32.65%], Riot Blockchain[32.64%], Ribbon [25.58%], Cullinan Oncology[22.92%], P.A.M. Transportation[22.85%], NuScale Power[21.44%], Hibbett Sports[21.03%] Best Smallcap Stocks Daily:
Impinj [28.65%], P.A.M. Transportation[17.95%], B. Riley[16.61%], Strategic Education[16.28%], OptiNose [14.56%], JELD-WEN Holding[11.54%], Sonic Automotive[10.86%], Intevac [10.54%], SiTime [8.84%], Noodles & [8.08%], ProKidney [7.75%]