
 Login Sign Up


| |||||
 |  | ||||

| 12Stocks.com Market Intelligence |
Best SmallCap Stocks
|
| In a hurry? Small Cap Stock Lists: Performance Trends Table, Stock Charts
Sort Small Cap stocks: Daily, Weekly, Year-to-Date, Market Cap & Trends. Filter Small Cap stocks list by sector: Show all, Tech, Finance, Energy, Staples, Retail, Industrial, Materials, Utilities and HealthCare Filter Small Cap stocks list by size: All Large Medium Small and MicroCap |
| 12Stocks.com Small Cap Stocks Performances & Trends Daily | |||||||||
|
|  The overall Smart Investing & Trading Score is 13 (0-bearish to 100-bullish) which puts Small Cap index in short term bearish trend. The Smart Investing & Trading Score from previous trading session is 26 and hence a deterioration of trend.
| ||||||||
Here are the Smart Investing & Trading Scores of the most requested small cap stocks at 12Stocks.com (click stock name for detailed review):
|


| 12Stocks.com: Investing in Smallcap Index with Stocks | |
|
The following table helps investors and traders sort through current performance and trends (as measured by Smart Investing & Trading Score) of various
stocks in the Smallcap Index. Quick View: Move mouse or cursor over stock symbol (ticker) to view short-term technical chart and over stock name to view long term chart. Click on  to add stock symbol to your watchlist and to add stock symbol to your watchlist and  to view watchlist. Click on any ticker or stock name for detailed market intelligence report for that stock. to view watchlist. Click on any ticker or stock name for detailed market intelligence report for that stock. |
12Stocks.com Performance of Stocks in Smallcap Index
| Ticker | Stock Name | Watchlist | Category | Recent Price | Smart Investing & Trading Score | Change % | YTD Change% |
| WLFC | Willis Lease |   | Transports | 50.49 | 93 | -0.96 | 3.29% |
| HBNC | Horizon Bancorp | | Financials | 11.29 | 17 | -0.96 | -21.10% |
| INMD | InMode | | Health Care | 17.45 | 17 | -0.96 | -21.54% |
| LCNB | LCNB | | Financials | 14.50 | 42 | -0.96 | -8.05% |
| TMHC | Taylor Morrison | | Industrials | 53.80 | 26 | -0.96 | 0.84% |
| HLLY | Holley | | Services & Goods | 4.11 | 0 | -0.96 | -17.22% |
| PTEN | Patterson-UTI Energy | | Energy | 11.22 | 43 | -0.97 | 3.89% |
| TK | Teekay | | Transports | 7.18 | 17 | -0.97 | 0.42% |
| SGRY | Surgery Partners | | Health Care | 24.47 | 0 | -0.97 | -23.51% |
| EMBC | Embecta | | Health Care | 10.25 | 10 | -0.97 | -46.35% |
| LNZA | LanzaTech Global | | Industrials | 3.07 | 10 | -0.97 | -37.92% |
| NAVI | Navient | | Financials | 16.10 | 7 | -0.98 | -13.53% |
| ARCH | Arch Coal | | Materials | 164.30 | 64 | -0.98 | -0.99% |
| NEXT | NextDecade | | Energy | 5.99 | 63 | -0.99 | 25.58% |
| AXL | American Axle | | Consumer Staples | 6.95 | 10 | -1.00 | -21.11% |
| ANDE | Andersons | | Consumer Staples | 56.68 | 40 | -1.00 | -1.49% |
| TROX | Tronox | | Materials | 15.92 | 36 | -1.00 | 12.43% |
| SPOK | Spok | | Technology | 14.91 | 0 | -1.00 | -3.68% |
| AMLX | Amylyx | | Health Care | 1.99 | 15 | -1.00 | -86.24% |
| SPSC | SPS Commerce | | Technology | 161.70 | 0 | -1.01 | -16.58% |
| IOVA | Iovance Bio | | Health Care | 11.80 | 41 | -1.01 | 45.14% |
| BCO | Brink s | | Services & Goods | 86.22 | 33 | -1.02 | -1.97% |
| JRVR | James River | | Financials | 8.72 | 37 | -1.02 | -5.63% |
| VRNS | Varonis Systems | | Technology | 43.51 | 10 | -1.02 | -3.91% |
| NARI | Inari Medical | | Health Care | 38.70 | 10 | -1.02 | -40.41% |


| Too many stocks? View smallcap stocks filtered by marketcap & sector |
| Marketcap: All SmallCap Stocks (default-no microcap), Large, Mid-Range, Small |
| Smallcap Sector: Tech, Finance, Energy, Staples, Retail, Industrial, Materials, & Medical |
|
Get the most comprehensive stock market coverage daily at 12Stocks.com ➞ Best Stocks Today ➞ Best Stocks Weekly ➞ Best Stocks Year-to-Date ➞ Best Stocks Trends ➞  Best Stocks Today 12Stocks.com Best Nasdaq Stocks ➞ Best S&P 500 Stocks ➞ Best Tech Stocks ➞ Best Biotech Stocks ➞ |
| Detailed Overview of SmallCap Stocks |
| SmallCap Technical Overview, Leaders & Laggards, Top SmallCap ETF Funds & Detailed SmallCap Stocks List, Charts, Trends & More |
| Smallcap: Technical Analysis, Trends & YTD Performance | |
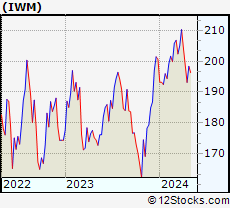
| SmallCap segment as represented by
IWM, an exchange-traded fund [ETF], holds basket of thousands of smallcap stocks from across all major sectors of the US stock market. The smallcap index (contains stocks like Riverbed & Sotheby's) is down by -3.84% and is currently underperforming the overall market by -8.25% year-to-date. Below is a quick view of technical charts and trends: | |
 IWM Weekly Chart |
|
| Long Term Trend: Good | |
| Medium Term Trend: Not Good | |
 IWM Daily Chart |
|
| Short Term Trend: Not Good | |
| Overall Trend Score: 13 | |
| YTD Performance: -3.84% | |
| **Trend Scores & Views Are Only For Educational Purposes And Not For Investing | |
| 12Stocks.com: Top Performing Small Cap Index Stocks | ||||||||||||||||||||||||||||||||||||||||||||||||
 The top performing Small Cap Index stocks year to date are
Now, more recently, over last week, the top performing Small Cap Index stocks on the move are


|
||||||||||||||||||||||||||||||||||||||||||||||||
| 12Stocks.com: Investing in Smallcap Index using Exchange Traded Funds | |
|
The following table shows list of key exchange traded funds (ETF) that
help investors track Smallcap index. The following list also includes leveraged ETF funds that track twice or thrice the daily returns of Smallcap indices. Short or inverse ETF funds move in the opposite direction to the index they track and are useful during market pullbacks or during bear markets. Quick View: Move mouse or cursor over ETF symbol (ticker) to view short-term technical chart and over ETF name to view long term chart. Click on ticker or stock name for detailed view. Click on to add stock symbol to your watchlist and to view watchlist. |
12Stocks.com List of ETFs that track Smallcap Index
| Ticker | ETF Name | Watchlist | Recent Price | Smart Investing & Trading Score | Change % | Week % | Year-to-date % |
| IWM | iShares Russell 2000 | | 193.00 | 13 | -1.06 | -2.86 | -3.84% |
| IJR | iShares Core S&P Small-Cap | | 102.13 | 7 | -0.58 | -2.28 | -5.65% |
| VTWO | Vanguard Russell 2000 ETF | | 78.05 | 13 | -1.04 | -2.83 | -3.76% |
| IWN | iShares Russell 2000 Value | | 146.03 | 0 | -0.77 | -2.89 | -5.99% |
| IWO | iShares Russell 2000 Growth | | 248.02 | 26 | -0.90 | -2.87 | -1.67% |
| IJS | iShares S&P Small-Cap 600 Value | | 94.12 | 7 | -0.57 | -2.13 | -8.68% |
| IJT | iShares S&P Small-Cap 600 Growth | | 121.84 | 13 | -1.02 | -2.36 | -2.64% |
| XSLV | PowerShares S&P SmallCap Low Volatil ETF | | 41.42 | 0 | -0.38 | -1.59 | -6.18% |
| SAA | ProShares Ultra SmallCap600 | | 21.66 | 0 | -1.19 | -3.99 | -13.19% |
| SMLV | SPDR SSGA US Small Cap Low Volatil ETF | | 103.66 | 10 | -0.17 | -1.29 | -7.87% |
| SBB | ProShares Short SmallCap600 | | 16.85 | 93 | 0.42 | 1.83 | 5.78% |
| SDD | ProShares UltraShort SmallCap600 | | 20.60 | 93 | 1.23 | 3.88 | 11.8% |
| 12Stocks.com: Charts, Trends, Fundamental Data and Performances of SmallCap Stocks | |
|
We now take in-depth look at all SmallCap stocks including charts, multi-period performances and overall trends (as measured by Smart Investing & Trading Score). One can sort SmallCap stocks (click link to choose) by Daily, Weekly and by Year-to-Date performances. Also, one can sort by size of the company or by market capitalization. |
| Select Your Default Chart Type: | |||||
| |||||
| Click on stock symbol or name for detailed view. Click on to add stock symbol to your watchlist and to view watchlist. Quick View: Move mouse or cursor over "Daily" to quickly view daily technical stock chart and over "Weekly" to view weekly technical stock chart. | |||||

 | WLFC Willis Lease Finance Corporation |
| Sector: Transports | |
| SubSector: Rental & Leasing Services | |
| MarketCap: 122.044 Millions | |
| Recent Price: 50.49 Smart Investing & Trading Score: 93 | |
| Day Percent Change: -0.96% Day Change: -0.49 | |
| Week Change: 3.17% Year-to-date Change: 3.3% | |
| WLFC Links: Profile News Message Board | |
| Charts:- Daily , Weekly | |
| Add WLFC to Watchlist: View: Get Complete WLFC Trend Analysis ➞ | |
 | HBNC Horizon Bancorp, Inc. |
| Sector: Financials | |
| SubSector: Regional - Northeast Banks | |
| MarketCap: 405.999 Millions | |
| Recent Price: 11.29 Smart Investing & Trading Score: 17 | |
| Day Percent Change: -0.96% Day Change: -0.11 | |
| Week Change: -2.25% Year-to-date Change: -21.1% | |
| HBNC Links: Profile News Message Board | |
| Charts:- Daily , Weekly | |
| Add HBNC to Watchlist: View: Get Complete HBNC Trend Analysis ➞ | |
 | INMD InMode Ltd. |
| Sector: Health Care | |
| SubSector: Medical Appliances & Equipment | |
| MarketCap: 689.08 Millions | |
| Recent Price: 17.45 Smart Investing & Trading Score: 17 | |
| Day Percent Change: -0.96% Day Change: -0.17 | |
| Week Change: -2.62% Year-to-date Change: -21.5% | |
| INMD Links: Profile News Message Board | |
| Charts:- Daily , Weekly | |
| Add INMD to Watchlist: View: Get Complete INMD Trend Analysis ➞ | |
 | LCNB LCNB Corp. |
| Sector: Financials | |
| SubSector: Regional - Mid-Atlantic Banks | |
| MarketCap: 176.759 Millions | |
| Recent Price: 14.50 Smart Investing & Trading Score: 42 | |
| Day Percent Change: -0.96% Day Change: -0.14 | |
| Week Change: 3.28% Year-to-date Change: -8.1% | |
| LCNB Links: Profile News Message Board | |
| Charts:- Daily , Weekly | |
| Add LCNB to Watchlist: View: Get Complete LCNB Trend Analysis ➞ | |
 | TMHC Taylor Morrison Home Corporation |
| Sector: Industrials | |
| SubSector: Residential Construction | |
| MarketCap: 1336.76 Millions | |
| Recent Price: 53.80 Smart Investing & Trading Score: 26 | |
| Day Percent Change: -0.96% Day Change: -0.52 | |
| Week Change: -5.27% Year-to-date Change: 0.8% | |
| TMHC Links: Profile News Message Board | |
| Charts:- Daily , Weekly | |
| Add TMHC to Watchlist: View: Get Complete TMHC Trend Analysis ➞ | |
 | HLLY Holley Inc. |
| Sector: Services & Goods | |
| SubSector: Auto Parts | |
| MarketCap: 469 Millions | |
| Recent Price: 4.11 Smart Investing & Trading Score: 0 | |
| Day Percent Change: -0.96% Day Change: -0.04 | |
| Week Change: -2.38% Year-to-date Change: -17.2% | |
| HLLY Links: Profile News Message Board | |
| Charts:- Daily , Weekly | |
| Add HLLY to Watchlist: View: Get Complete HLLY Trend Analysis ➞ | |
 | PTEN Patterson-UTI Energy, Inc. |
| Sector: Energy | |
| SubSector: Oil & Gas Drilling & Exploration | |
| MarketCap: 422.639 Millions | |
| Recent Price: 11.22 Smart Investing & Trading Score: 43 | |
| Day Percent Change: -0.97% Day Change: -0.11 | |
| Week Change: -3.94% Year-to-date Change: 3.9% | |
| PTEN Links: Profile News Message Board | |
| Charts:- Daily , Weekly | |
| Add PTEN to Watchlist: View: Get Complete PTEN Trend Analysis ➞ | |
 | TK Teekay Corporation |
| Sector: Transports | |
| SubSector: Shipping | |
| MarketCap: 257.914 Millions | |
| Recent Price: 7.18 Smart Investing & Trading Score: 17 | |
| Day Percent Change: -0.97% Day Change: -0.07 | |
| Week Change: -1.1% Year-to-date Change: 0.4% | |
| TK Links: Profile News Message Board | |
| Charts:- Daily , Weekly | |
| Add TK to Watchlist: View: Get Complete TK Trend Analysis ➞ | |
 | SGRY Surgery Partners, Inc. |
| Sector: Health Care | |
| SubSector: Hospitals | |
| MarketCap: 328.446 Millions | |
| Recent Price: 24.47 Smart Investing & Trading Score: 0 | |
| Day Percent Change: -0.97% Day Change: -0.24 | |
| Week Change: -7.06% Year-to-date Change: -23.5% | |
| SGRY Links: Profile News Message Board | |
| Charts:- Daily , Weekly | |
| Add SGRY to Watchlist: View: Get Complete SGRY Trend Analysis ➞ | |
 | EMBC Embecta Corp. |
| Sector: Health Care | |
| SubSector: Medical Instruments & Supplies | |
| MarketCap: 1260 Millions | |
| Recent Price: 10.25 Smart Investing & Trading Score: 10 | |
| Day Percent Change: -0.97% Day Change: -0.10 | |
| Week Change: 0% Year-to-date Change: -46.4% | |
| EMBC Links: Profile News Message Board | |
| Charts:- Daily , Weekly | |
| Add EMBC to Watchlist: View: Get Complete EMBC Trend Analysis ➞ | |
 | LNZA LanzaTech Global, Inc. |
| Sector: Industrials | |
| SubSector: Waste Management | |
| MarketCap: 1340 Millions | |
| Recent Price: 3.07 Smart Investing & Trading Score: 10 | |
| Day Percent Change: -0.97% Day Change: -0.03 | |
| Week Change: -0.97% Year-to-date Change: -37.9% | |
| LNZA Links: Profile News Message Board | |
| Charts:- Daily , Weekly | |
| Add LNZA to Watchlist: View: Get Complete LNZA Trend Analysis ➞ | |
 | NAVI Navient Corporation |
| Sector: Financials | |
| SubSector: Credit Services | |
| MarketCap: 1362.48 Millions | |
| Recent Price: 16.10 Smart Investing & Trading Score: 7 | |
| Day Percent Change: -0.98% Day Change: -0.16 | |
| Week Change: -2.07% Year-to-date Change: -13.5% | |
| NAVI Links: Profile News Message Board | |
| Charts:- Daily , Weekly | |
| Add NAVI to Watchlist: View: Get Complete NAVI Trend Analysis ➞ | |
 | ARCH Arch Coal, Inc. |
| Sector: Materials | |
| SubSector: Industrial Metals & Minerals | |
| MarketCap: 547.21 Millions | |
| Recent Price: 164.30 Smart Investing & Trading Score: 64 | |
| Day Percent Change: -0.98% Day Change: -1.62 | |
| Week Change: 4.73% Year-to-date Change: -1.0% | |
| ARCH Links: Profile News Message Board | |
| Charts:- Daily , Weekly | |
| Add ARCH to Watchlist: View: Get Complete ARCH Trend Analysis ➞ | |
 | NEXT NextDecade Corporation |
| Sector: Energy | |
| SubSector: Independent Oil & Gas | |
| MarketCap: 270.893 Millions | |
| Recent Price: 5.99 Smart Investing & Trading Score: 63 | |
| Day Percent Change: -0.99% Day Change: -0.06 | |
| Week Change: -3.7% Year-to-date Change: 25.6% | |
| NEXT Links: Profile News Message Board | |
| Charts:- Daily , Weekly | |
| Add NEXT to Watchlist: View: Get Complete NEXT Trend Analysis ➞ | |
 | AXL American Axle & Manufacturing Holdings, Inc. |
| Sector: Consumer Staples | |
| SubSector: Auto Parts | |
| MarketCap: 407.139 Millions | |
| Recent Price: 6.95 Smart Investing & Trading Score: 10 | |
| Day Percent Change: -1.00% Day Change: -0.07 | |
| Week Change: -1.7% Year-to-date Change: -21.1% | |
| AXL Links: Profile News Message Board | |
| Charts:- Daily , Weekly | |
| Add AXL to Watchlist: View: Get Complete AXL Trend Analysis ➞ | |
 | ANDE The Andersons, Inc. |
| Sector: Consumer Staples | |
| SubSector: Farm Products | |
| MarketCap: 630.887 Millions | |
| Recent Price: 56.68 Smart Investing & Trading Score: 40 | |
| Day Percent Change: -1.00% Day Change: -0.57 | |
| Week Change: -1.44% Year-to-date Change: -1.5% | |
| ANDE Links: Profile News Message Board | |
| Charts:- Daily , Weekly | |
| Add ANDE to Watchlist: View: Get Complete ANDE Trend Analysis ➞ | |
 | TROX Tronox Holdings plc |
| Sector: Materials | |
| SubSector: Chemicals - Major Diversified | |
| MarketCap: 807 Millions | |
| Recent Price: 15.92 Smart Investing & Trading Score: 36 | |
| Day Percent Change: -1.00% Day Change: -0.16 | |
| Week Change: -2.33% Year-to-date Change: 12.4% | |
| TROX Links: Profile News Message Board | |
| Charts:- Daily , Weekly | |
| Add TROX to Watchlist: View: Get Complete TROX Trend Analysis ➞ | |
 | SPOK Spok Holdings, Inc. |
| Sector: Technology | |
| SubSector: Wireless Communications | |
| MarketCap: 220.827 Millions | |
| Recent Price: 14.91 Smart Investing & Trading Score: 0 | |
| Day Percent Change: -1.00% Day Change: -0.15 | |
| Week Change: -3.31% Year-to-date Change: -3.7% | |
| SPOK Links: Profile News Message Board | |
| Charts:- Daily , Weekly | |
| Add SPOK to Watchlist: View: Get Complete SPOK Trend Analysis ➞ | |
 | AMLX Amylyx Pharmaceuticals, Inc. |
| Sector: Health Care | |
| SubSector: Biotechnology | |
| MarketCap: 1500 Millions | |
| Recent Price: 1.99 Smart Investing & Trading Score: 15 | |
| Day Percent Change: -1.00% Day Change: -0.02 | |
| Week Change: -5.24% Year-to-date Change: -86.2% | |
| AMLX Links: Profile News Message Board | |
| Charts:- Daily , Weekly | |
| Add AMLX to Watchlist: View: Get Complete AMLX Trend Analysis ➞ | |
 | SPSC SPS Commerce, Inc. |
| Sector: Technology | |
| SubSector: Application Software | |
| MarketCap: 1398.02 Millions | |
| Recent Price: 161.70 Smart Investing & Trading Score: 0 | |
| Day Percent Change: -1.01% Day Change: -1.65 | |
| Week Change: -4.69% Year-to-date Change: -16.6% | |
| SPSC Links: Profile News Message Board | |
| Charts:- Daily , Weekly | |
| Add SPSC to Watchlist: View: Get Complete SPSC Trend Analysis ➞ | |
 | IOVA Iovance Biotherapeutics, Inc. |
| Sector: Health Care | |
| SubSector: Biotechnology | |
| MarketCap: 3533.35 Millions | |
| Recent Price: 11.80 Smart Investing & Trading Score: 41 | |
| Day Percent Change: -1.01% Day Change: -0.12 | |
| Week Change: -4.53% Year-to-date Change: 45.1% | |
| IOVA Links: Profile News Message Board | |
| Charts:- Daily , Weekly | |
| Add IOVA to Watchlist: View: Get Complete IOVA Trend Analysis ➞ | |
 | BCO The Brink s Company |
| Sector: Services & Goods | |
| SubSector: Security & Protection Services | |
| MarketCap: 2544.73 Millions | |
| Recent Price: 86.22 Smart Investing & Trading Score: 33 | |
| Day Percent Change: -1.02% Day Change: -0.89 | |
| Week Change: -0.86% Year-to-date Change: -2.0% | |
| BCO Links: Profile News Message Board | |
| Charts:- Daily , Weekly | |
| Add BCO to Watchlist: View: Get Complete BCO Trend Analysis ➞ | |
 | JRVR James River Group Holdings, Ltd. |
| Sector: Financials | |
| SubSector: Property & Casualty Insurance | |
| MarketCap: 978.312 Millions | |
| Recent Price: 8.72 Smart Investing & Trading Score: 37 | |
| Day Percent Change: -1.02% Day Change: -0.09 | |
| Week Change: 3.07% Year-to-date Change: -5.6% | |
| JRVR Links: Profile News Message Board | |
| Charts:- Daily , Weekly | |
| Add JRVR to Watchlist: View: Get Complete JRVR Trend Analysis ➞ | |
 | VRNS Varonis Systems, Inc. |
| Sector: Technology | |
| SubSector: Technical & System Software | |
| MarketCap: 1715 Millions | |
| Recent Price: 43.51 Smart Investing & Trading Score: 10 | |
| Day Percent Change: -1.02% Day Change: -0.45 | |
| Week Change: -2.27% Year-to-date Change: -3.9% | |
| VRNS Links: Profile News Message Board | |
| Charts:- Daily , Weekly | |
| Add VRNS to Watchlist: View: Get Complete VRNS Trend Analysis ➞ | |
 | NARI Inari Medical, Inc. |
| Sector: Health Care | |
| SubSector: Medical Devices | |
| MarketCap: 33287 Millions | |
| Recent Price: 38.70 Smart Investing & Trading Score: 10 | |
| Day Percent Change: -1.02% Day Change: -0.40 | |
| Week Change: -5.1% Year-to-date Change: -40.4% | |
| NARI Links: Profile News Message Board | |
| Charts:- Daily , Weekly | |
| Add NARI to Watchlist: View: Get Complete NARI Trend Analysis ➞ | |
| Too many stocks? View smallcap stocks filtered by marketcap & sector |
| Marketcap: All SmallCap Stocks (default-no microcap), Large, Mid-Range, Small & MicroCap |
| Sector: Tech, Finance, Energy, Staples, Retail, Industrial, Materials, Utilities & Medical |
|
Best Stocks Today 12Stocks.com |
© 2024 12Stocks.com Terms & Conditions Privacy Contact Us
All Information Provided Only For Education And Not To Be Used For Investing or Trading. See Terms & Conditions


One More Thing ... Get Best Stocks Delivered Daily!
Never Ever Miss A Move With Our Top Ten Stocks Lists
Find Best Stocks In Any Market - Bull or Bear Market
Take A Peek At Our Top Ten Stocks Lists: Daily, Weekly, Year-to-Date & Top Trends
Find Best Stocks In Any Market - Bull or Bear Market
Take A Peek At Our Top Ten Stocks Lists: Daily, Weekly, Year-to-Date & Top Trends
Smallcap Stocks With Best Up Trends [0-bearish to 100-bullish]: Vanda [100], Zuora [100], ALX Oncology[100], ProKidney [100], PrimeEnergy Resources[100], IMAX [100], Envestnet [100], Intra-Cellular Therapies[100], Dorian LPG[95], Victory Capital[95], Oscar Health[95]
Best Smallcap Stocks Year-to-Date:
Agenus [552.25%], CareMax [416.49%], Janux [346.07%], Viking [257.17%], Alpine Immune[238.55%], Super Micro[237.75%], Arcutis Bio[217.34%], Longboard [177.91%], Avidity Biosciences[160.56%], Vera [158.46%], Stoke [122.81%] Best Smallcap Stocks This Week:
ProKidney [61.71%], Macatawa Bank[42.75%], Snap One[29.85%], Vanda [27.18%], ALX Oncology[23.41%], Intra-Cellular Therapies[16.41%], Escalade [13.71%], Karyopharm [13.11%], Encore Wire[10.06%], Zuora [10%], Direxion Daily[8.81%] Best Smallcap Stocks Daily:
Vanda [29.38%], Karyopharm [25.45%], Cutera [18.41%], Children s[16.46%], WW [14.10%], Lineage Cell[12.17%], Zuora [11.69%], ALX Oncology[10.97%], Marinus [10.77%], Acrivon [9.19%], Cue Biopharma[9.03%]