
 Login Sign Up


| |||||
 |  | ||||

| 12Stocks.com Market Intelligence |
Best SmallCap Stocks
|
| In a hurry? Small Cap Stock Lists: Performance Trends Table, Stock Charts
Sort Small Cap stocks: Daily, Weekly, Year-to-Date, Market Cap & Trends. Filter Small Cap stocks list by sector: Show all, Tech, Finance, Energy, Staples, Retail, Industrial, Materials, Utilities and HealthCare Filter Small Cap stocks list by size: All Large Medium Small and MicroCap |
| 12Stocks.com Small Cap Stocks Performances & Trends Daily | |||||||||
|
|  The overall Smart Investing & Trading Score is 58 (0-bearish to 100-bullish) which puts Small Cap index in short term neutral trend. The Smart Investing & Trading Score from previous trading session is 23 and hence an improvement of trend.
| ||||||||
Here are the Smart Investing & Trading Scores of the most requested small cap stocks at 12Stocks.com (click stock name for detailed review):
|


| 12Stocks.com: Investing in Smallcap Index with Stocks | |
|
The following table helps investors and traders sort through current performance and trends (as measured by Smart Investing & Trading Score) of various
stocks in the Smallcap Index. Quick View: Move mouse or cursor over stock symbol (ticker) to view short-term technical chart and over stock name to view long term chart. Click on  to add stock symbol to your watchlist and to add stock symbol to your watchlist and  to view watchlist. Click on any ticker or stock name for detailed market intelligence report for that stock. to view watchlist. Click on any ticker or stock name for detailed market intelligence report for that stock. |
12Stocks.com Performance of Stocks in Smallcap Index
| Ticker | Stock Name | Watchlist | Category | Recent Price | Smart Investing & Trading Score | Change % | YTD Change% |
| HI | Hillenbrand |   | Industrials | 48.08 | 83 | 0.12 | 0.48% |
| BLBD | Blue Bird | | Consumer Staples | 33.98 | 56 | 0.12 | 26.04% |
| GMRE | Global Medical | | Industrials | 8.20 | 42 | 0.12 | -26.13% |
| FORR | Forrester Research | | Services & Goods | 18.77 | 52 | 0.11 | -29.99% |
| AMWD | American Woodmark | | Consumer Staples | 90.30 | 17 | 0.11 | -2.75% |
| MTDR | Matador Resources | | Energy | 64.68 | 46 | 0.11 | 13.75% |
| JELD | JELD-WEN Holding | | Industrials | 18.31 | 25 | 0.11 | -3.02% |
| CVNA | Carvana Co | | Services & Goods | 71.44 | 56 | 0.11 | 34.95% |
| YOU | Clear Secure | | Technology | 17.80 | 0 | 0.11 | -14.09% |
| PWSC | PowerSchool | | Technology | 17.48 | 17 | 0.11 | -26.06% |
| LXFR | Luxfer | | Industrials | 9.79 | 53 | 0.10 | 9.51% |
| OLMA | Olema | | Health Care | 9.87 | 17 | 0.10 | -29.80% |
| EHAB | Enhabit | | Health Care | 10.26 | 61 | 0.10 | -0.87% |
| AGTI | Agiliti | | Health Care | 10.05 | 68 | 0.10 | 27.54% |
| RMBS | Rambus | | Technology | 54.73 | 0 | 0.09 | -19.81% |
| PLOW | Douglas Dynamics | | Consumer Staples | 22.02 | 35 | 0.09 | -25.81% |
| BBUC | Brookfield Business | | Financials | 21.25 | 32 | 0.09 | -8.37% |
| GT | Goodyear Tire | | Consumer Staples | 11.89 | 25 | 0.08 | -16.97% |
| HUBG | Hub Group | | Transports | 39.83 | 52 | 0.08 | -56.68% |
| AIT | Applied Industrial | | Services & Goods | 183.60 | 44 | 0.08 | 6.32% |
| EFSC | Enterprise Financial | | Financials | 39.71 | 74 | 0.08 | -11.06% |
| CABA | Cabaletta Bio | | Health Care | 13.32 | 7 | 0.08 | -41.32% |
| HCC | Warrior Met | | Materials | 67.09 | 90 | 0.07 | 10.04% |
| TRMK | Trustmark | | Financials | 26.75 | 49 | 0.07 | -4.05% |
| CCBG | Capital City | | Financials | 27.11 | 59 | 0.07 | -7.88% |


| Too many stocks? View smallcap stocks filtered by marketcap & sector |
| Marketcap: All SmallCap Stocks (default-no microcap), Large, Mid-Range, Small |
| Smallcap Sector: Tech, Finance, Energy, Staples, Retail, Industrial, Materials, & Medical |
|
Get the most comprehensive stock market coverage daily at 12Stocks.com ➞ Best Stocks Today ➞ Best Stocks Weekly ➞ Best Stocks Year-to-Date ➞ Best Stocks Trends ➞  Best Stocks Today 12Stocks.com Best Nasdaq Stocks ➞ Best S&P 500 Stocks ➞ Best Tech Stocks ➞ Best Biotech Stocks ➞ |
| Detailed Overview of SmallCap Stocks |
| SmallCap Technical Overview, Leaders & Laggards, Top SmallCap ETF Funds & Detailed SmallCap Stocks List, Charts, Trends & More |
| Smallcap: Technical Analysis, Trends & YTD Performance | |
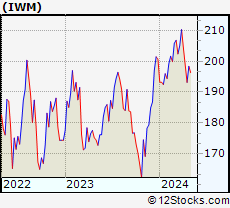
| SmallCap segment as represented by
IWM, an exchange-traded fund [ETF], holds basket of thousands of smallcap stocks from across all major sectors of the US stock market. The smallcap index (contains stocks like Riverbed & Sotheby's) is down by -2.7% and is currently underperforming the overall market by -7.09% year-to-date. Below is a quick view of technical charts and trends: | |
 IWM Weekly Chart |
|
| Long Term Trend: Good | |
| Medium Term Trend: Not Good | |
 IWM Daily Chart |
|
| Short Term Trend: Very Good | |
| Overall Trend Score: 58 | |
| YTD Performance: -2.7% | |
| **Trend Scores & Views Are Only For Educational Purposes And Not For Investing | |
| 12Stocks.com: Top Performing Small Cap Index Stocks | ||||||||||||||||||||||||||||||||||||||||||||||||
 The top performing Small Cap Index stocks year to date are
Now, more recently, over last week, the top performing Small Cap Index stocks on the move are


|
||||||||||||||||||||||||||||||||||||||||||||||||
| 12Stocks.com: Investing in Smallcap Index using Exchange Traded Funds | |
|
The following table shows list of key exchange traded funds (ETF) that
help investors track Smallcap index. The following list also includes leveraged ETF funds that track twice or thrice the daily returns of Smallcap indices. Short or inverse ETF funds move in the opposite direction to the index they track and are useful during market pullbacks or during bear markets. Quick View: Move mouse or cursor over ETF symbol (ticker) to view short-term technical chart and over ETF name to view long term chart. Click on ticker or stock name for detailed view. Click on to add stock symbol to your watchlist and to view watchlist. |
12Stocks.com List of ETFs that track Smallcap Index
| Ticker | ETF Name | Watchlist | Recent Price | Smart Investing & Trading Score | Change % | Week % | Year-to-date % |
| IWM | iShares Russell 2000 | | 195.30 | 58 | 1.12 | 1.12 | -2.7% |
| VTWO | Vanguard Russell 2000 ETF | | 78.92 | 58 | 1.08 | 1.08 | -2.69% |
| IWN | iShares Russell 2000 Value | | 149.51 | 63 | 1.17 | 1.17 | -3.75% |
| IJR | iShares Core S&P Small-Cap | | 103.47 | 45 | 0.24 | 0.24 | -4.42% |
| IWO | iShares Russell 2000 Growth | | 247.92 | 51 | 1.07 | 1.07 | -1.7% |
| IJS | iShares S&P Small-Cap 600 Value | | 96.43 | 32 | 0.86 | 0.86 | -6.44% |
| IJT | iShares S&P Small-Cap 600 Growth | | 123.36 | 70 | 0.94 | 0.94 | -1.42% |
| XSLV | PowerShares S&P SmallCap Low Volatil ETF | | 42.44 | 62 | 0.62 | 0.62 | -3.87% |
| SMLV | SPDR SSGA US Small Cap Low Volatil ETF | | 107.48 | 80 | 1.31 | 1.31 | -4.48% |
| SDD | ProShares UltraShort SmallCap600 | | 19.75 | 42 | -2.90 | -2.9 | 7.18% |
| SBB | ProShares Short SmallCap600 | | 16.62 | 42 | -1.31 | -1.31 | 4.33% |
| SAA | ProShares Ultra SmallCap600 | | 22.37 | 32 | 2.61 | 2.61 | -10.34% |
| 12Stocks.com: Charts, Trends, Fundamental Data and Performances of SmallCap Stocks | |
|
We now take in-depth look at all SmallCap stocks including charts, multi-period performances and overall trends (as measured by Smart Investing & Trading Score). One can sort SmallCap stocks (click link to choose) by Daily, Weekly and by Year-to-Date performances. Also, one can sort by size of the company or by market capitalization. |
| Select Your Default Chart Type: | |||||
| |||||
| Click on stock symbol or name for detailed view. Click on to add stock symbol to your watchlist and to view watchlist. Quick View: Move mouse or cursor over "Daily" to quickly view daily technical stock chart and over "Weekly" to view weekly technical stock chart. | |||||

 | HI Hillenbrand, Inc. |
| Sector: Industrials | |
| SubSector: Diversified Machinery | |
| MarketCap: 1389.86 Millions | |
| Recent Price: 48.08 Smart Investing & Trading Score: 83 | |
| Day Percent Change: 0.12% Day Change: 0.06 | |
| Week Change: 0.12% Year-to-date Change: 0.5% | |
| HI Links: Profile News Message Board | |
| Charts:- Daily , Weekly | |
| Add HI to Watchlist: View: Get Complete HI Trend Analysis ➞ | |
 | BLBD Blue Bird Corporation |
| Sector: Consumer Staples | |
| SubSector: Auto Manufacturers - Major | |
| MarketCap: 345.371 Millions | |
| Recent Price: 33.98 Smart Investing & Trading Score: 56 | |
| Day Percent Change: 0.12% Day Change: 0.04 | |
| Week Change: 0.12% Year-to-date Change: 26.0% | |
| BLBD Links: Profile News Message Board | |
| Charts:- Daily , Weekly | |
| Add BLBD to Watchlist: View: Get Complete BLBD Trend Analysis ➞ | |
 | GMRE Global Medical REIT Inc. |
| Sector: Industrials | |
| SubSector: Conglomerates | |
| MarketCap: 529.748 Millions | |
| Recent Price: 8.20 Smart Investing & Trading Score: 42 | |
| Day Percent Change: 0.12% Day Change: 0.01 | |
| Week Change: 0.12% Year-to-date Change: -26.1% | |
| GMRE Links: Profile News Message Board | |
| Charts:- Daily , Weekly | |
| Add GMRE to Watchlist: View: Get Complete GMRE Trend Analysis ➞ | |
 | FORR Forrester Research, Inc. |
| Sector: Services & Goods | |
| SubSector: Research Services | |
| MarketCap: 473.394 Millions | |
| Recent Price: 18.77 Smart Investing & Trading Score: 52 | |
| Day Percent Change: 0.11% Day Change: 0.02 | |
| Week Change: 0.11% Year-to-date Change: -30.0% | |
| FORR Links: Profile News Message Board | |
| Charts:- Daily , Weekly | |
| Add FORR to Watchlist: View: Get Complete FORR Trend Analysis ➞ | |
 | AMWD American Woodmark Corporation |
| Sector: Consumer Staples | |
| SubSector: Home Furnishings & Fixtures | |
| MarketCap: 958.435 Millions | |
| Recent Price: 90.30 Smart Investing & Trading Score: 17 | |
| Day Percent Change: 0.11% Day Change: 0.10 | |
| Week Change: 0.11% Year-to-date Change: -2.8% | |
| AMWD Links: Profile News Message Board | |
| Charts:- Daily , Weekly | |
| Add AMWD to Watchlist: View: Get Complete AMWD Trend Analysis ➞ | |
 | MTDR Matador Resources Company |
| Sector: Energy | |
| SubSector: Independent Oil & Gas | |
| MarketCap: 196.593 Millions | |
| Recent Price: 64.68 Smart Investing & Trading Score: 46 | |
| Day Percent Change: 0.11% Day Change: 0.07 | |
| Week Change: 0.11% Year-to-date Change: 13.8% | |
| MTDR Links: Profile News Message Board | |
| Charts:- Daily , Weekly | |
| Add MTDR to Watchlist: View: Get Complete MTDR Trend Analysis ➞ | |
 | JELD JELD-WEN Holding, Inc. |
| Sector: Industrials | |
| SubSector: General Building Materials | |
| MarketCap: 1022.53 Millions | |
| Recent Price: 18.31 Smart Investing & Trading Score: 25 | |
| Day Percent Change: 0.11% Day Change: 0.02 | |
| Week Change: 0.11% Year-to-date Change: -3.0% | |
| JELD Links: Profile News Message Board | |
| Charts:- Daily , Weekly | |
| Add JELD to Watchlist: View: Get Complete JELD Trend Analysis ➞ | |
 | CVNA Carvana Co. |
| Sector: Services & Goods | |
| SubSector: Auto Dealerships | |
| MarketCap: 5585.31 Millions | |
| Recent Price: 71.44 Smart Investing & Trading Score: 56 | |
| Day Percent Change: 0.11% Day Change: 0.08 | |
| Week Change: 0.11% Year-to-date Change: 35.0% | |
| CVNA Links: Profile News Message Board | |
| Charts:- Daily , Weekly | |
| Add CVNA to Watchlist: View: Get Complete CVNA Trend Analysis ➞ | |
 | YOU Clear Secure, Inc. |
| Sector: Technology | |
| SubSector: Software - Application | |
| MarketCap: 3510 Millions | |
| Recent Price: 17.80 Smart Investing & Trading Score: 0 | |
| Day Percent Change: 0.11% Day Change: 0.02 | |
| Week Change: 0.11% Year-to-date Change: -14.1% | |
| YOU Links: Profile News Message Board | |
| Charts:- Daily , Weekly | |
| Add YOU to Watchlist: View: Get Complete YOU Trend Analysis ➞ | |
 | PWSC PowerSchool Holdings, Inc. |
| Sector: Technology | |
| SubSector: Software - Application | |
| MarketCap: 3870 Millions | |
| Recent Price: 17.48 Smart Investing & Trading Score: 17 | |
| Day Percent Change: 0.11% Day Change: 0.02 | |
| Week Change: 0.11% Year-to-date Change: -26.1% | |
| PWSC Links: Profile News Message Board | |
| Charts:- Daily , Weekly | |
| Add PWSC to Watchlist: View: Get Complete PWSC Trend Analysis ➞ | |
 | LXFR Luxfer Holdings PLC |
| Sector: Industrials | |
| SubSector: Diversified Machinery | |
| MarketCap: 406.716 Millions | |
| Recent Price: 9.79 Smart Investing & Trading Score: 53 | |
| Day Percent Change: 0.10% Day Change: 0.01 | |
| Week Change: 0.1% Year-to-date Change: 9.5% | |
| LXFR Links: Profile News Message Board | |
| Charts:- Daily , Weekly | |
| Add LXFR to Watchlist: View: Get Complete LXFR Trend Analysis ➞ | |
 | OLMA Olema Pharmaceuticals, Inc. |
| Sector: Health Care | |
| SubSector: Biotechnology | |
| MarketCap: 17687 Millions | |
| Recent Price: 9.87 Smart Investing & Trading Score: 17 | |
| Day Percent Change: 0.10% Day Change: 0.01 | |
| Week Change: 0.1% Year-to-date Change: -29.8% | |
| OLMA Links: Profile News Message Board | |
| Charts:- Daily , Weekly | |
| Add OLMA to Watchlist: View: Get Complete OLMA Trend Analysis ➞ | |
 | EHAB Enhabit, Inc. |
| Sector: Health Care | |
| SubSector: Medical Care Facilities | |
| MarketCap: 569 Millions | |
| Recent Price: 10.26 Smart Investing & Trading Score: 61 | |
| Day Percent Change: 0.10% Day Change: 0.01 | |
| Week Change: 0.1% Year-to-date Change: -0.9% | |
| EHAB Links: Profile News Message Board | |
| Charts:- Daily , Weekly | |
| Add EHAB to Watchlist: View: Get Complete EHAB Trend Analysis ➞ | |
 | AGTI Agiliti, Inc. |
| Sector: Health Care | |
| SubSector: Health Information Services | |
| MarketCap: 2270 Millions | |
| Recent Price: 10.05 Smart Investing & Trading Score: 68 | |
| Day Percent Change: 0.10% Day Change: 0.01 | |
| Week Change: 0.1% Year-to-date Change: 27.5% | |
| AGTI Links: Profile News Message Board | |
| Charts:- Daily , Weekly | |
| Add AGTI to Watchlist: View: Get Complete AGTI Trend Analysis ➞ | |
 | RMBS Rambus Inc. |
| Sector: Technology | |
| SubSector: Semiconductor- Memory Chips | |
| MarketCap: 1296 Millions | |
| Recent Price: 54.73 Smart Investing & Trading Score: 0 | |
| Day Percent Change: 0.09% Day Change: 0.05 | |
| Week Change: 0.09% Year-to-date Change: -19.8% | |
| RMBS Links: Profile News Message Board | |
| Charts:- Daily , Weekly | |
| Add RMBS to Watchlist: View: Get Complete RMBS Trend Analysis ➞ | |
 | PLOW Douglas Dynamics, Inc. |
| Sector: Consumer Staples | |
| SubSector: Auto Parts | |
| MarketCap: 654.739 Millions | |
| Recent Price: 22.02 Smart Investing & Trading Score: 35 | |
| Day Percent Change: 0.09% Day Change: 0.02 | |
| Week Change: 0.09% Year-to-date Change: -25.8% | |
| PLOW Links: Profile News Message Board | |
| Charts:- Daily , Weekly | |
| Add PLOW to Watchlist: View: Get Complete PLOW Trend Analysis ➞ | |
 | BBUC Brookfield Business Corporation |
| Sector: Financials | |
| SubSector: Asset Management | |
| MarketCap: 1810 Millions | |
| Recent Price: 21.25 Smart Investing & Trading Score: 32 | |
| Day Percent Change: 0.09% Day Change: 0.02 | |
| Week Change: 0.09% Year-to-date Change: -8.4% | |
| BBUC Links: Profile News Message Board | |
| Charts:- Daily , Weekly | |
| Add BBUC to Watchlist: View: Get Complete BBUC Trend Analysis ➞ | |
 | GT The Goodyear Tire & Rubber Company |
| Sector: Consumer Staples | |
| SubSector: Rubber & Plastics | |
| MarketCap: 1483.7 Millions | |
| Recent Price: 11.89 Smart Investing & Trading Score: 25 | |
| Day Percent Change: 0.08% Day Change: 0.01 | |
| Week Change: 0.08% Year-to-date Change: -17.0% | |
| GT Links: Profile News Message Board | |
| Charts:- Daily , Weekly | |
| Add GT to Watchlist: View: Get Complete GT Trend Analysis ➞ | |
 | HUBG Hub Group, Inc. |
| Sector: Transports | |
| SubSector: Air Delivery & Freight Services | |
| MarketCap: 1503.88 Millions | |
| Recent Price: 39.83 Smart Investing & Trading Score: 52 | |
| Day Percent Change: 0.08% Day Change: 0.03 | |
| Week Change: 0.08% Year-to-date Change: -56.7% | |
| HUBG Links: Profile News Message Board | |
| Charts:- Daily , Weekly | |
| Add HUBG to Watchlist: View: Get Complete HUBG Trend Analysis ➞ | |
 | AIT Applied Industrial Technologies, Inc. |
| Sector: Services & Goods | |
| SubSector: Industrial Equipment Wholesale | |
| MarketCap: 1531.58 Millions | |
| Recent Price: 183.60 Smart Investing & Trading Score: 44 | |
| Day Percent Change: 0.08% Day Change: 0.15 | |
| Week Change: 0.08% Year-to-date Change: 6.3% | |
| AIT Links: Profile News Message Board | |
| Charts:- Daily , Weekly | |
| Add AIT to Watchlist: View: Get Complete AIT Trend Analysis ➞ | |
 | EFSC Enterprise Financial Services Corp |
| Sector: Financials | |
| SubSector: Regional - Southwest Banks | |
| MarketCap: 770.165 Millions | |
| Recent Price: 39.71 Smart Investing & Trading Score: 74 | |
| Day Percent Change: 0.08% Day Change: 0.03 | |
| Week Change: 0.08% Year-to-date Change: -11.1% | |
| EFSC Links: Profile News Message Board | |
| Charts:- Daily , Weekly | |
| Add EFSC to Watchlist: View: Get Complete EFSC Trend Analysis ➞ | |
 | CABA Cabaletta Bio, Inc. |
| Sector: Health Care | |
| SubSector: Biotechnology | |
| MarketCap: 222.085 Millions | |
| Recent Price: 13.32 Smart Investing & Trading Score: 7 | |
| Day Percent Change: 0.08% Day Change: 0.01 | |
| Week Change: 0.08% Year-to-date Change: -41.3% | |
| CABA Links: Profile News Message Board | |
| Charts:- Daily , Weekly | |
| Add CABA to Watchlist: View: Get Complete CABA Trend Analysis ➞ | |
 | HCC Warrior Met Coal, Inc. |
| Sector: Materials | |
| SubSector: Industrial Metals & Minerals | |
| MarketCap: 748.81 Millions | |
| Recent Price: 67.09 Smart Investing & Trading Score: 90 | |
| Day Percent Change: 0.07% Day Change: 0.05 | |
| Week Change: 0.07% Year-to-date Change: 10.0% | |
| HCC Links: Profile News Message Board | |
| Charts:- Daily , Weekly | |
| Add HCC to Watchlist: View: Get Complete HCC Trend Analysis ➞ | |
 | TRMK Trustmark Corporation |
| Sector: Financials | |
| SubSector: Regional - Southeast Banks | |
| MarketCap: 1630.15 Millions | |
| Recent Price: 26.75 Smart Investing & Trading Score: 49 | |
| Day Percent Change: 0.07% Day Change: 0.02 | |
| Week Change: 0.07% Year-to-date Change: -4.1% | |
| TRMK Links: Profile News Message Board | |
| Charts:- Daily , Weekly | |
| Add TRMK to Watchlist: View: Get Complete TRMK Trend Analysis ➞ | |
 | CCBG Capital City Bank Group, Inc. |
| Sector: Financials | |
| SubSector: Regional - Mid-Atlantic Banks | |
| MarketCap: 314.459 Millions | |
| Recent Price: 27.11 Smart Investing & Trading Score: 59 | |
| Day Percent Change: 0.07% Day Change: 0.02 | |
| Week Change: 0.07% Year-to-date Change: -7.9% | |
| CCBG Links: Profile News Message Board | |
| Charts:- Daily , Weekly | |
| Add CCBG to Watchlist: View: Get Complete CCBG Trend Analysis ➞ | |
| Too many stocks? View smallcap stocks filtered by marketcap & sector |
| Marketcap: All SmallCap Stocks (default-no microcap), Large, Mid-Range, Small & MicroCap |
| Sector: Tech, Finance, Energy, Staples, Retail, Industrial, Materials, Utilities & Medical |
|
Best Stocks Today 12Stocks.com |
© 2024 12Stocks.com Terms & Conditions Privacy Contact Us
All Information Provided Only For Education And Not To Be Used For Investing or Trading. See Terms & Conditions


One More Thing ... Get Best Stocks Delivered Daily!
Never Ever Miss A Move With Our Top Ten Stocks Lists
Find Best Stocks In Any Market - Bull or Bear Market
Take A Peek At Our Top Ten Stocks Lists: Daily, Weekly, Year-to-Date & Top Trends
Find Best Stocks In Any Market - Bull or Bear Market
Take A Peek At Our Top Ten Stocks Lists: Daily, Weekly, Year-to-Date & Top Trends
Smallcap Stocks With Best Up Trends [0-bearish to 100-bullish]: Matterport [100], Riot Blockchain[100], Ingevity [100], Vista Outdoor[100], Park National[100], Maiden [100], Amplify Energy[100], Excelerate Energy[100], Perella Weinberg[100], Zuora [100], Vertex Energy[100]
Best Smallcap Stocks Year-to-Date:
CareMax [561.86%], Janux [354.91%], Alpine Immune[239.18%], Viking [237.13%], Longboard [205.56%], Arcutis Bio[176.78%], Avidity Biosciences[167.26%], Vera [152.78%], Super Micro[152.24%], Hippo [125.58%], Y-mAbs [122.29%] Best Smallcap Stocks This Week:
Matterport [175.86%], ProKidney [33.33%], CareMax [24.9%], Riot Blockchain[23.11%], Cipher Mining[18.75%], OptiNose [15.07%], Assertio [13.48%], MicroStrategy [12.77%], Vuzix [11.57%], Seres [11.56%], Energy Vault[11.11%] Best Smallcap Stocks Daily:
Matterport [175.86%], ProKidney [33.33%], CareMax [24.90%], Riot Blockchain[23.11%], Cipher Mining[18.75%], OptiNose [15.07%], Assertio [13.48%], MicroStrategy [12.77%], Vuzix [11.57%], Seres [11.56%], Energy Vault[11.11%]