
 Login Sign Up


| |||||
 |  | ||||

| 12Stocks.com Market Intelligence |
Best SmallCap Stocks
|
| In a hurry? Small Cap Stock Lists: Performance Trends Table, Stock Charts
Sort Small Cap stocks: Daily, Weekly, Year-to-Date, Market Cap & Trends. Filter Small Cap stocks list by sector: Show all, Tech, Finance, Energy, Staples, Retail, Industrial, Materials, Utilities and HealthCare Filter Small Cap stocks list by size: All Large Medium Small and MicroCap |
| 12Stocks.com Small Cap Stocks Performances & Trends Daily | |||||||||
|
|  The overall Smart Investing & Trading Score is 23 (0-bearish to 100-bullish) which puts Small Cap index in short term bearish to neutral trend. The Smart Investing & Trading Score from previous trading session is 13 and hence an improvement of trend.
| ||||||||
Here are the Smart Investing & Trading Scores of the most requested small cap stocks at 12Stocks.com (click stock name for detailed review):
|


| 12Stocks.com: Investing in Smallcap Index with Stocks | |
|
The following table helps investors and traders sort through current performance and trends (as measured by Smart Investing & Trading Score) of various
stocks in the Smallcap Index. Quick View: Move mouse or cursor over stock symbol (ticker) to view short-term technical chart and over stock name to view long term chart. Click on  to add stock symbol to your watchlist and to add stock symbol to your watchlist and  to view watchlist. Click on any ticker or stock name for detailed market intelligence report for that stock. to view watchlist. Click on any ticker or stock name for detailed market intelligence report for that stock. |
12Stocks.com Performance of Stocks in Smallcap Index
| Ticker | Stock Name | Watchlist | Category | Recent Price | Smart Investing & Trading Score | Change % | YTD Change% |
| WD | Walker & Dunlop |   | Financials | 89.98 | 18 | -1.02 | -18.94% |
| INFU | InfuSystem | | Health Care | 7.79 | 10 | -1.02 | -26.09% |
| NKTX | Nkarta | | Health Care | 7.78 | 15 | -1.02 | 17.97% |
| LINC | Loln Educational | | Services & Goods | 9.59 | 26 | -1.03 | -4.48% |
| PAGS | PagSeguro Digital | | Financials | 11.55 | 10 | -1.03 | -7.38% |
| IHRT | iHeartMedia | | Services & Goods | 1.93 | 10 | -1.03 | -27.72% |
| ALKS | Alkermes | | Health Care | 23.76 | 10 | -1.04 | -14.35% |
| BZH | Beazer Homes | | Industrials | 25.79 | 10 | -1.04 | -23.68% |
| BLKB | Blackbaud | | Technology | 76.71 | 42 | -1.04 | -11.52% |
| PJT | PJT Partners | | Financials | 91.25 | 0 | -1.05 | -10.43% |
| FCCO | First Community | | Financials | 15.95 | 18 | -1.05 | -25.92% |
| STRO | Sutro Biopharma | | Health Care | 3.76 | 10 | -1.05 | -12.35% |
| CMC | Commercial Metals | | Materials | 55.28 | 46 | -1.06 | 10.47% |
| HEAR | Turtle Beach | | Technology | 14.88 | 36 | -1.06 | 35.89% |
| OOMA | Ooma | | Technology | 7.02 | 10 | -1.06 | -34.58% |
| BLUE | bluebird bio | | Health Care | 0.95 | 10 | -1.07 | -30.94% |
| EDIT | Editas Medicine | | Health Care | 5.55 | 10 | -1.07 | -45.21% |
| ITI | Iteris | | Technology | 4.59 | 18 | -1.08 | -11.73% |
| HY | Hyster-Yale Materials | | Consumer Staples | 58.68 | 0 | -1.08 | -5.64% |
| FOXF | Fox Factory | | Consumer Staples | 40.74 | 20 | -1.09 | -39.63% |
| OII | Oceaneering | | Energy | 22.28 | 26 | -1.11 | 4.70% |
| VHI | Valhi | | Materials | 15.10 | 54 | -1.11 | -0.59% |
| SFL | SFL | | Transports | 12.46 | 36 | -1.11 | 10.46% |
| FSLY | Fastly | | Technology | 12.38 | 10 | -1.12 | -30.45% |
| FENC | Fennec | | Health Care | 9.59 | 0 | -1.13 | -14.53% |


| Too many stocks? View smallcap stocks filtered by marketcap & sector |
| Marketcap: All SmallCap Stocks (default-no microcap), Large, Mid-Range, Small |
| Smallcap Sector: Tech, Finance, Energy, Staples, Retail, Industrial, Materials, & Medical |
|
Get the most comprehensive stock market coverage daily at 12Stocks.com ➞ Best Stocks Today ➞ Best Stocks Weekly ➞ Best Stocks Year-to-Date ➞ Best Stocks Trends ➞  Best Stocks Today 12Stocks.com Best Nasdaq Stocks ➞ Best S&P 500 Stocks ➞ Best Tech Stocks ➞ Best Biotech Stocks ➞ |
| Detailed Overview of SmallCap Stocks |
| SmallCap Technical Overview, Leaders & Laggards, Top SmallCap ETF Funds & Detailed SmallCap Stocks List, Charts, Trends & More |
| Smallcap: Technical Analysis, Trends & YTD Performance | |
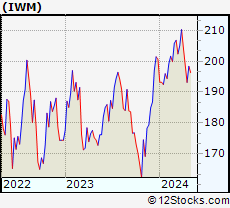
| SmallCap segment as represented by
IWM, an exchange-traded fund [ETF], holds basket of thousands of smallcap stocks from across all major sectors of the US stock market. The smallcap index (contains stocks like Riverbed & Sotheby's) is down by -3.92% and is currently underperforming the overall market by -8.11% year-to-date. Below is a quick view of technical charts and trends: | |
 IWM Weekly Chart |
|
| Long Term Trend: Not Good | |
| Medium Term Trend: Not Good | |
 IWM Daily Chart |
|
| Short Term Trend: Not Good | |
| Overall Trend Score: 23 | |
| YTD Performance: -3.92% | |
| **Trend Scores & Views Are Only For Educational Purposes And Not For Investing | |
| 12Stocks.com: Top Performing Small Cap Index Stocks | ||||||||||||||||||||||||||||||||||||||||||||||||
 The top performing Small Cap Index stocks year to date are
Now, more recently, over last week, the top performing Small Cap Index stocks on the move are


|
||||||||||||||||||||||||||||||||||||||||||||||||
| 12Stocks.com: Investing in Smallcap Index using Exchange Traded Funds | |
|
The following table shows list of key exchange traded funds (ETF) that
help investors track Smallcap index. The following list also includes leveraged ETF funds that track twice or thrice the daily returns of Smallcap indices. Short or inverse ETF funds move in the opposite direction to the index they track and are useful during market pullbacks or during bear markets. Quick View: Move mouse or cursor over ETF symbol (ticker) to view short-term technical chart and over ETF name to view long term chart. Click on ticker or stock name for detailed view. Click on to add stock symbol to your watchlist and to view watchlist. |
12Stocks.com List of ETFs that track Smallcap Index
| Ticker | ETF Name | Watchlist | Recent Price | Smart Investing & Trading Score | Change % | Week % | Year-to-date % |
| IWM | iShares Russell 2000 | | 192.84 | 23 | -0.08 | -2.94 | -3.92% |
| IJR | iShares Core S&P Small-Cap | | 102.34 | 10 | 0.21 | -2.08 | -5.46% |
| VTWO | Vanguard Russell 2000 ETF | | 77.95 | 23 | -0.13 | -2.95 | -3.88% |
| IWN | iShares Russell 2000 Value | | 146.33 | 10 | 0.21 | -2.69 | -5.79% |
| IJS | iShares S&P Small-Cap 600 Value | | 94.51 | 18 | 0.41 | -1.73 | -8.31% |
| IWO | iShares Russell 2000 Growth | | 246.94 | 36 | -0.44 | -3.3 | -2.09% |
| IJT | iShares S&P Small-Cap 600 Growth | | 121.57 | 13 | -0.22 | -2.57 | -2.85% |
| XSLV | PowerShares S&P SmallCap Low Volatil ETF | | 41.65 | 25 | 0.56 | -1.05 | -5.66% |
| SAA | ProShares Ultra SmallCap600 | | 21.62 | 10 | -0.18 | -4.17 | -13.35% |
| SMLV | SPDR SSGA US Small Cap Low Volatil ETF | | 103.83 | 10 | 0.16 | -1.13 | -7.72% |
| SBB | ProShares Short SmallCap600 | | 16.98 | 100 | 0.77 | 2.62 | 6.59% |
| SDD | ProShares UltraShort SmallCap600 | | 20.69 | 95 | 0.44 | 4.33 | 12.28% |
| 12Stocks.com: Charts, Trends, Fundamental Data and Performances of SmallCap Stocks | |
|
We now take in-depth look at all SmallCap stocks including charts, multi-period performances and overall trends (as measured by Smart Investing & Trading Score). One can sort SmallCap stocks (click link to choose) by Daily, Weekly and by Year-to-Date performances. Also, one can sort by size of the company or by market capitalization. |
| Select Your Default Chart Type: | |||||
| |||||
| Click on stock symbol or name for detailed view. Click on to add stock symbol to your watchlist and to view watchlist. Quick View: Move mouse or cursor over "Daily" to quickly view daily technical stock chart and over "Weekly" to view weekly technical stock chart. | |||||

 | WD Walker & Dunlop, Inc. |
| Sector: Financials | |
| SubSector: Mortgage Investment | |
| MarketCap: 1312.99 Millions | |
| Recent Price: 89.98 Smart Investing & Trading Score: 18 | |
| Day Percent Change: -1.02% Day Change: -0.93 | |
| Week Change: -1.04% Year-to-date Change: -18.9% | |
| WD Links: Profile News Message Board | |
| Charts:- Daily , Weekly | |
| Add WD to Watchlist: View: Get Complete WD Trend Analysis ➞ | |
 | INFU InfuSystem Holdings Inc. |
| Sector: Health Care | |
| SubSector: Medical Instruments & Supplies | |
| MarketCap: 136.76 Millions | |
| Recent Price: 7.79 Smart Investing & Trading Score: 10 | |
| Day Percent Change: -1.02% Day Change: -0.08 | |
| Week Change: -3.11% Year-to-date Change: -26.1% | |
| INFU Links: Profile News Message Board | |
| Charts:- Daily , Weekly | |
| Add INFU to Watchlist: View: Get Complete INFU Trend Analysis ➞ | |
 | NKTX Nkarta, Inc. |
| Sector: Health Care | |
| SubSector: Biotechnology | |
| MarketCap: 23487 Millions | |
| Recent Price: 7.78 Smart Investing & Trading Score: 15 | |
| Day Percent Change: -1.02% Day Change: -0.08 | |
| Week Change: -10.98% Year-to-date Change: 18.0% | |
| NKTX Links: Profile News Message Board | |
| Charts:- Daily , Weekly | |
| Add NKTX to Watchlist: View: Get Complete NKTX Trend Analysis ➞ | |
 | LINC Lincoln Educational Services Corporation |
| Sector: Services & Goods | |
| SubSector: Education & Training Services | |
| MarketCap: 59.5006 Millions | |
| Recent Price: 9.59 Smart Investing & Trading Score: 26 | |
| Day Percent Change: -1.03% Day Change: -0.10 | |
| Week Change: -2.54% Year-to-date Change: -4.5% | |
| LINC Links: Profile News Message Board | |
| Charts:- Daily , Weekly | |
| Add LINC to Watchlist: View: Get Complete LINC Trend Analysis ➞ | |
 | PAGS PagSeguro Digital Ltd. |
| Sector: Financials | |
| SubSector: Credit Services | |
| MarketCap: 6500.78 Millions | |
| Recent Price: 11.55 Smart Investing & Trading Score: 10 | |
| Day Percent Change: -1.03% Day Change: -0.12 | |
| Week Change: -8.19% Year-to-date Change: -7.4% | |
| PAGS Links: Profile News Message Board | |
| Charts:- Daily , Weekly | |
| Add PAGS to Watchlist: View: Get Complete PAGS Trend Analysis ➞ | |
 | IHRT iHeartMedia, Inc. |
| Sector: Services & Goods | |
| SubSector: Broadcasting - Radio | |
| MarketCap: 694 Millions | |
| Recent Price: 1.93 Smart Investing & Trading Score: 10 | |
| Day Percent Change: -1.03% Day Change: -0.02 | |
| Week Change: -11.47% Year-to-date Change: -27.7% | |
| IHRT Links: Profile News Message Board | |
| Charts:- Daily , Weekly | |
| Add IHRT to Watchlist: View: Get Complete IHRT Trend Analysis ➞ | |
 | ALKS Alkermes plc |
| Sector: Health Care | |
| SubSector: Biotechnology | |
| MarketCap: 2311.95 Millions | |
| Recent Price: 23.76 Smart Investing & Trading Score: 10 | |
| Day Percent Change: -1.04% Day Change: -0.25 | |
| Week Change: -2.7% Year-to-date Change: -14.4% | |
| ALKS Links: Profile News Message Board | |
| Charts:- Daily , Weekly | |
| Add ALKS to Watchlist: View: Get Complete ALKS Trend Analysis ➞ | |
 | BZH Beazer Homes USA, Inc. |
| Sector: Industrials | |
| SubSector: Residential Construction | |
| MarketCap: 180.106 Millions | |
| Recent Price: 25.79 Smart Investing & Trading Score: 10 | |
| Day Percent Change: -1.04% Day Change: -0.27 | |
| Week Change: -8.61% Year-to-date Change: -23.7% | |
| BZH Links: Profile News Message Board | |
| Charts:- Daily , Weekly | |
| Add BZH to Watchlist: View: Get Complete BZH Trend Analysis ➞ | |
 | BLKB Blackbaud, Inc. |
| Sector: Technology | |
| SubSector: Business Software & Services | |
| MarketCap: 2838.48 Millions | |
| Recent Price: 76.71 Smart Investing & Trading Score: 42 | |
| Day Percent Change: -1.04% Day Change: -0.81 | |
| Week Change: -0.01% Year-to-date Change: -11.5% | |
| BLKB Links: Profile News Message Board | |
| Charts:- Daily , Weekly | |
| Add BLKB to Watchlist: View: Get Complete BLKB Trend Analysis ➞ | |
 | PJT PJT Partners Inc. |
| Sector: Financials | |
| SubSector: Asset Management | |
| MarketCap: 1100.93 Millions | |
| Recent Price: 91.25 Smart Investing & Trading Score: 0 | |
| Day Percent Change: -1.05% Day Change: -0.97 | |
| Week Change: -1.9% Year-to-date Change: -10.4% | |
| PJT Links: Profile News Message Board | |
| Charts:- Daily , Weekly | |
| Add PJT to Watchlist: View: Get Complete PJT Trend Analysis ➞ | |
 | FCCO First Community Corporation |
| Sector: Financials | |
| SubSector: Regional - Southwest Banks | |
| MarketCap: 123.865 Millions | |
| Recent Price: 15.95 Smart Investing & Trading Score: 18 | |
| Day Percent Change: -1.05% Day Change: -0.17 | |
| Week Change: -2.57% Year-to-date Change: -25.9% | |
| FCCO Links: Profile News Message Board | |
| Charts:- Daily , Weekly | |
| Add FCCO to Watchlist: View: Get Complete FCCO Trend Analysis ➞ | |
 | STRO Sutro Biopharma, Inc. |
| Sector: Health Care | |
| SubSector: Biotechnology | |
| MarketCap: 196.485 Millions | |
| Recent Price: 3.76 Smart Investing & Trading Score: 10 | |
| Day Percent Change: -1.05% Day Change: -0.04 | |
| Week Change: -9.18% Year-to-date Change: -12.4% | |
| STRO Links: Profile News Message Board | |
| Charts:- Daily , Weekly | |
| Add STRO to Watchlist: View: Get Complete STRO Trend Analysis ➞ | |
 | CMC Commercial Metals Company |
| Sector: Materials | |
| SubSector: Steel & Iron | |
| MarketCap: 1724.78 Millions | |
| Recent Price: 55.28 Smart Investing & Trading Score: 46 | |
| Day Percent Change: -1.06% Day Change: -0.59 | |
| Week Change: 0.14% Year-to-date Change: 10.5% | |
| CMC Links: Profile News Message Board | |
| Charts:- Daily , Weekly | |
| Add CMC to Watchlist: View: Get Complete CMC Trend Analysis ➞ | |
 | HEAR Turtle Beach Corporation |
| Sector: Technology | |
| SubSector: Communication Equipment | |
| MarketCap: 73.0539 Millions | |
| Recent Price: 14.88 Smart Investing & Trading Score: 36 | |
| Day Percent Change: -1.06% Day Change: -0.16 | |
| Week Change: -8.82% Year-to-date Change: 35.9% | |
| HEAR Links: Profile News Message Board | |
| Charts:- Daily , Weekly | |
| Add HEAR to Watchlist: View: Get Complete HEAR Trend Analysis ➞ | |
 | OOMA Ooma, Inc. |
| Sector: Technology | |
| SubSector: Diversified Communication Services | |
| MarketCap: 222.064 Millions | |
| Recent Price: 7.02 Smart Investing & Trading Score: 10 | |
| Day Percent Change: -1.06% Day Change: -0.08 | |
| Week Change: -5.14% Year-to-date Change: -34.6% | |
| OOMA Links: Profile News Message Board | |
| Charts:- Daily , Weekly | |
| Add OOMA to Watchlist: View: Get Complete OOMA Trend Analysis ➞ | |
 | BLUE bluebird bio, Inc. |
| Sector: Health Care | |
| SubSector: Biotechnology | |
| MarketCap: 3365.05 Millions | |
| Recent Price: 0.95 Smart Investing & Trading Score: 10 | |
| Day Percent Change: -1.07% Day Change: -0.01 | |
| Week Change: -13.36% Year-to-date Change: -30.9% | |
| BLUE Links: Profile News Message Board | |
| Charts:- Daily , Weekly | |
| Add BLUE to Watchlist: View: Get Complete BLUE Trend Analysis ➞ | |
 | EDIT Editas Medicine, Inc. |
| Sector: Health Care | |
| SubSector: Biotechnology | |
| MarketCap: 1194.95 Millions | |
| Recent Price: 5.55 Smart Investing & Trading Score: 10 | |
| Day Percent Change: -1.07% Day Change: -0.06 | |
| Week Change: -10.63% Year-to-date Change: -45.2% | |
| EDIT Links: Profile News Message Board | |
| Charts:- Daily , Weekly | |
| Add EDIT to Watchlist: View: Get Complete EDIT Trend Analysis ➞ | |
 | ITI Iteris, Inc. |
| Sector: Technology | |
| SubSector: Communication Equipment | |
| MarketCap: 129.939 Millions | |
| Recent Price: 4.59 Smart Investing & Trading Score: 18 | |
| Day Percent Change: -1.08% Day Change: -0.05 | |
| Week Change: -2.13% Year-to-date Change: -11.7% | |
| ITI Links: Profile News Message Board | |
| Charts:- Daily , Weekly | |
| Add ITI to Watchlist: View: Get Complete ITI Trend Analysis ➞ | |
 | HY Hyster-Yale Materials Handling, Inc. |
| Sector: Consumer Staples | |
| SubSector: Trucks & Other Vehicles | |
| MarketCap: 660 Millions | |
| Recent Price: 58.68 Smart Investing & Trading Score: 0 | |
| Day Percent Change: -1.08% Day Change: -0.64 | |
| Week Change: -5.16% Year-to-date Change: -5.6% | |
| HY Links: Profile News Message Board | |
| Charts:- Daily , Weekly | |
| Add HY to Watchlist: View: Get Complete HY Trend Analysis ➞ | |
 | FOXF Fox Factory Holding Corp. |
| Sector: Consumer Staples | |
| SubSector: Recreational Vehicles | |
| MarketCap: 2093.29 Millions | |
| Recent Price: 40.74 Smart Investing & Trading Score: 20 | |
| Day Percent Change: -1.09% Day Change: -0.45 | |
| Week Change: -4.59% Year-to-date Change: -39.6% | |
| FOXF Links: Profile News Message Board | |
| Charts:- Daily , Weekly | |
| Add FOXF to Watchlist: View: Get Complete FOXF Trend Analysis ➞ | |
 | OII Oceaneering International, Inc. |
| Sector: Energy | |
| SubSector: Oil & Gas Equipment & Services | |
| MarketCap: 324.061 Millions | |
| Recent Price: 22.28 Smart Investing & Trading Score: 26 | |
| Day Percent Change: -1.11% Day Change: -0.25 | |
| Week Change: -7.05% Year-to-date Change: 4.7% | |
| OII Links: Profile News Message Board | |
| Charts:- Daily , Weekly | |
| Add OII to Watchlist: View: Get Complete OII Trend Analysis ➞ | |
 | VHI Valhi, Inc. |
| Sector: Materials | |
| SubSector: Chemicals - Major Diversified | |
| MarketCap: 394.336 Millions | |
| Recent Price: 15.10 Smart Investing & Trading Score: 54 | |
| Day Percent Change: -1.11% Day Change: -0.17 | |
| Week Change: -0.13% Year-to-date Change: -0.6% | |
| VHI Links: Profile News Message Board | |
| Charts:- Daily , Weekly | |
| Add VHI to Watchlist: View: Get Complete VHI Trend Analysis ➞ | |
 | SFL SFL Corporation Ltd. |
| Sector: Transports | |
| SubSector: Shipping | |
| MarketCap: 890.414 Millions | |
| Recent Price: 12.46 Smart Investing & Trading Score: 36 | |
| Day Percent Change: -1.11% Day Change: -0.14 | |
| Week Change: -0.95% Year-to-date Change: 10.5% | |
| SFL Links: Profile News Message Board | |
| Charts:- Daily , Weekly | |
| Add SFL to Watchlist: View: Get Complete SFL Trend Analysis ➞ | |
 | FSLY Fastly, Inc. |
| Sector: Technology | |
| SubSector: Application Software | |
| MarketCap: 1973.72 Millions | |
| Recent Price: 12.38 Smart Investing & Trading Score: 10 | |
| Day Percent Change: -1.12% Day Change: -0.14 | |
| Week Change: -9.17% Year-to-date Change: -30.5% | |
| FSLY Links: Profile News Message Board | |
| Charts:- Daily , Weekly | |
| Add FSLY to Watchlist: View: Get Complete FSLY Trend Analysis ➞ | |
 | FENC Fennec Pharmaceuticals Inc. |
| Sector: Health Care | |
| SubSector: Biotechnology | |
| MarketCap: 126.785 Millions | |
| Recent Price: 9.59 Smart Investing & Trading Score: 0 | |
| Day Percent Change: -1.13% Day Change: -0.11 | |
| Week Change: -11.45% Year-to-date Change: -14.5% | |
| FENC Links: Profile News Message Board | |
| Charts:- Daily , Weekly | |
| Add FENC to Watchlist: View: Get Complete FENC Trend Analysis ➞ | |
| Too many stocks? View smallcap stocks filtered by marketcap & sector |
| Marketcap: All SmallCap Stocks (default-no microcap), Large, Mid-Range, Small & MicroCap |
| Sector: Tech, Finance, Energy, Staples, Retail, Industrial, Materials, Utilities & Medical |
|
Best Stocks Today 12Stocks.com |
© 2024 12Stocks.com Terms & Conditions Privacy Contact Us
All Information Provided Only For Education And Not To Be Used For Investing or Trading. See Terms & Conditions


One More Thing ... Get Best Stocks Delivered Daily!
Never Ever Miss A Move With Our Top Ten Stocks Lists
Find Best Stocks In Any Market - Bull or Bear Market
Take A Peek At Our Top Ten Stocks Lists: Daily, Weekly, Year-to-Date & Top Trends
Find Best Stocks In Any Market - Bull or Bear Market
Take A Peek At Our Top Ten Stocks Lists: Daily, Weekly, Year-to-Date & Top Trends
Smallcap Stocks With Best Up Trends [0-bearish to 100-bullish]: Badger Meter[100], Cullinan Oncology[100], Oscar Health[100], NextNav [100], EchoStar [100], Victory Capital[100], Macatawa Bank[100], IMAX [100], Envestnet [100], ALX Oncology[100], Argan [95]
Best Smallcap Stocks Year-to-Date:
Agenus [500.31%], CareMax [417.53%], Janux [348.12%], Viking [247.5%], Alpine Immune[238.5%], Super Micro[226.63%], Longboard [194.76%], Arcutis Bio[192.57%], Vera [161.3%], Avidity Biosciences[154.87%], Hippo [128.32%] Best Smallcap Stocks This Week:
Macatawa Bank[44.42%], 23andMe Holding[33.3%], ProKidney [32%], Snap One[29.73%], Vertex Energy[25.96%], ALX Oncology[20.64%], Vanda [20.63%], Expensify [18.37%], Badger Meter[16.72%], ContextLogic [15%], Cullinan Oncology[13.89%] Best Smallcap Stocks Daily:
23andMe Holding[65.91%], Vertex Energy[33.78%], Zura Bio[17.20%], Badger Meter[16.65%], ContextLogic [15.81%], Expensify [15.23%], Montrose Environmental[12.84%], Vaxxinity [10.05%], Cipher Mining[8.65%], FiscalNote [8.61%], Vuzix [8.15%]