
 Login Sign Up


| |||||
 |  | ||||

| 12Stocks.com Market Intelligence |
Best SmallCap Stocks
|
| In a hurry? Small Cap Stock Lists: Performance Trends Table, Stock Charts
Sort Small Cap stocks: Daily, Weekly, Year-to-Date, Market Cap & Trends. Filter Small Cap stocks list by sector: Show all, Tech, Finance, Energy, Staples, Retail, Industrial, Materials, Utilities and HealthCare Filter Small Cap stocks list by size: All Large Medium Small and MicroCap |
| 12Stocks.com Small Cap Stocks Performances & Trends Daily | |||||||||
|
|  The overall Smart Investing & Trading Score is 58 (0-bearish to 100-bullish) which puts Small Cap index in short term neutral trend. The Smart Investing & Trading Score from previous trading session is 63 and hence a deterioration of trend.
| ||||||||
Here are the Smart Investing & Trading Scores of the most requested small cap stocks at 12Stocks.com (click stock name for detailed review):
|


| 12Stocks.com: Investing in Smallcap Index with Stocks | |
|
The following table helps investors and traders sort through current performance and trends (as measured by Smart Investing & Trading Score) of various
stocks in the Smallcap Index. Quick View: Move mouse or cursor over stock symbol (ticker) to view short-term technical chart and over stock name to view long term chart. Click on  to add stock symbol to your watchlist and to add stock symbol to your watchlist and  to view watchlist. Click on any ticker or stock name for detailed market intelligence report for that stock. to view watchlist. Click on any ticker or stock name for detailed market intelligence report for that stock. |
12Stocks.com Performance of Stocks in Smallcap Index
| Ticker | Stock Name | Watchlist | Category | Recent Price | Smart Investing & Trading Score | Change % | YTD Change% |
| IGT | Game |   | Services & Goods | 20.54 | 49 | 0.15 | -25.06% |
| JBSS | John B. | | Consumer Staples | 100.35 | 49 | 0.15 | -2.61% |
| BJRI | BJ s | | Services & Goods | 32.64 | 37 | 0.15 | -9.36% |
| SFM | Sprouts Farmers | | Services & Goods | 65.59 | 76 | 0.15 | 36.33% |
| AMPL | Amplitude | | Technology | 9.84 | 42 | 0.15 | -22.92% |
| IPI | Intrepid Potash | | Materials | 19.73 | 61 | 0.15 | -17.41% |
| REZI | Resideo | | Services & Goods | 19.81 | 36 | 0.15 | 5.26% |
| NREF | NexPoint Real | | Financials | 13.15 | 17 | 0.15 | -16.43% |
| DUOL | Duolingo | | Technology | 220.79 | 83 | 0.15 | -3.10% |
| PLCE | Children s | | Services & Goods | 7.17 | 15 | 0.14 | -69.12% |
| RMBS | Rambus | | Technology | 56.52 | 42 | 0.14 | -17.19% |
| KRG | Kite Realty | | Financials | 21.72 | 100 | 0.14 | -4.99% |
| MCBC | Macatawa Bank | | Financials | 14.30 | 76 | 0.14 | 26.77% |
| CHMG | Chemung Financial | | Financials | 43.80 | 67 | 0.14 | -12.05% |
| FLYW | Flywire | | Technology | 21.43 | 52 | 0.14 | -8.54% |
| MUR | Murphy Oil | | Energy | 46.22 | 61 | 0.13 | 8.35% |
| BHE | Benchmark Electronics | | Technology | 30.59 | 100 | 0.13 | 10.67% |
| MYRG | MYR Group | | Industrials | 164.60 | 68 | 0.13 | 13.81% |
| FG | F&G Annuities | | Financials | 38.20 | 49 | 0.13 | -17.15% |
| ORC | Orchid Island | | Financials | 8.63 | 75 | 0.12 | 2.37% |
| BASE | Couchbase | | Technology | 24.12 | 25 | 0.12 | 5.84% |
| TRS | TriMas | | Industrials | 26.28 | 73 | 0.11 | 3.75% |
| KURA | Kura Oncology | | Health Care | 18.75 | 37 | 0.11 | 30.39% |
| ARQT | Arcutis Bio | | Health Care | 8.75 | 46 | 0.11 | 170.90% |
| RDN | Radian Group | | Financials | 30.63 | 70 | 0.10 | 7.29% |


| Too many stocks? View smallcap stocks filtered by marketcap & sector |
| Marketcap: All SmallCap Stocks (default-no microcap), Large, Mid-Range, Small |
| Smallcap Sector: Tech, Finance, Energy, Staples, Retail, Industrial, Materials, & Medical |
|
Get the most comprehensive stock market coverage daily at 12Stocks.com ➞ Best Stocks Today ➞ Best Stocks Weekly ➞ Best Stocks Year-to-Date ➞ Best Stocks Trends ➞  Best Stocks Today 12Stocks.com Best Nasdaq Stocks ➞ Best S&P 500 Stocks ➞ Best Tech Stocks ➞ Best Biotech Stocks ➞ |
| Detailed Overview of SmallCap Stocks |
| SmallCap Technical Overview, Leaders & Laggards, Top SmallCap ETF Funds & Detailed SmallCap Stocks List, Charts, Trends & More |
| Smallcap: Technical Analysis, Trends & YTD Performance | |
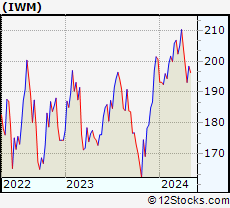
| SmallCap segment as represented by
IWM, an exchange-traded fund [ETF], holds basket of thousands of smallcap stocks from across all major sectors of the US stock market. The smallcap index (contains stocks like Riverbed & Sotheby's) is down by -1.51% and is currently underperforming the overall market by -7.17% year-to-date. Below is a quick view of technical charts and trends: | |
 IWM Weekly Chart |
|
| Long Term Trend: Good | |
| Medium Term Trend: Not Good | |
 IWM Daily Chart |
|
| Short Term Trend: Very Good | |
| Overall Trend Score: 58 | |
| YTD Performance: -1.51% | |
| **Trend Scores & Views Are Only For Educational Purposes And Not For Investing | |
| 12Stocks.com: Top Performing Small Cap Index Stocks | ||||||||||||||||||||||||||||||||||||||||||||||||
 The top performing Small Cap Index stocks year to date are
Now, more recently, over last week, the top performing Small Cap Index stocks on the move are


|
||||||||||||||||||||||||||||||||||||||||||||||||
| 12Stocks.com: Investing in Smallcap Index using Exchange Traded Funds | |
|
The following table shows list of key exchange traded funds (ETF) that
help investors track Smallcap index. The following list also includes leveraged ETF funds that track twice or thrice the daily returns of Smallcap indices. Short or inverse ETF funds move in the opposite direction to the index they track and are useful during market pullbacks or during bear markets. Quick View: Move mouse or cursor over ETF symbol (ticker) to view short-term technical chart and over ETF name to view long term chart. Click on ticker or stock name for detailed view. Click on to add stock symbol to your watchlist and to view watchlist. |
12Stocks.com List of ETFs that track Smallcap Index
| Ticker | ETF Name | Watchlist | Recent Price | Smart Investing & Trading Score | Change % | Week % | Year-to-date % |
| IWM | iShares Russell 2000 | | 197.68 | 58 | -0.45 | 2.35 | -1.51% |
| IJR | iShares Core S&P Small-Cap | | 105.71 | 85 | -0.24 | 2.41 | -2.35% |
| VTWO | Vanguard Russell 2000 ETF | | 79.93 | 63 | -0.45 | 2.37 | -1.44% |
| IWN | iShares Russell 2000 Value | | 151.28 | 75 | -0.30 | 2.37 | -2.61% |
| IWO | iShares Russell 2000 Growth | | 251.27 | 58 | -0.44 | 2.44 | -0.38% |
| IJS | iShares S&P Small-Cap 600 Value | | 97.71 | 60 | -0.43 | 2.2 | -5.2% |
| IJT | iShares S&P Small-Cap 600 Growth | | 125.37 | 70 | -0.28 | 2.59 | 0.18% |
| XSLV | PowerShares S&P SmallCap Low Volatil ETF | | 42.94 | 73 | -0.26 | 1.8 | -2.74% |
| SBB | ProShares Short SmallCap600 | | 16.37 | 33 | -0.02 | -2.79 | 2.76% |
| SMLV | SPDR SSGA US Small Cap Low Volatil ETF | | 108.43 | 73 | -0.31 | 2.21 | -3.63% |
| SAA | ProShares Ultra SmallCap600 | | 23.01 | 58 | -0.60 | 5.55 | -7.78% |
| SDD | ProShares UltraShort SmallCap600 | | 19.49 | 42 | 1.35 | -4.18 | 5.77% |
| 12Stocks.com: Charts, Trends, Fundamental Data and Performances of SmallCap Stocks | |
|
We now take in-depth look at all SmallCap stocks including charts, multi-period performances and overall trends (as measured by Smart Investing & Trading Score). One can sort SmallCap stocks (click link to choose) by Daily, Weekly and by Year-to-Date performances. Also, one can sort by size of the company or by market capitalization. |
| Select Your Default Chart Type: | |||||
| |||||
| Click on stock symbol or name for detailed view. Click on to add stock symbol to your watchlist and to view watchlist. Quick View: Move mouse or cursor over "Daily" to quickly view daily technical stock chart and over "Weekly" to view weekly technical stock chart. | |||||

 | IGT International Game Technology PLC |
| Sector: Services & Goods | |
| SubSector: Gaming Activities | |
| MarketCap: 1030.89 Millions | |
| Recent Price: 20.54 Smart Investing & Trading Score: 49 | |
| Day Percent Change: 0.15% Day Change: 0.03 | |
| Week Change: 1.68% Year-to-date Change: -25.1% | |
| IGT Links: Profile News Message Board | |
| Charts:- Daily , Weekly | |
| Add IGT to Watchlist: View: Get Complete IGT Trend Analysis ➞ | |
 | JBSS John B. Sanfilippo & Son, Inc. |
| Sector: Consumer Staples | |
| SubSector: Processed & Packaged Goods | |
| MarketCap: 899.748 Millions | |
| Recent Price: 100.35 Smart Investing & Trading Score: 49 | |
| Day Percent Change: 0.15% Day Change: 0.15 | |
| Week Change: 2.22% Year-to-date Change: -2.6% | |
| JBSS Links: Profile News Message Board | |
| Charts:- Daily , Weekly | |
| Add JBSS to Watchlist: View: Get Complete JBSS Trend Analysis ➞ | |
 | BJRI BJ s Restaurants, Inc. |
| Sector: Services & Goods | |
| SubSector: Restaurants | |
| MarketCap: 183.67 Millions | |
| Recent Price: 32.64 Smart Investing & Trading Score: 37 | |
| Day Percent Change: 0.15% Day Change: 0.05 | |
| Week Change: 1.68% Year-to-date Change: -9.4% | |
| BJRI Links: Profile News Message Board | |
| Charts:- Daily , Weekly | |
| Add BJRI to Watchlist: View: Get Complete BJRI Trend Analysis ➞ | |
 | SFM Sprouts Farmers Market, Inc. |
| Sector: Services & Goods | |
| SubSector: Grocery Stores | |
| MarketCap: 2495.85 Millions | |
| Recent Price: 65.59 Smart Investing & Trading Score: 76 | |
| Day Percent Change: 0.15% Day Change: 0.10 | |
| Week Change: 0.68% Year-to-date Change: 36.3% | |
| SFM Links: Profile News Message Board | |
| Charts:- Daily , Weekly | |
| Add SFM to Watchlist: View: Get Complete SFM Trend Analysis ➞ | |
 | AMPL Amplitude, Inc. |
| Sector: Technology | |
| SubSector: Software - Application | |
| MarketCap: 1320 Millions | |
| Recent Price: 9.84 Smart Investing & Trading Score: 42 | |
| Day Percent Change: 0.15% Day Change: 0.02 | |
| Week Change: 3.96% Year-to-date Change: -22.9% | |
| AMPL Links: Profile News Message Board | |
| Charts:- Daily , Weekly | |
| Add AMPL to Watchlist: View: Get Complete AMPL Trend Analysis ➞ | |
 | IPI Intrepid Potash, Inc. |
| Sector: Materials | |
| SubSector: Agricultural Chemicals | |
| MarketCap: 160.329 Millions | |
| Recent Price: 19.73 Smart Investing & Trading Score: 61 | |
| Day Percent Change: 0.15% Day Change: 0.03 | |
| Week Change: 0.36% Year-to-date Change: -17.4% | |
| IPI Links: Profile News Message Board | |
| Charts:- Daily , Weekly | |
| Add IPI to Watchlist: View: Get Complete IPI Trend Analysis ➞ | |
 | REZI Resideo Technologies, Inc. |
| Sector: Services & Goods | |
| SubSector: Security & Protection Services | |
| MarketCap: 712.603 Millions | |
| Recent Price: 19.81 Smart Investing & Trading Score: 36 | |
| Day Percent Change: 0.15% Day Change: 0.03 | |
| Week Change: 2.8% Year-to-date Change: 5.3% | |
| REZI Links: Profile News Message Board | |
| Charts:- Daily , Weekly | |
| Add REZI to Watchlist: View: Get Complete REZI Trend Analysis ➞ | |
 | NREF NexPoint Real Estate Finance, Inc. |
| Sector: Financials | |
| SubSector: REIT Diversified | |
| MarketCap: 97267 Millions | |
| Recent Price: 13.15 Smart Investing & Trading Score: 17 | |
| Day Percent Change: 0.15% Day Change: 0.02 | |
| Week Change: 0.42% Year-to-date Change: -16.4% | |
| NREF Links: Profile News Message Board | |
| Charts:- Daily , Weekly | |
| Add NREF to Watchlist: View: Get Complete NREF Trend Analysis ➞ | |
 | DUOL Duolingo, Inc. |
| Sector: Technology | |
| SubSector: Software - Application | |
| MarketCap: 6070 Millions | |
| Recent Price: 220.79 Smart Investing & Trading Score: 83 | |
| Day Percent Change: 0.15% Day Change: 0.32 | |
| Week Change: 10.31% Year-to-date Change: -3.1% | |
| DUOL Links: Profile News Message Board | |
| Charts:- Daily , Weekly | |
| Add DUOL to Watchlist: View: Get Complete DUOL Trend Analysis ➞ | |
 | PLCE The Children s Place, Inc. |
| Sector: Services & Goods | |
| SubSector: Apparel Stores | |
| MarketCap: 303.608 Millions | |
| Recent Price: 7.17 Smart Investing & Trading Score: 15 | |
| Day Percent Change: 0.14% Day Change: 0.01 | |
| Week Change: -13.09% Year-to-date Change: -69.1% | |
| PLCE Links: Profile News Message Board | |
| Charts:- Daily , Weekly | |
| Add PLCE to Watchlist: View: Get Complete PLCE Trend Analysis ➞ | |
 | RMBS Rambus Inc. |
| Sector: Technology | |
| SubSector: Semiconductor- Memory Chips | |
| MarketCap: 1296 Millions | |
| Recent Price: 56.52 Smart Investing & Trading Score: 42 | |
| Day Percent Change: 0.14% Day Change: 0.08 | |
| Week Change: 3.37% Year-to-date Change: -17.2% | |
| RMBS Links: Profile News Message Board | |
| Charts:- Daily , Weekly | |
| Add RMBS to Watchlist: View: Get Complete RMBS Trend Analysis ➞ | |
 | KRG Kite Realty Group Trust |
| Sector: Financials | |
| SubSector: REIT - Retail | |
| MarketCap: 1030.14 Millions | |
| Recent Price: 21.72 Smart Investing & Trading Score: 100 | |
| Day Percent Change: 0.14% Day Change: 0.03 | |
| Week Change: 3.97% Year-to-date Change: -5.0% | |
| KRG Links: Profile News Message Board | |
| Charts:- Daily , Weekly | |
| Add KRG to Watchlist: View: Get Complete KRG Trend Analysis ➞ | |
 | MCBC Macatawa Bank Corporation |
| Sector: Financials | |
| SubSector: Regional - Midwest Banks | |
| MarketCap: 264.37 Millions | |
| Recent Price: 14.30 Smart Investing & Trading Score: 76 | |
| Day Percent Change: 0.14% Day Change: 0.02 | |
| Week Change: 1.2% Year-to-date Change: 26.8% | |
| MCBC Links: Profile News Message Board | |
| Charts:- Daily , Weekly | |
| Add MCBC to Watchlist: View: Get Complete MCBC Trend Analysis ➞ | |
 | CHMG Chemung Financial Corporation |
| Sector: Financials | |
| SubSector: Regional - Pacific Banks | |
| MarketCap: 142.229 Millions | |
| Recent Price: 43.80 Smart Investing & Trading Score: 67 | |
| Day Percent Change: 0.14% Day Change: 0.06 | |
| Week Change: 0.69% Year-to-date Change: -12.1% | |
| CHMG Links: Profile News Message Board | |
| Charts:- Daily , Weekly | |
| Add CHMG to Watchlist: View: Get Complete CHMG Trend Analysis ➞ | |
 | FLYW Flywire Corporation |
| Sector: Technology | |
| SubSector: Software - Infrastructure | |
| MarketCap: 3390 Millions | |
| Recent Price: 21.43 Smart Investing & Trading Score: 52 | |
| Day Percent Change: 0.14% Day Change: 0.03 | |
| Week Change: 1.56% Year-to-date Change: -8.5% | |
| FLYW Links: Profile News Message Board | |
| Charts:- Daily , Weekly | |
| Add FLYW to Watchlist: View: Get Complete FLYW Trend Analysis ➞ | |
 | MUR Murphy Oil Corporation |
| Sector: Energy | |
| SubSector: Independent Oil & Gas | |
| MarketCap: 985.993 Millions | |
| Recent Price: 46.22 Smart Investing & Trading Score: 61 | |
| Day Percent Change: 0.13% Day Change: 0.06 | |
| Week Change: 0.5% Year-to-date Change: 8.4% | |
| MUR Links: Profile News Message Board | |
| Charts:- Daily , Weekly | |
| Add MUR to Watchlist: View: Get Complete MUR Trend Analysis ➞ | |
 | BHE Benchmark Electronics, Inc. |
| Sector: Technology | |
| SubSector: Printed Circuit Boards | |
| MarketCap: 766.835 Millions | |
| Recent Price: 30.59 Smart Investing & Trading Score: 100 | |
| Day Percent Change: 0.13% Day Change: 0.04 | |
| Week Change: 3.24% Year-to-date Change: 10.7% | |
| BHE Links: Profile News Message Board | |
| Charts:- Daily , Weekly | |
| Add BHE to Watchlist: View: Get Complete BHE Trend Analysis ➞ | |
 | MYRG MYR Group Inc. |
| Sector: Industrials | |
| SubSector: General Contractors | |
| MarketCap: 405.363 Millions | |
| Recent Price: 164.60 Smart Investing & Trading Score: 68 | |
| Day Percent Change: 0.13% Day Change: 0.22 | |
| Week Change: 3.71% Year-to-date Change: 13.8% | |
| MYRG Links: Profile News Message Board | |
| Charts:- Daily , Weekly | |
| Add MYRG to Watchlist: View: Get Complete MYRG Trend Analysis ➞ | |
 | FG F&G Annuities & Life, Inc. |
| Sector: Financials | |
| SubSector: Insurance - Life | |
| MarketCap: 2960 Millions | |
| Recent Price: 38.20 Smart Investing & Trading Score: 49 | |
| Day Percent Change: 0.13% Day Change: 0.05 | |
| Week Change: 4.6% Year-to-date Change: -17.2% | |
| FG Links: Profile News Message Board | |
| Charts:- Daily , Weekly | |
| Add FG to Watchlist: View: Get Complete FG Trend Analysis ➞ | |
 | ORC Orchid Island Capital, Inc. |
| Sector: Financials | |
| SubSector: Mortgage Investment | |
| MarketCap: 212.339 Millions | |
| Recent Price: 8.63 Smart Investing & Trading Score: 75 | |
| Day Percent Change: 0.12% Day Change: 0.01 | |
| Week Change: 4.48% Year-to-date Change: 2.4% | |
| ORC Links: Profile News Message Board | |
| Charts:- Daily , Weekly | |
| Add ORC to Watchlist: View: Get Complete ORC Trend Analysis ➞ | |
 | BASE Couchbase, Inc. |
| Sector: Technology | |
| SubSector: Software - Infrastructure | |
| MarketCap: 724 Millions | |
| Recent Price: 24.12 Smart Investing & Trading Score: 25 | |
| Day Percent Change: 0.12% Day Change: 0.03 | |
| Week Change: 5.33% Year-to-date Change: 5.8% | |
| BASE Links: Profile News Message Board | |
| Charts:- Daily , Weekly | |
| Add BASE to Watchlist: View: Get Complete BASE Trend Analysis ➞ | |
 | TRS TriMas Corporation |
| Sector: Industrials | |
| SubSector: Industrial Equipment & Components | |
| MarketCap: 963.509 Millions | |
| Recent Price: 26.28 Smart Investing & Trading Score: 73 | |
| Day Percent Change: 0.11% Day Change: 0.03 | |
| Week Change: 0.84% Year-to-date Change: 3.8% | |
| TRS Links: Profile News Message Board | |
| Charts:- Daily , Weekly | |
| Add TRS to Watchlist: View: Get Complete TRS Trend Analysis ➞ | |
 | KURA Kura Oncology, Inc. |
| Sector: Health Care | |
| SubSector: Biotechnology | |
| MarketCap: 401.885 Millions | |
| Recent Price: 18.75 Smart Investing & Trading Score: 37 | |
| Day Percent Change: 0.11% Day Change: 0.02 | |
| Week Change: 6.96% Year-to-date Change: 30.4% | |
| KURA Links: Profile News Message Board | |
| Charts:- Daily , Weekly | |
| Add KURA to Watchlist: View: Get Complete KURA Trend Analysis ➞ | |
 | ARQT Arcutis Biotherapeutics, Inc. |
| Sector: Health Care | |
| SubSector: Biotechnology | |
| MarketCap: 12787 Millions | |
| Recent Price: 8.75 Smart Investing & Trading Score: 46 | |
| Day Percent Change: 0.11% Day Change: 0.01 | |
| Week Change: -3.74% Year-to-date Change: 170.9% | |
| ARQT Links: Profile News Message Board | |
| Charts:- Daily , Weekly | |
| Add ARQT to Watchlist: View: Get Complete ARQT Trend Analysis ➞ | |
 | RDN Radian Group Inc. |
| Sector: Financials | |
| SubSector: Property & Casualty Insurance | |
| MarketCap: 2950.12 Millions | |
| Recent Price: 30.63 Smart Investing & Trading Score: 70 | |
| Day Percent Change: 0.10% Day Change: 0.03 | |
| Week Change: 3.27% Year-to-date Change: 7.3% | |
| RDN Links: Profile News Message Board | |
| Charts:- Daily , Weekly | |
| Add RDN to Watchlist: View: Get Complete RDN Trend Analysis ➞ | |
| Too many stocks? View smallcap stocks filtered by marketcap & sector |
| Marketcap: All SmallCap Stocks (default-no microcap), Large, Mid-Range, Small & MicroCap |
| Sector: Tech, Finance, Energy, Staples, Retail, Industrial, Materials, Utilities & Medical |
|
Best Stocks Today 12Stocks.com |
© 2024 12Stocks.com Terms & Conditions Privacy Contact Us
All Information Provided Only For Education And Not To Be Used For Investing or Trading. See Terms & Conditions


One More Thing ... Get Best Stocks Delivered Daily!
Never Ever Miss A Move With Our Top Ten Stocks Lists
Find Best Stocks In Any Market - Bull or Bear Market
Take A Peek At Our Top Ten Stocks Lists: Daily, Weekly, Year-to-Date & Top Trends
Find Best Stocks In Any Market - Bull or Bear Market
Take A Peek At Our Top Ten Stocks Lists: Daily, Weekly, Year-to-Date & Top Trends
Smallcap Stocks With Best Up Trends [0-bearish to 100-bullish]: B. Riley[100], Ribbon [100], Group 1[100], Trustmark [100], MBIA [100], Integer [100], EchoStar [100], Comstock Resources[100], Vishay Inter[100], First Ban[100], Jamf Holding[100]
Best Smallcap Stocks Year-to-Date:
CareMax [574.23%], Janux [352.07%], Viking [249.65%], Alpine Immune[239.13%], Longboard [223.4%], Avidity Biosciences[177.71%], Arcutis Bio[170.9%], Super Micro[165.5%], Vera [149.61%], Hippo [130.79%], Y-mAbs [124.19%] Best Smallcap Stocks This Week:
Matterport [166.09%], B. Riley[48.82%], Seres [30.29%], Riot Blockchain[30.12%], CareMax [27.24%], Ribbon [25.97%], ProKidney [23.28%], SoundHound AI[22.54%], Cipher Mining[22.14%], Hibbett Sports[21.61%], Cullinan Oncology[20.69%] Best Smallcap Stocks Daily:
B. Riley[36.97%], Ribbon [26.46%], Babcock & Wilcox Enterprises[15.57%], Cullinan Oncology[13.55%], Amneal [12.04%], Comtech Tele[10.76%], Innodata [10.28%], Gritstone Oncology[10.06%], Navitas Semiconductor[8.83%], Eyenovia [8.68%], K12 [8.64%]