
 Login Sign Up


| |||||
 |  | ||||

| 12Stocks.com Market Intelligence |
Best SmallCap Stocks
|
| In a hurry? Small Cap Stock Lists: Performance Trends Table, Stock Charts
Sort Small Cap stocks: Daily, Weekly, Year-to-Date, Market Cap & Trends. Filter Small Cap stocks list by sector: Show all, Tech, Finance, Energy, Staples, Retail, Industrial, Materials, Utilities and HealthCare Filter Small Cap stocks list by size: All Large Medium Small and MicroCap |
| 12Stocks.com Small Cap Stocks Performances & Trends Daily | |||||||||
|
|  The overall Smart Investing & Trading Score is 49 (0-bearish to 100-bullish) which puts Small Cap index in short term neutral trend. The Smart Investing & Trading Score from previous trading session is 14 and hence an improvement of trend.
| ||||||||
Here are the Smart Investing & Trading Scores of the most requested small cap stocks at 12Stocks.com (click stock name for detailed review):
|


| 12Stocks.com: Investing in Smallcap Index with Stocks | |
|
The following table helps investors and traders sort through current performance and trends (as measured by Smart Investing & Trading Score) of various
stocks in the Smallcap Index. Quick View: Move mouse or cursor over stock symbol (ticker) to view short-term technical chart and over stock name to view long term chart. Click on  to add stock symbol to your watchlist and to add stock symbol to your watchlist and  to view watchlist. Click on any ticker or stock name for detailed market intelligence report for that stock. to view watchlist. Click on any ticker or stock name for detailed market intelligence report for that stock. |
12Stocks.com Performance of Stocks in Smallcap Index
| Ticker | Stock Name | Watchlist | Category | Recent Price | Smart Investing & Trading Score | Change % | YTD Change% |
| VZIO | VIZIO Holding |   | Technology | 10.57 | 12 | -0.89 | 37.03% |
| FIGS | FIGS | | Services & Goods | 5.03 | 45 | -0.89 | -29.52% |
| DRH | DiamondRock Hospitality | | Financials | 8.77 | 0 | -0.90 | -6.60% |
| VREX | Varex Imaging | | Health Care | 16.43 | 17 | -0.90 | -19.85% |
| GRC | Gorman-Rupp | | Industrials | 32.49 | 10 | -0.91 | -8.56% |
| SPNS | Sapiens | | Technology | 30.38 | 0 | -0.91 | 4.98% |
| IVAC | Intevac | | Technology | 4.24 | 83 | -0.93 | -1.85% |
| AXSM | Axsome | | Health Care | 74.19 | 45 | -0.93 | -6.78% |
| BWMN | Bowman Consulting | | Industrials | 30.47 | 7 | -0.94 | -13.48% |
| AXL | American Axle | | Consumer Staples | 7.32 | 68 | -0.95 | -16.91% |
| HA | Hawaiian | | Transports | 12.56 | 35 | -0.95 | -11.55% |
| VERA | Vera | | Health Care | 41.91 | 44 | -0.95 | 170.74% |
| ERAS | Erasca | | Health Care | 2.07 | 52 | -0.96 | -2.82% |
| URGN | UroGen Pharma | | Health Care | 14.26 | 37 | -0.97 | -4.93% |
| HP | Helmerich & Payne | | Energy | 37.83 | 0 | -0.99 | 4.45% |
| POR | Portland General | | Utilities | 43.48 | 83 | -1.00 | 0.32% |
| FBRT | Franklin BSP | | Financials | 12.81 | 72 | -1.00 | -6.01% |
| CAKE | Cheesecake Factory | | Services & Goods | 33.47 | 8 | -1.03 | -4.40% |
| FLYW | Flywire | | Technology | 20.18 | 10 | -1.03 | -13.87% |
| ABG | Asbury Automotive | | Services & Goods | 208.45 | 20 | -1.04 | -7.34% |
| BTMD | biote | | Health Care | 5.58 | 42 | -1.06 | 12.50% |
| SRI | Stoneridge | | Consumer Staples | 14.80 | 0 | -1.07 | -24.37% |
| KROS | Keros | | Health Care | 57.10 | 17 | -1.07 | 43.32% |
| NSP | Insperity | | Services & Goods | 103.17 | 26 | -1.08 | -11.99% |
| HAYN | Haynes | | Industrials | 59.67 | 13 | -1.09 | 4.59% |


| Too many stocks? View smallcap stocks filtered by marketcap & sector |
| Marketcap: All SmallCap Stocks (default-no microcap), Large, Mid-Range, Small |
| Smallcap Sector: Tech, Finance, Energy, Staples, Retail, Industrial, Materials, & Medical |
|
Get the most comprehensive stock market coverage daily at 12Stocks.com ➞ Best Stocks Today ➞ Best Stocks Weekly ➞ Best Stocks Year-to-Date ➞ Best Stocks Trends ➞  Best Stocks Today 12Stocks.com Best Nasdaq Stocks ➞ Best S&P 500 Stocks ➞ Best Tech Stocks ➞ Best Biotech Stocks ➞ |
| Detailed Overview of SmallCap Stocks |
| SmallCap Technical Overview, Leaders & Laggards, Top SmallCap ETF Funds & Detailed SmallCap Stocks List, Charts, Trends & More |
| Smallcap: Technical Analysis, Trends & YTD Performance | |
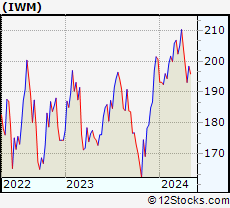
| SmallCap segment as represented by
IWM, an exchange-traded fund [ETF], holds basket of thousands of smallcap stocks from across all major sectors of the US stock market. The smallcap index (contains stocks like Riverbed & Sotheby's) is down by -0.39% and is currently underperforming the overall market by -6.01% year-to-date. Below is a quick view of technical charts and trends: | |
 IWM Weekly Chart |
|
| Long Term Trend: Not Good | |
| Medium Term Trend: Good | |
 IWM Daily Chart |
|
| Short Term Trend: Deteriorating | |
| Overall Trend Score: 49 | |
| YTD Performance: -0.39% | |
| **Trend Scores & Views Are Only For Educational Purposes And Not For Investing | |
| 12Stocks.com: Top Performing Small Cap Index Stocks | ||||||||||||||||||||||||||||||||||||||||||||||||
 The top performing Small Cap Index stocks year to date are
Now, more recently, over last week, the top performing Small Cap Index stocks on the move are


|
||||||||||||||||||||||||||||||||||||||||||||||||
| 12Stocks.com: Investing in Smallcap Index using Exchange Traded Funds | |
|
The following table shows list of key exchange traded funds (ETF) that
help investors track Smallcap index. The following list also includes leveraged ETF funds that track twice or thrice the daily returns of Smallcap indices. Short or inverse ETF funds move in the opposite direction to the index they track and are useful during market pullbacks or during bear markets. Quick View: Move mouse or cursor over ETF symbol (ticker) to view short-term technical chart and over ETF name to view long term chart. Click on ticker or stock name for detailed view. Click on to add stock symbol to your watchlist and to view watchlist. |
12Stocks.com List of ETFs that track Smallcap Index
| Ticker | ETF Name | Watchlist | Recent Price | Smart Investing & Trading Score | Change % | Week % | Year-to-date % |
| IWM | iShares Russell 2000 | | 199.92 | 49 | 1.84 | 0.77 | -0.39% |
| IJR | iShares Core S&P Small-Cap | | 106.33 | 50 | 1.52 | 0.64 | -1.77% |
| VTWO | Vanguard Russell 2000 ETF | | 80.85 | 42 | 1.88 | 0.79 | -0.31% |
| IWN | iShares Russell 2000 Value | | 152.88 | 75 | 2.04 | 1.15 | -1.58% |
| IWO | iShares Russell 2000 Growth | | 254.34 | 32 | 1.91 | 0.49 | 0.84% |
| IJS | iShares S&P Small-Cap 600 Value | | 98.02 | 43 | 1.68 | 0.85 | -4.9% |
| IJT | iShares S&P Small-Cap 600 Growth | | 126.72 | 63 | 1.42 | 0.5 | 1.26% |
| XSLV | PowerShares S&P SmallCap Low Volatil ETF | | 43.14 | 73 | 0.72 | 0.98 | -2.29% |
| SDD | ProShares UltraShort SmallCap600 | | 19.31 | 56 | -2.02 | -0.21 | 4.79% |
| SMLV | SPDR SSGA US Small Cap Low Volatil ETF | | 108.83 | 87 | 1.30 | 1.22 | -3.27% |
| SAA | ProShares Ultra SmallCap600 | | 22.93 | 42 | 1.56 | -0.46 | -8.08% |
| SBB | ProShares Short SmallCap600 | | 16.37 | 49 | -1.14 | -0.09 | 2.76% |
| 12Stocks.com: Charts, Trends, Fundamental Data and Performances of SmallCap Stocks | |
|
We now take in-depth look at all SmallCap stocks including charts, multi-period performances and overall trends (as measured by Smart Investing & Trading Score). One can sort SmallCap stocks (click link to choose) by Daily, Weekly and by Year-to-Date performances. Also, one can sort by size of the company or by market capitalization. |
| Select Your Default Chart Type: | |||||
| |||||
| Click on stock symbol or name for detailed view. Click on to add stock symbol to your watchlist and to view watchlist. Quick View: Move mouse or cursor over "Daily" to quickly view daily technical stock chart and over "Weekly" to view weekly technical stock chart. | |||||

 | VZIO VIZIO Holding Corp. |
| Sector: Technology | |
| SubSector: Consumer Electronics | |
| MarketCap: 1300 Millions | |
| Recent Price: 10.57 Smart Investing & Trading Score: 12 | |
| Day Percent Change: -0.89% Day Change: -0.10 | |
| Week Change: -1.72% Year-to-date Change: 37.0% | |
| VZIO Links: Profile News Message Board | |
| Charts:- Daily , Weekly | |
| Add VZIO to Watchlist: View: Get Complete VZIO Trend Analysis ➞ | |
 | FIGS FIGS, Inc. |
| Sector: Services & Goods | |
| SubSector: Apparel Manufacturing | |
| MarketCap: 1370 Millions | |
| Recent Price: 5.03 Smart Investing & Trading Score: 45 | |
| Day Percent Change: -0.89% Day Change: -0.04 | |
| Week Change: 2.13% Year-to-date Change: -29.5% | |
| FIGS Links: Profile News Message Board | |
| Charts:- Daily , Weekly | |
| Add FIGS to Watchlist: View: Get Complete FIGS Trend Analysis ➞ | |
 | DRH DiamondRock Hospitality Company |
| Sector: Financials | |
| SubSector: REIT - Hotel/Motel | |
| MarketCap: 964 Millions | |
| Recent Price: 8.77 Smart Investing & Trading Score: 0 | |
| Day Percent Change: -0.90% Day Change: -0.08 | |
| Week Change: -3.09% Year-to-date Change: -6.6% | |
| DRH Links: Profile News Message Board | |
| Charts:- Daily , Weekly | |
| Add DRH to Watchlist: View: Get Complete DRH Trend Analysis ➞ | |
 | VREX Varex Imaging Corporation |
| Sector: Health Care | |
| SubSector: Medical Appliances & Equipment | |
| MarketCap: 718.78 Millions | |
| Recent Price: 16.43 Smart Investing & Trading Score: 17 | |
| Day Percent Change: -0.90% Day Change: -0.15 | |
| Week Change: -2.14% Year-to-date Change: -19.9% | |
| VREX Links: Profile News Message Board | |
| Charts:- Daily , Weekly | |
| Add VREX to Watchlist: View: Get Complete VREX Trend Analysis ➞ | |
 | GRC The Gorman-Rupp Company |
| Sector: Industrials | |
| SubSector: Diversified Machinery | |
| MarketCap: 729.616 Millions | |
| Recent Price: 32.49 Smart Investing & Trading Score: 10 | |
| Day Percent Change: -0.91% Day Change: -0.30 | |
| Week Change: -2.67% Year-to-date Change: -8.6% | |
| GRC Links: Profile News Message Board | |
| Charts:- Daily , Weekly | |
| Add GRC to Watchlist: View: Get Complete GRC Trend Analysis ➞ | |
 | SPNS Sapiens International Corporation N.V. |
| Sector: Technology | |
| SubSector: Business Software & Services | |
| MarketCap: 841.858 Millions | |
| Recent Price: 30.38 Smart Investing & Trading Score: 0 | |
| Day Percent Change: -0.91% Day Change: -0.28 | |
| Week Change: -2.94% Year-to-date Change: 5.0% | |
| SPNS Links: Profile News Message Board | |
| Charts:- Daily , Weekly | |
| Add SPNS to Watchlist: View: Get Complete SPNS Trend Analysis ➞ | |
 | IVAC Intevac, Inc. |
| Sector: Technology | |
| SubSector: Diversified Electronics | |
| MarketCap: 89.2396 Millions | |
| Recent Price: 4.24 Smart Investing & Trading Score: 83 | |
| Day Percent Change: -0.93% Day Change: -0.04 | |
| Week Change: -3.42% Year-to-date Change: -1.9% | |
| IVAC Links: Profile News Message Board | |
| Charts:- Daily , Weekly | |
| Add IVAC to Watchlist: View: Get Complete IVAC Trend Analysis ➞ | |
 | AXSM Axsome Therapeutics, Inc. |
| Sector: Health Care | |
| SubSector: Biotechnology | |
| MarketCap: 2284.25 Millions | |
| Recent Price: 74.19 Smart Investing & Trading Score: 45 | |
| Day Percent Change: -0.93% Day Change: -0.70 | |
| Week Change: 3.46% Year-to-date Change: -6.8% | |
| AXSM Links: Profile News Message Board | |
| Charts:- Daily , Weekly | |
| Add AXSM to Watchlist: View: Get Complete AXSM Trend Analysis ➞ | |
 | BWMN Bowman Consulting Group Ltd. |
| Sector: Industrials | |
| SubSector: Engineering & Construction | |
| MarketCap: 443 Millions | |
| Recent Price: 30.47 Smart Investing & Trading Score: 7 | |
| Day Percent Change: -0.94% Day Change: -0.29 | |
| Week Change: -7.54% Year-to-date Change: -13.5% | |
| BWMN Links: Profile News Message Board | |
| Charts:- Daily , Weekly | |
| Add BWMN to Watchlist: View: Get Complete BWMN Trend Analysis ➞ | |
 | AXL American Axle & Manufacturing Holdings, Inc. |
| Sector: Consumer Staples | |
| SubSector: Auto Parts | |
| MarketCap: 407.139 Millions | |
| Recent Price: 7.32 Smart Investing & Trading Score: 68 | |
| Day Percent Change: -0.95% Day Change: -0.07 | |
| Week Change: -2.66% Year-to-date Change: -16.9% | |
| AXL Links: Profile News Message Board | |
| Charts:- Daily , Weekly | |
| Add AXL to Watchlist: View: Get Complete AXL Trend Analysis ➞ | |
 | HA Hawaiian Holdings, Inc. |
| Sector: Transports | |
| SubSector: Regional Airlines | |
| MarketCap: 509.47 Millions | |
| Recent Price: 12.56 Smart Investing & Trading Score: 35 | |
| Day Percent Change: -0.95% Day Change: -0.12 | |
| Week Change: 2.36% Year-to-date Change: -11.6% | |
| HA Links: Profile News Message Board | |
| Charts:- Daily , Weekly | |
| Add HA to Watchlist: View: Get Complete HA Trend Analysis ➞ | |
 | VERA Vera Therapeutics, Inc. |
| Sector: Health Care | |
| SubSector: Biotechnology | |
| MarketCap: 746 Millions | |
| Recent Price: 41.91 Smart Investing & Trading Score: 44 | |
| Day Percent Change: -0.95% Day Change: -0.40 | |
| Week Change: 5.65% Year-to-date Change: 170.7% | |
| VERA Links: Profile News Message Board | |
| Charts:- Daily , Weekly | |
| Add VERA to Watchlist: View: Get Complete VERA Trend Analysis ➞ | |
 | ERAS Erasca, Inc. |
| Sector: Health Care | |
| SubSector: Biotechnology | |
| MarketCap: 419 Millions | |
| Recent Price: 2.07 Smart Investing & Trading Score: 52 | |
| Day Percent Change: -0.96% Day Change: -0.02 | |
| Week Change: 9.52% Year-to-date Change: -2.8% | |
| ERAS Links: Profile News Message Board | |
| Charts:- Daily , Weekly | |
| Add ERAS to Watchlist: View: Get Complete ERAS Trend Analysis ➞ | |
 | URGN UroGen Pharma Ltd. |
| Sector: Health Care | |
| SubSector: Biotechnology | |
| MarketCap: 373.485 Millions | |
| Recent Price: 14.26 Smart Investing & Trading Score: 37 | |
| Day Percent Change: -0.97% Day Change: -0.14 | |
| Week Change: 0.78% Year-to-date Change: -4.9% | |
| URGN Links: Profile News Message Board | |
| Charts:- Daily , Weekly | |
| Add URGN to Watchlist: View: Get Complete URGN Trend Analysis ➞ | |
 | HP Helmerich & Payne, Inc. |
| Sector: Energy | |
| SubSector: Oil & Gas Drilling & Exploration | |
| MarketCap: 1796.39 Millions | |
| Recent Price: 37.83 Smart Investing & Trading Score: 0 | |
| Day Percent Change: -0.99% Day Change: -0.38 | |
| Week Change: -6.34% Year-to-date Change: 4.5% | |
| HP Links: Profile News Message Board | |
| Charts:- Daily , Weekly | |
| Add HP to Watchlist: View: Get Complete HP Trend Analysis ➞ | |
 | POR Portland General Electric Company |
| Sector: Utilities | |
| SubSector: Electric Utilities | |
| MarketCap: 4291.84 Millions | |
| Recent Price: 43.48 Smart Investing & Trading Score: 83 | |
| Day Percent Change: -1.00% Day Change: -0.44 | |
| Week Change: 1.59% Year-to-date Change: 0.3% | |
| POR Links: Profile News Message Board | |
| Charts:- Daily , Weekly | |
| Add POR to Watchlist: View: Get Complete POR Trend Analysis ➞ | |
 | FBRT Franklin BSP Realty Trust, Inc. |
| Sector: Financials | |
| SubSector: REIT - Mortgage | |
| MarketCap: 1170 Millions | |
| Recent Price: 12.81 Smart Investing & Trading Score: 72 | |
| Day Percent Change: -1.00% Day Change: -0.13 | |
| Week Change: 0.55% Year-to-date Change: -6.0% | |
| FBRT Links: Profile News Message Board | |
| Charts:- Daily , Weekly | |
| Add FBRT to Watchlist: View: Get Complete FBRT Trend Analysis ➞ | |
 | CAKE The Cheesecake Factory Incorporated |
| Sector: Services & Goods | |
| SubSector: Restaurants | |
| MarketCap: 829 Millions | |
| Recent Price: 33.47 Smart Investing & Trading Score: 8 | |
| Day Percent Change: -1.03% Day Change: -0.35 | |
| Week Change: -5.33% Year-to-date Change: -4.4% | |
| CAKE Links: Profile News Message Board | |
| Charts:- Daily , Weekly | |
| Add CAKE to Watchlist: View: Get Complete CAKE Trend Analysis ➞ | |
 | FLYW Flywire Corporation |
| Sector: Technology | |
| SubSector: Software - Infrastructure | |
| MarketCap: 3390 Millions | |
| Recent Price: 20.18 Smart Investing & Trading Score: 10 | |
| Day Percent Change: -1.03% Day Change: -0.21 | |
| Week Change: -2.93% Year-to-date Change: -13.9% | |
| FLYW Links: Profile News Message Board | |
| Charts:- Daily , Weekly | |
| Add FLYW to Watchlist: View: Get Complete FLYW Trend Analysis ➞ | |
 | ABG Asbury Automotive Group, Inc. |
| Sector: Services & Goods | |
| SubSector: Auto Dealerships | |
| MarketCap: 1203.21 Millions | |
| Recent Price: 208.45 Smart Investing & Trading Score: 20 | |
| Day Percent Change: -1.04% Day Change: -2.19 | |
| Week Change: -6.09% Year-to-date Change: -7.3% | |
| ABG Links: Profile News Message Board | |
| Charts:- Daily , Weekly | |
| Add ABG to Watchlist: View: Get Complete ABG Trend Analysis ➞ | |
 | BTMD biote Corp. |
| Sector: Health Care | |
| SubSector: Medical Care Facilities | |
| MarketCap: 468 Millions | |
| Recent Price: 5.58 Smart Investing & Trading Score: 42 | |
| Day Percent Change: -1.06% Day Change: -0.06 | |
| Week Change: 1.09% Year-to-date Change: 12.5% | |
| BTMD Links: Profile News Message Board | |
| Charts:- Daily , Weekly | |
| Add BTMD to Watchlist: View: Get Complete BTMD Trend Analysis ➞ | |
 | SRI Stoneridge, Inc. |
| Sector: Consumer Staples | |
| SubSector: Auto Parts | |
| MarketCap: 451.839 Millions | |
| Recent Price: 14.80 Smart Investing & Trading Score: 0 | |
| Day Percent Change: -1.07% Day Change: -0.16 | |
| Week Change: -6.21% Year-to-date Change: -24.4% | |
| SRI Links: Profile News Message Board | |
| Charts:- Daily , Weekly | |
| Add SRI to Watchlist: View: Get Complete SRI Trend Analysis ➞ | |
 | KROS Keros Therapeutics, Inc. |
| Sector: Health Care | |
| SubSector: Biotechnology | |
| MarketCap: 17887 Millions | |
| Recent Price: 57.10 Smart Investing & Trading Score: 17 | |
| Day Percent Change: -1.07% Day Change: -0.62 | |
| Week Change: -1.31% Year-to-date Change: 43.3% | |
| KROS Links: Profile News Message Board | |
| Charts:- Daily , Weekly | |
| Add KROS to Watchlist: View: Get Complete KROS Trend Analysis ➞ | |
 | NSP Insperity, Inc. |
| Sector: Services & Goods | |
| SubSector: Business Services | |
| MarketCap: 1385.32 Millions | |
| Recent Price: 103.17 Smart Investing & Trading Score: 26 | |
| Day Percent Change: -1.08% Day Change: -1.13 | |
| Week Change: -0.96% Year-to-date Change: -12.0% | |
| NSP Links: Profile News Message Board | |
| Charts:- Daily , Weekly | |
| Add NSP to Watchlist: View: Get Complete NSP Trend Analysis ➞ | |
 | HAYN Haynes International, Inc. |
| Sector: Industrials | |
| SubSector: Metal Fabrication | |
| MarketCap: 245.75 Millions | |
| Recent Price: 59.67 Smart Investing & Trading Score: 13 | |
| Day Percent Change: -1.09% Day Change: -0.66 | |
| Week Change: -1.06% Year-to-date Change: 4.6% | |
| HAYN Links: Profile News Message Board | |
| Charts:- Daily , Weekly | |
| Add HAYN to Watchlist: View: Get Complete HAYN Trend Analysis ➞ | |
| Too many stocks? View smallcap stocks filtered by marketcap & sector |
| Marketcap: All SmallCap Stocks (default-no microcap), Large, Mid-Range, Small & MicroCap |
| Sector: Tech, Finance, Energy, Staples, Retail, Industrial, Materials, Utilities & Medical |
|
Best Stocks Today 12Stocks.com |
© 2024 12Stocks.com Terms & Conditions Privacy Contact Us
All Information Provided Only For Education And Not To Be Used For Investing or Trading. See Terms & Conditions


One More Thing ... Get Best Stocks Delivered Daily!
Never Ever Miss A Move With Our Top Ten Stocks Lists
Find Best Stocks In Any Market - Bull or Bear Market
Take A Peek At Our Top Ten Stocks Lists: Daily, Weekly, Year-to-Date & Top Trends
Find Best Stocks In Any Market - Bull or Bear Market
Take A Peek At Our Top Ten Stocks Lists: Daily, Weekly, Year-to-Date & Top Trends
Smallcap Stocks With Best Up Trends [0-bearish to 100-bullish]: Emergent BioSolutions[100], Aspen Aerogels[100], Carvana Co[100], Perdoceo Education[100], Gannett Co[100], Pitney Bowes[100], Benchmark Electronics[100], Origin Materials[100], FormFactor [100], Lantheus [100], Q2 [100]
Best Smallcap Stocks Year-to-Date:
Janux [440.16%], Viking [307.09%], Longboard [273.98%], Alpine Immune[239.29%], Bakkt [187.89%], Avidity Biosciences[182.96%], Vera [170.74%], Cullinan Oncology[169.74%], Super Micro[168.25%], Arcutis Bio[166.25%], Y-mAbs [152.93%] Best Smallcap Stocks This Week:
Deciphera [73.24%], Emergent BioSolutions[71.88%], Eyenovia [49.22%], Aspen Aerogels[48.14%], P3 Health[38.51%], Carvana Co[38.18%], Cue Biopharma[37.73%], Origin Materials[36.24%], TransMedics Group[35.14%], Seres [34.55%], Enovix [32.07%] Best Smallcap Stocks Daily:
Emergent BioSolutions[70.98%], Aspen Aerogels[56.70%], Carvana Co[33.77%], Perdoceo Education[31.46%], Enovix [31.06%], Office Properties[28.00%], Gannett Co[26.97%], Sunnova Energy[25.21%], Pitney Bowes[24.70%], Pulmonx [21.50%], CommScope Holding[20.95%]