
 Login Sign Up


| |||||
 |  | ||||

| 12Stocks.com Market Intelligence |
Best SmallCap Stocks
|
| In a hurry? Small Cap Stock Lists: Performance Trends Table, Stock Charts
Sort Small Cap stocks: Daily, Weekly, Year-to-Date, Market Cap & Trends. Filter Small Cap stocks list by sector: Show all, Tech, Finance, Energy, Staples, Retail, Industrial, Materials, Utilities and HealthCare Filter Small Cap stocks list by size: All Large Medium Small and MicroCap |
| 12Stocks.com Small Cap Stocks Performances & Trends Daily | |||||||||
|
|  The overall Smart Investing & Trading Score is 58 (0-bearish to 100-bullish) which puts Small Cap index in short term neutral trend. The Smart Investing & Trading Score from previous trading session is 63 and hence a deterioration of trend.
| ||||||||
Here are the Smart Investing & Trading Scores of the most requested small cap stocks at 12Stocks.com (click stock name for detailed review):
|


| 12Stocks.com: Investing in Smallcap Index with Stocks | |
|
The following table helps investors and traders sort through current performance and trends (as measured by Smart Investing & Trading Score) of various
stocks in the Smallcap Index. Quick View: Move mouse or cursor over stock symbol (ticker) to view short-term technical chart and over stock name to view long term chart. Click on  to add stock symbol to your watchlist and to add stock symbol to your watchlist and  to view watchlist. Click on any ticker or stock name for detailed market intelligence report for that stock. to view watchlist. Click on any ticker or stock name for detailed market intelligence report for that stock. |
12Stocks.com Performance of Stocks in Smallcap Index
| Ticker | Stock Name | Watchlist | Category | Recent Price | Smart Investing & Trading Score | Change % | YTD Change% |
| FELE | Franklin Electric |   | Industrials | 102.85 | 83 | -0.74 | 6.41% |
| KWR | Quaker Chemical | | Materials | 189.92 | 23 | -0.74 | -11.01% |
| IOSP | Innospec | | Materials | 122.04 | 44 | -0.74 | -0.97% |
| RDFN | Redfin | | Technology | 5.33 | 20 | -0.74 | -48.35% |
| UDMY | Udemy | | Consumer Staples | 10.12 | 35 | -0.74 | -32.02% |
| COUR | Coursera | | Consumer Staples | 12.03 | 28 | -0.74 | -38.83% |
| ACVA | ACV Auctions | | Services & Goods | 18.22 | 63 | -0.74 | 20.95% |
| VLY | Valley National | | Financials | 7.84 | 67 | -0.76 | -27.81% |
| MCRI | Monarch Casino | | Services & Goods | 68.92 | 68 | -0.76 | -0.33% |
| HVT | Haverty Furniture | | Services & Goods | 32.55 | 74 | -0.76 | -8.31% |
| GRC | Gorman-Rupp | | Industrials | 36.46 | 70 | -0.76 | 2.62% |
| BNL | Broadstone Net | | Financials | 14.44 | 38 | -0.76 | -16.14% |
| OVLY | Oak Valley | | Financials | 24.79 | 64 | -0.76 | -17.23% |
| STAA | STAAR Surgical | | Health Care | 47.82 | 81 | -0.77 | 53.22% |
| PFSI | PennyMac Financial | | Financials | 92.07 | 88 | -0.77 | 4.19% |
| AMLX | Amylyx | | Health Care | 1.93 | 15 | -0.77 | -86.65% |
| AROW | Arrow Financial | | Financials | 22.97 | 40 | -0.78 | -17.79% |
| CHUY | Chuy s | | Services & Goods | 30.53 | 18 | -0.78 | -20.14% |
| ENS | EnerSys | | Industrials | 90.38 | 42 | -0.79 | -10.48% |
| SCVL | Shoe Carnival | | Services & Goods | 35.00 | 83 | -0.79 | 15.86% |
| OSIS | OSI Systems | | Industrials | 139.71 | 80 | -0.79 | 8.26% |
| ACNB | ACNB | | Financials | 33.98 | 42 | -0.79 | -24.08% |
| PTCT | PTC | | Health Care | 25.21 | 28 | -0.79 | -8.53% |
| JELD | JELD-WEN Holding | | Industrials | 18.80 | 41 | -0.79 | -0.42% |
| PWSC | PowerSchool | | Technology | 17.54 | 18 | -0.79 | -25.80% |


| Too many stocks? View smallcap stocks filtered by marketcap & sector |
| Marketcap: All SmallCap Stocks (default-no microcap), Large, Mid-Range, Small |
| Smallcap Sector: Tech, Finance, Energy, Staples, Retail, Industrial, Materials, & Medical |
|
Get the most comprehensive stock market coverage daily at 12Stocks.com ➞ Best Stocks Today ➞ Best Stocks Weekly ➞ Best Stocks Year-to-Date ➞ Best Stocks Trends ➞  Best Stocks Today 12Stocks.com Best Nasdaq Stocks ➞ Best S&P 500 Stocks ➞ Best Tech Stocks ➞ Best Biotech Stocks ➞ |
| Detailed Overview of SmallCap Stocks |
| SmallCap Technical Overview, Leaders & Laggards, Top SmallCap ETF Funds & Detailed SmallCap Stocks List, Charts, Trends & More |
| Smallcap: Technical Analysis, Trends & YTD Performance | |
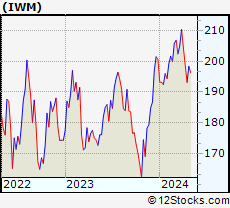
| SmallCap segment as represented by
IWM, an exchange-traded fund [ETF], holds basket of thousands of smallcap stocks from across all major sectors of the US stock market. The smallcap index (contains stocks like Riverbed & Sotheby's) is down by -1.51% and is currently underperforming the overall market by -7.17% year-to-date. Below is a quick view of technical charts and trends: | |
 IWM Weekly Chart |
|
| Long Term Trend: Good | |
| Medium Term Trend: Not Good | |
 IWM Daily Chart |
|
| Short Term Trend: Very Good | |
| Overall Trend Score: 58 | |
| YTD Performance: -1.51% | |
| **Trend Scores & Views Are Only For Educational Purposes And Not For Investing | |
| 12Stocks.com: Top Performing Small Cap Index Stocks | ||||||||||||||||||||||||||||||||||||||||||||||||
 The top performing Small Cap Index stocks year to date are
Now, more recently, over last week, the top performing Small Cap Index stocks on the move are


|
||||||||||||||||||||||||||||||||||||||||||||||||
| 12Stocks.com: Investing in Smallcap Index using Exchange Traded Funds | |
|
The following table shows list of key exchange traded funds (ETF) that
help investors track Smallcap index. The following list also includes leveraged ETF funds that track twice or thrice the daily returns of Smallcap indices. Short or inverse ETF funds move in the opposite direction to the index they track and are useful during market pullbacks or during bear markets. Quick View: Move mouse or cursor over ETF symbol (ticker) to view short-term technical chart and over ETF name to view long term chart. Click on ticker or stock name for detailed view. Click on to add stock symbol to your watchlist and to view watchlist. |
12Stocks.com List of ETFs that track Smallcap Index
| Ticker | ETF Name | Watchlist | Recent Price | Smart Investing & Trading Score | Change % | Week % | Year-to-date % |
| IWM | iShares Russell 2000 | | 197.68 | 58 | -0.45 | 2.35 | -1.51% |
| IJR | iShares Core S&P Small-Cap | | 105.71 | 85 | -0.24 | 2.41 | -2.35% |
| VTWO | Vanguard Russell 2000 ETF | | 79.93 | 48 | -0.45 | 2.37 | -1.44% |
| IWN | iShares Russell 2000 Value | | 151.28 | 75 | -0.30 | 2.37 | -2.61% |
| IWO | iShares Russell 2000 Growth | | 251.27 | 58 | -0.44 | 2.44 | -0.38% |
| IJS | iShares S&P Small-Cap 600 Value | | 97.71 | 45 | -0.43 | 2.2 | -5.2% |
| IJT | iShares S&P Small-Cap 600 Growth | | 125.37 | 48 | -0.28 | 2.59 | 0.18% |
| XSLV | PowerShares S&P SmallCap Low Volatil ETF | | 42.94 | 48 | -0.26 | 1.8 | -2.74% |
| SBB | ProShares Short SmallCap600 | | 16.37 | 33 | -0.02 | -2.79 | 2.76% |
| SMLV | SPDR SSGA US Small Cap Low Volatil ETF | | 108.43 | 73 | -0.31 | 2.21 | -3.63% |
| SAA | ProShares Ultra SmallCap600 | | 23.01 | 58 | -0.60 | 5.55 | -7.78% |
| SDD | ProShares UltraShort SmallCap600 | | 19.49 | 42 | 1.35 | -4.18 | 5.77% |
| 12Stocks.com: Charts, Trends, Fundamental Data and Performances of SmallCap Stocks | |
|
We now take in-depth look at all SmallCap stocks including charts, multi-period performances and overall trends (as measured by Smart Investing & Trading Score). One can sort SmallCap stocks (click link to choose) by Daily, Weekly and by Year-to-Date performances. Also, one can sort by size of the company or by market capitalization. |
| Select Your Default Chart Type: | |||||
| |||||
| Click on stock symbol or name for detailed view. Click on to add stock symbol to your watchlist and to view watchlist. Quick View: Move mouse or cursor over "Daily" to quickly view daily technical stock chart and over "Weekly" to view weekly technical stock chart. | |||||

 | FELE Franklin Electric Co., Inc. |
| Sector: Industrials | |
| SubSector: Industrial Electrical Equipment | |
| MarketCap: 2397.89 Millions | |
| Recent Price: 102.85 Smart Investing & Trading Score: 83 | |
| Day Percent Change: -0.74% Day Change: -0.77 | |
| Week Change: 1.39% Year-to-date Change: 6.4% | |
| FELE Links: Profile News Message Board | |
| Charts:- Daily , Weekly | |
| Add FELE to Watchlist: View: Get Complete FELE Trend Analysis ➞ | |
 | KWR Quaker Chemical Corporation |
| Sector: Materials | |
| SubSector: Specialty Chemicals | |
| MarketCap: 2411.67 Millions | |
| Recent Price: 189.92 Smart Investing & Trading Score: 23 | |
| Day Percent Change: -0.74% Day Change: -1.42 | |
| Week Change: -0.3% Year-to-date Change: -11.0% | |
| KWR Links: Profile News Message Board | |
| Charts:- Daily , Weekly | |
| Add KWR to Watchlist: View: Get Complete KWR Trend Analysis ➞ | |
 | IOSP Innospec Inc. |
| Sector: Materials | |
| SubSector: Specialty Chemicals | |
| MarketCap: 1665.57 Millions | |
| Recent Price: 122.04 Smart Investing & Trading Score: 44 | |
| Day Percent Change: -0.74% Day Change: -0.91 | |
| Week Change: -0.2% Year-to-date Change: -1.0% | |
| IOSP Links: Profile News Message Board | |
| Charts:- Daily , Weekly | |
| Add IOSP to Watchlist: View: Get Complete IOSP Trend Analysis ➞ | |
 | RDFN Redfin Corporation |
| Sector: Technology | |
| SubSector: Internet Information Providers | |
| MarketCap: 1356.2 Millions | |
| Recent Price: 5.33 Smart Investing & Trading Score: 20 | |
| Day Percent Change: -0.74% Day Change: -0.04 | |
| Week Change: 2.5% Year-to-date Change: -48.4% | |
| RDFN Links: Profile News Message Board | |
| Charts:- Daily , Weekly | |
| Add RDFN to Watchlist: View: Get Complete RDFN Trend Analysis ➞ | |
 | UDMY Udemy, Inc. |
| Sector: Consumer Staples | |
| SubSector: Education & Training Services | |
| MarketCap: 1570 Millions | |
| Recent Price: 10.12 Smart Investing & Trading Score: 35 | |
| Day Percent Change: -0.74% Day Change: -0.07 | |
| Week Change: 1.97% Year-to-date Change: -32.0% | |
| UDMY Links: Profile News Message Board | |
| Charts:- Daily , Weekly | |
| Add UDMY to Watchlist: View: Get Complete UDMY Trend Analysis ➞ | |
 | COUR Coursera, Inc. |
| Sector: Consumer Staples | |
| SubSector: Education & Training Services | |
| MarketCap: 1990 Millions | |
| Recent Price: 12.03 Smart Investing & Trading Score: 28 | |
| Day Percent Change: -0.74% Day Change: -0.09 | |
| Week Change: 0.67% Year-to-date Change: -38.8% | |
| COUR Links: Profile News Message Board | |
| Charts:- Daily , Weekly | |
| Add COUR to Watchlist: View: Get Complete COUR Trend Analysis ➞ | |
 | ACVA ACV Auctions Inc. |
| Sector: Services & Goods | |
| SubSector: Auto & Truck Dealerships | |
| MarketCap: 2680 Millions | |
| Recent Price: 18.22 Smart Investing & Trading Score: 63 | |
| Day Percent Change: -0.74% Day Change: -0.14 | |
| Week Change: 5.23% Year-to-date Change: 21.0% | |
| ACVA Links: Profile News Message Board | |
| Charts:- Daily , Weekly | |
| Add ACVA to Watchlist: View: Get Complete ACVA Trend Analysis ➞ | |
 | VLY Valley National Bancorp |
| Sector: Financials | |
| SubSector: Regional - Northeast Banks | |
| MarketCap: 2843.09 Millions | |
| Recent Price: 7.84 Smart Investing & Trading Score: 67 | |
| Day Percent Change: -0.76% Day Change: -0.06 | |
| Week Change: 1.69% Year-to-date Change: -27.8% | |
| VLY Links: Profile News Message Board | |
| Charts:- Daily , Weekly | |
| Add VLY to Watchlist: View: Get Complete VLY Trend Analysis ➞ | |
 | MCRI Monarch Casino & Resort, Inc. |
| Sector: Services & Goods | |
| SubSector: Resorts & Casinos | |
| MarketCap: 352.894 Millions | |
| Recent Price: 68.92 Smart Investing & Trading Score: 68 | |
| Day Percent Change: -0.76% Day Change: -0.53 | |
| Week Change: 2.35% Year-to-date Change: -0.3% | |
| MCRI Links: Profile News Message Board | |
| Charts:- Daily , Weekly | |
| Add MCRI to Watchlist: View: Get Complete MCRI Trend Analysis ➞ | |
 | HVT Haverty Furniture Companies, Inc. |
| Sector: Services & Goods | |
| SubSector: Home Furnishing Stores | |
| MarketCap: 253.125 Millions | |
| Recent Price: 32.55 Smart Investing & Trading Score: 74 | |
| Day Percent Change: -0.76% Day Change: -0.25 | |
| Week Change: 4.46% Year-to-date Change: -8.3% | |
| HVT Links: Profile News Message Board | |
| Charts:- Daily , Weekly | |
| Add HVT to Watchlist: View: Get Complete HVT Trend Analysis ➞ | |
 | GRC The Gorman-Rupp Company |
| Sector: Industrials | |
| SubSector: Diversified Machinery | |
| MarketCap: 729.616 Millions | |
| Recent Price: 36.46 Smart Investing & Trading Score: 70 | |
| Day Percent Change: -0.76% Day Change: -0.28 | |
| Week Change: 1.22% Year-to-date Change: 2.6% | |
| GRC Links: Profile News Message Board | |
| Charts:- Daily , Weekly | |
| Add GRC to Watchlist: View: Get Complete GRC Trend Analysis ➞ | |
 | BNL Broadstone Net Lease, Inc. |
| Sector: Financials | |
| SubSector: REIT Diversified | |
| MarketCap: 27267 Millions | |
| Recent Price: 14.44 Smart Investing & Trading Score: 38 | |
| Day Percent Change: -0.76% Day Change: -0.11 | |
| Week Change: 0% Year-to-date Change: -16.1% | |
| BNL Links: Profile News Message Board | |
| Charts:- Daily , Weekly | |
| Add BNL to Watchlist: View: Get Complete BNL Trend Analysis ➞ | |
 | OVLY Oak Valley Bancorp |
| Sector: Financials | |
| SubSector: Regional - Pacific Banks | |
| MarketCap: 148.429 Millions | |
| Recent Price: 24.79 Smart Investing & Trading Score: 64 | |
| Day Percent Change: -0.76% Day Change: -0.19 | |
| Week Change: 2.02% Year-to-date Change: -17.2% | |
| OVLY Links: Profile News Message Board | |
| Charts:- Daily , Weekly | |
| Add OVLY to Watchlist: View: Get Complete OVLY Trend Analysis ➞ | |
 | STAA STAAR Surgical Company |
| Sector: Health Care | |
| SubSector: Medical Instruments & Supplies | |
| MarketCap: 1334.6 Millions | |
| Recent Price: 47.82 Smart Investing & Trading Score: 81 | |
| Day Percent Change: -0.77% Day Change: -0.37 | |
| Week Change: 3.08% Year-to-date Change: 53.2% | |
| STAA Links: Profile News Message Board | |
| Charts:- Daily , Weekly | |
| Add STAA to Watchlist: View: Get Complete STAA Trend Analysis ➞ | |
 | PFSI PennyMac Financial Services, Inc. |
| Sector: Financials | |
| SubSector: Mortgage Investment | |
| MarketCap: 1588.09 Millions | |
| Recent Price: 92.07 Smart Investing & Trading Score: 88 | |
| Day Percent Change: -0.77% Day Change: -0.71 | |
| Week Change: 4.67% Year-to-date Change: 4.2% | |
| PFSI Links: Profile News Message Board | |
| Charts:- Daily , Weekly | |
| Add PFSI to Watchlist: View: Get Complete PFSI Trend Analysis ➞ | |
 | AMLX Amylyx Pharmaceuticals, Inc. |
| Sector: Health Care | |
| SubSector: Biotechnology | |
| MarketCap: 1500 Millions | |
| Recent Price: 1.93 Smart Investing & Trading Score: 15 | |
| Day Percent Change: -0.77% Day Change: -0.02 | |
| Week Change: 3.21% Year-to-date Change: -86.7% | |
| AMLX Links: Profile News Message Board | |
| Charts:- Daily , Weekly | |
| Add AMLX to Watchlist: View: Get Complete AMLX Trend Analysis ➞ | |
 | AROW Arrow Financial Corporation |
| Sector: Financials | |
| SubSector: Regional - Northeast Banks | |
| MarketCap: 413.999 Millions | |
| Recent Price: 22.97 Smart Investing & Trading Score: 40 | |
| Day Percent Change: -0.78% Day Change: -0.18 | |
| Week Change: 0.79% Year-to-date Change: -17.8% | |
| AROW Links: Profile News Message Board | |
| Charts:- Daily , Weekly | |
| Add AROW to Watchlist: View: Get Complete AROW Trend Analysis ➞ | |
 | CHUY Chuy s Holdings, Inc. |
| Sector: Services & Goods | |
| SubSector: Restaurants | |
| MarketCap: 159.17 Millions | |
| Recent Price: 30.53 Smart Investing & Trading Score: 18 | |
| Day Percent Change: -0.78% Day Change: -0.24 | |
| Week Change: -0.2% Year-to-date Change: -20.1% | |
| CHUY Links: Profile News Message Board | |
| Charts:- Daily , Weekly | |
| Add CHUY to Watchlist: View: Get Complete CHUY Trend Analysis ➞ | |
 | ENS EnerSys |
| Sector: Industrials | |
| SubSector: Industrial Electrical Equipment | |
| MarketCap: 2068.79 Millions | |
| Recent Price: 90.38 Smart Investing & Trading Score: 42 | |
| Day Percent Change: -0.79% Day Change: -0.72 | |
| Week Change: -0.13% Year-to-date Change: -10.5% | |
| ENS Links: Profile News Message Board | |
| Charts:- Daily , Weekly | |
| Add ENS to Watchlist: View: Get Complete ENS Trend Analysis ➞ | |
 | SCVL Shoe Carnival, Inc. |
| Sector: Services & Goods | |
| SubSector: Apparel Stores | |
| MarketCap: 252.508 Millions | |
| Recent Price: 35.00 Smart Investing & Trading Score: 83 | |
| Day Percent Change: -0.79% Day Change: -0.28 | |
| Week Change: 5.58% Year-to-date Change: 15.9% | |
| SCVL Links: Profile News Message Board | |
| Charts:- Daily , Weekly | |
| Add SCVL to Watchlist: View: Get Complete SCVL Trend Analysis ➞ | |
 | OSIS OSI Systems, Inc. |
| Sector: Industrials | |
| SubSector: Industrial Electrical Equipment | |
| MarketCap: 1100.39 Millions | |
| Recent Price: 139.71 Smart Investing & Trading Score: 80 | |
| Day Percent Change: -0.79% Day Change: -1.11 | |
| Week Change: 3.08% Year-to-date Change: 8.3% | |
| OSIS Links: Profile News Message Board | |
| Charts:- Daily , Weekly | |
| Add OSIS to Watchlist: View: Get Complete OSIS Trend Analysis ➞ | |
 | ACNB ACNB Corporation |
| Sector: Financials | |
| SubSector: Regional - Southwest Banks | |
| MarketCap: 231.065 Millions | |
| Recent Price: 33.98 Smart Investing & Trading Score: 42 | |
| Day Percent Change: -0.79% Day Change: -0.27 | |
| Week Change: 4.59% Year-to-date Change: -24.1% | |
| ACNB Links: Profile News Message Board | |
| Charts:- Daily , Weekly | |
| Add ACNB to Watchlist: View: Get Complete ACNB Trend Analysis ➞ | |
 | PTCT PTC Therapeutics, Inc. |
| Sector: Health Care | |
| SubSector: Biotechnology | |
| MarketCap: 2795.85 Millions | |
| Recent Price: 25.21 Smart Investing & Trading Score: 28 | |
| Day Percent Change: -0.79% Day Change: -0.20 | |
| Week Change: -0.43% Year-to-date Change: -8.5% | |
| PTCT Links: Profile News Message Board | |
| Charts:- Daily , Weekly | |
| Add PTCT to Watchlist: View: Get Complete PTCT Trend Analysis ➞ | |
 | JELD JELD-WEN Holding, Inc. |
| Sector: Industrials | |
| SubSector: General Building Materials | |
| MarketCap: 1022.53 Millions | |
| Recent Price: 18.80 Smart Investing & Trading Score: 41 | |
| Day Percent Change: -0.79% Day Change: -0.15 | |
| Week Change: 2.79% Year-to-date Change: -0.4% | |
| JELD Links: Profile News Message Board | |
| Charts:- Daily , Weekly | |
| Add JELD to Watchlist: View: Get Complete JELD Trend Analysis ➞ | |
 | PWSC PowerSchool Holdings, Inc. |
| Sector: Technology | |
| SubSector: Software - Application | |
| MarketCap: 3870 Millions | |
| Recent Price: 17.54 Smart Investing & Trading Score: 18 | |
| Day Percent Change: -0.79% Day Change: -0.14 | |
| Week Change: 0.46% Year-to-date Change: -25.8% | |
| PWSC Links: Profile News Message Board | |
| Charts:- Daily , Weekly | |
| Add PWSC to Watchlist: View: Get Complete PWSC Trend Analysis ➞ | |
| Too many stocks? View smallcap stocks filtered by marketcap & sector |
| Marketcap: All SmallCap Stocks (default-no microcap), Large, Mid-Range, Small & MicroCap |
| Sector: Tech, Finance, Energy, Staples, Retail, Industrial, Materials, Utilities & Medical |
|
Best Stocks Today 12Stocks.com |
© 2024 12Stocks.com Terms & Conditions Privacy Contact Us
All Information Provided Only For Education And Not To Be Used For Investing or Trading. See Terms & Conditions


One More Thing ... Get Best Stocks Delivered Daily!
Never Ever Miss A Move With Our Top Ten Stocks Lists
Find Best Stocks In Any Market - Bull or Bear Market
Take A Peek At Our Top Ten Stocks Lists: Daily, Weekly, Year-to-Date & Top Trends
Find Best Stocks In Any Market - Bull or Bear Market
Take A Peek At Our Top Ten Stocks Lists: Daily, Weekly, Year-to-Date & Top Trends
Smallcap Stocks With Best Up Trends [0-bearish to 100-bullish]: B. Riley[100], Ribbon [100], Group 1[100], Trustmark [100], MBIA [100], Integer [100], EchoStar [100], Comstock Resources[100], Vishay Inter[100], Jamf Holding[100], SunOpta [100]
Best Smallcap Stocks Year-to-Date:
CareMax [574.23%], Janux [352.07%], Viking [249.65%], Alpine Immune[239.13%], Longboard [223.4%], Avidity Biosciences[177.71%], Arcutis Bio[170.9%], Super Micro[165.5%], Vera [149.61%], Hippo [130.79%], Y-mAbs [124.19%] Best Smallcap Stocks This Week:
Matterport [166.09%], B. Riley[48.82%], Seres [30.29%], Riot Blockchain[30.12%], CareMax [27.24%], Ribbon [25.97%], ProKidney [23.28%], SoundHound AI[22.54%], Cipher Mining[22.14%], Hibbett Sports[21.61%], Cullinan Oncology[20.69%] Best Smallcap Stocks Daily:
B. Riley[36.97%], Ribbon [26.46%], Babcock & Wilcox Enterprises[15.57%], Cullinan Oncology[13.55%], Amneal [12.04%], Comtech Tele[10.76%], Innodata [10.28%], Gritstone Oncology[10.06%], Navitas Semiconductor[8.83%], Eyenovia [8.68%], K12 [8.64%]