
 Login Sign Up


| |||||
 |  | ||||

| 12Stocks.com Market Intelligence |
Best SmallCap Stocks
|
| In a hurry? Small Cap Stock Lists: Performance Trends Table, Stock Charts
Sort Small Cap stocks: Daily, Weekly, Year-to-Date, Market Cap & Trends. Filter Small Cap stocks list by sector: Show all, Tech, Finance, Energy, Staples, Retail, Industrial, Materials, Utilities and HealthCare Filter Small Cap stocks list by size: All Large Medium Small and MicroCap |
| 12Stocks.com Small Cap Stocks Performances & Trends Daily | |||||||||
|
|  The overall Smart Investing & Trading Score is 58 (0-bearish to 100-bullish) which puts Small Cap index in short term neutral trend. The Smart Investing & Trading Score from previous trading session is 63 and hence a deterioration of trend.
| ||||||||
Here are the Smart Investing & Trading Scores of the most requested small cap stocks at 12Stocks.com (click stock name for detailed review):
|


| 12Stocks.com: Investing in Smallcap Index with Stocks | |
|
The following table helps investors and traders sort through current performance and trends (as measured by Smart Investing & Trading Score) of various
stocks in the Smallcap Index. Quick View: Move mouse or cursor over stock symbol (ticker) to view short-term technical chart and over stock name to view long term chart. Click on  to add stock symbol to your watchlist and to add stock symbol to your watchlist and  to view watchlist. Click on any ticker or stock name for detailed market intelligence report for that stock. to view watchlist. Click on any ticker or stock name for detailed market intelligence report for that stock. |
12Stocks.com Performance of Stocks in Smallcap Index
| Ticker | Stock Name | Watchlist | Category | Recent Price | Smart Investing & Trading Score | Change % | YTD Change% |
| CDRE | Cadre |   | Industrials | 33.27 | 18 | -0.39 | 0.91% |
| SPXC | SPX | | Industrials | 119.88 | 63 | -0.40 | 18.68% |
| CURV | Torrid | | Services & Goods | 5.00 | 64 | -0.40 | -14.53% |
| LKFN | Lakeland Financial | | Financials | 62.64 | 67 | -0.41 | -3.87% |
| SHLS | Shoals | | Technology | 8.41 | 25 | -0.41 | -45.71% |
| WIRE | Encore Wire | | Technology | 282.41 | 69 | -0.42 | 32.21% |
| SCL | Stepan | | Materials | 84.89 | 42 | -0.42 | -10.22% |
| WTS | Watts Water | | Industrials | 205.76 | 68 | -0.42 | -1.24% |
| HRT | HireRight | | Industrials | 14.27 | 68 | -0.42 | 6.10% |
| CHCT | Community Healthcare | | Financials | 25.85 | 68 | -0.42 | -2.97% |
| PGRE | Paramount Group | | Financials | 4.69 | 57 | -0.42 | -9.28% |
| PETQ | PetIQ | | Health Care | 16.53 | 42 | -0.42 | -16.30% |
| FTDR | frontdoor | | Services & Goods | 30.92 | 37 | -0.42 | -12.21% |
| URBN | Urban Outfitters | | Services & Goods | 39.19 | 75 | -0.43 | 9.81% |
| HLF | Herbalife Nutrition | | Consumer Staples | 9.20 | 62 | -0.43 | -39.71% |
| PSTL | Postal Realty | | Financials | 13.82 | 60 | -0.43 | -5.08% |
| PEPG | PepGen | | Health Care | 11.70 | 68 | -0.43 | 71.05% |
| OMGA | Omega | | Health Care | 2.34 | 10 | -0.43 | -22.43% |
| DCGO | DocGo | | Health Care | 3.49 | 35 | -0.43 | -37.57% |
| ITRI | Itron | | Technology | 94.42 | 95 | -0.44 | 25.04% |
| DHT | DHT | | Transports | 11.28 | 51 | -0.44 | 14.98% |
| AGIO | Agios | | Health Care | 31.67 | 100 | -0.44 | 42.21% |
| SAFT | Safety Insurance | | Financials | 81.69 | 55 | -0.45 | 7.50% |
| IPAR | Inter Parfums | | Consumer Staples | 130.52 | 42 | -0.45 | -9.37% |
| DORM | Dorman Products | | Consumer Staples | 89.81 | 68 | -0.45 | 7.67% |


| Too many stocks? View smallcap stocks filtered by marketcap & sector |
| Marketcap: All SmallCap Stocks (default-no microcap), Large, Mid-Range, Small |
| Smallcap Sector: Tech, Finance, Energy, Staples, Retail, Industrial, Materials, & Medical |
|
Get the most comprehensive stock market coverage daily at 12Stocks.com ➞ Best Stocks Today ➞ Best Stocks Weekly ➞ Best Stocks Year-to-Date ➞ Best Stocks Trends ➞  Best Stocks Today 12Stocks.com Best Nasdaq Stocks ➞ Best S&P 500 Stocks ➞ Best Tech Stocks ➞ Best Biotech Stocks ➞ |
| Detailed Overview of SmallCap Stocks |
| SmallCap Technical Overview, Leaders & Laggards, Top SmallCap ETF Funds & Detailed SmallCap Stocks List, Charts, Trends & More |
| Smallcap: Technical Analysis, Trends & YTD Performance | |
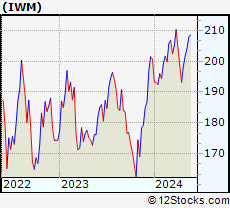
| SmallCap segment as represented by
IWM, an exchange-traded fund [ETF], holds basket of thousands of smallcap stocks from across all major sectors of the US stock market. The smallcap index (contains stocks like Riverbed & Sotheby's) is down by -1.51% and is currently underperforming the overall market by -7.17% year-to-date. Below is a quick view of technical charts and trends: | |
 IWM Weekly Chart |
|
| Long Term Trend: Good | |
| Medium Term Trend: Not Good | |
 IWM Daily Chart |
|
| Short Term Trend: Very Good | |
| Overall Trend Score: 58 | |
| YTD Performance: -1.51% | |
| **Trend Scores & Views Are Only For Educational Purposes And Not For Investing | |
| 12Stocks.com: Top Performing Small Cap Index Stocks | ||||||||||||||||||||||||||||||||||||||||||||||||
 The top performing Small Cap Index stocks year to date are
Now, more recently, over last week, the top performing Small Cap Index stocks on the move are


|
||||||||||||||||||||||||||||||||||||||||||||||||
| 12Stocks.com: Investing in Smallcap Index using Exchange Traded Funds | |
|
The following table shows list of key exchange traded funds (ETF) that
help investors track Smallcap index. The following list also includes leveraged ETF funds that track twice or thrice the daily returns of Smallcap indices. Short or inverse ETF funds move in the opposite direction to the index they track and are useful during market pullbacks or during bear markets. Quick View: Move mouse or cursor over ETF symbol (ticker) to view short-term technical chart and over ETF name to view long term chart. Click on ticker or stock name for detailed view. Click on to add stock symbol to your watchlist and to view watchlist. |
12Stocks.com List of ETFs that track Smallcap Index
| Ticker | ETF Name | Watchlist | Recent Price | Smart Investing & Trading Score | Change % | Week % | Year-to-date % |
| IWM | iShares Russell 2000 | | 197.68 | 58 | -0.45 | 2.35 | -1.51% |
| IJR | iShares Core S&P Small-Cap | | 105.71 | 85 | -0.24 | 2.41 | -2.35% |
| VTWO | Vanguard Russell 2000 ETF | | 79.93 | 48 | -0.45 | 2.37 | -1.44% |
| IWN | iShares Russell 2000 Value | | 151.28 | 75 | -0.30 | 2.37 | -2.61% |
| IWO | iShares Russell 2000 Growth | | 251.27 | 58 | -0.44 | 2.44 | -0.38% |
| IJS | iShares S&P Small-Cap 600 Value | | 97.71 | 45 | -0.43 | 2.2 | -5.2% |
| IJT | iShares S&P Small-Cap 600 Growth | | 125.37 | 48 | -0.28 | 2.59 | 0.18% |
| XSLV | PowerShares S&P SmallCap Low Volatil ETF | | 42.94 | 48 | -0.26 | 1.8 | -2.74% |
| SBB | ProShares Short SmallCap600 | | 16.37 | 33 | -0.02 | -2.79 | 2.76% |
| SMLV | SPDR SSGA US Small Cap Low Volatil ETF | | 108.43 | 73 | -0.31 | 2.21 | -3.63% |
| SAA | ProShares Ultra SmallCap600 | | 23.01 | 58 | -0.60 | 5.55 | -7.78% |
| SDD | ProShares UltraShort SmallCap600 | | 19.49 | 42 | 1.35 | -4.18 | 5.77% |
| 12Stocks.com: Charts, Trends, Fundamental Data and Performances of SmallCap Stocks | |
|
We now take in-depth look at all SmallCap stocks including charts, multi-period performances and overall trends (as measured by Smart Investing & Trading Score). One can sort SmallCap stocks (click link to choose) by Daily, Weekly and by Year-to-Date performances. Also, one can sort by size of the company or by market capitalization. |
| Select Your Default Chart Type: | |||||
| |||||
| Click on stock symbol or name for detailed view. Click on to add stock symbol to your watchlist and to view watchlist. Quick View: Move mouse or cursor over "Daily" to quickly view daily technical stock chart and over "Weekly" to view weekly technical stock chart. | |||||

 | CDRE Cadre Holdings, Inc. |
| Sector: Industrials | |
| SubSector: Aerospace & Defense | |
| MarketCap: 817 Millions | |
| Recent Price: 33.27 Smart Investing & Trading Score: 18 | |
| Day Percent Change: -0.39% Day Change: -0.13 | |
| Week Change: 1.25% Year-to-date Change: 0.9% | |
| CDRE Links: Profile News Message Board | |
| Charts:- Daily , Weekly | |
| Add CDRE to Watchlist: View: Get Complete CDRE Trend Analysis ➞ | |
 | SPXC SPX Corporation |
| Sector: Industrials | |
| SubSector: Diversified Machinery | |
| MarketCap: 1415.56 Millions | |
| Recent Price: 119.88 Smart Investing & Trading Score: 63 | |
| Day Percent Change: -0.40% Day Change: -0.48 | |
| Week Change: 3.14% Year-to-date Change: 18.7% | |
| SPXC Links: Profile News Message Board | |
| Charts:- Daily , Weekly | |
| Add SPXC to Watchlist: View: Get Complete SPXC Trend Analysis ➞ | |
 | CURV Torrid Holdings Inc. |
| Sector: Services & Goods | |
| SubSector: Apparel Retail | |
| MarketCap: 278 Millions | |
| Recent Price: 5.00 Smart Investing & Trading Score: 64 | |
| Day Percent Change: -0.40% Day Change: -0.02 | |
| Week Change: 3.52% Year-to-date Change: -14.5% | |
| CURV Links: Profile News Message Board | |
| Charts:- Daily , Weekly | |
| Add CURV to Watchlist: View: Get Complete CURV Trend Analysis ➞ | |
 | LKFN Lakeland Financial Corporation |
| Sector: Financials | |
| SubSector: Regional - Midwest Banks | |
| MarketCap: 903.27 Millions | |
| Recent Price: 62.64 Smart Investing & Trading Score: 67 | |
| Day Percent Change: -0.41% Day Change: -0.26 | |
| Week Change: 1.61% Year-to-date Change: -3.9% | |
| LKFN Links: Profile News Message Board | |
| Charts:- Daily , Weekly | |
| Add LKFN to Watchlist: View: Get Complete LKFN Trend Analysis ➞ | |
 | SHLS Shoals Technologies Group, Inc. |
| Sector: Technology | |
| SubSector: Solar | |
| MarketCap: 4360 Millions | |
| Recent Price: 8.41 Smart Investing & Trading Score: 25 | |
| Day Percent Change: -0.41% Day Change: -0.04 | |
| Week Change: 1.51% Year-to-date Change: -45.7% | |
| SHLS Links: Profile News Message Board | |
| Charts:- Daily , Weekly | |
| Add SHLS to Watchlist: View: Get Complete SHLS Trend Analysis ➞ | |
 | WIRE Encore Wire Corporation |
| Sector: Technology | |
| SubSector: Diversified Electronics | |
| MarketCap: 898.896 Millions | |
| Recent Price: 282.41 Smart Investing & Trading Score: 69 | |
| Day Percent Change: -0.42% Day Change: -1.19 | |
| Week Change: -0.7% Year-to-date Change: 32.2% | |
| WIRE Links: Profile News Message Board | |
| Charts:- Daily , Weekly | |
| Add WIRE to Watchlist: View: Get Complete WIRE Trend Analysis ➞ | |
 | SCL Stepan Company |
| Sector: Materials | |
| SubSector: Specialty Chemicals | |
| MarketCap: 1812.97 Millions | |
| Recent Price: 84.89 Smart Investing & Trading Score: 42 | |
| Day Percent Change: -0.42% Day Change: -0.36 | |
| Week Change: 0.86% Year-to-date Change: -10.2% | |
| SCL Links: Profile News Message Board | |
| Charts:- Daily , Weekly | |
| Add SCL to Watchlist: View: Get Complete SCL Trend Analysis ➞ | |
 | WTS Watts Water Technologies, Inc. |
| Sector: Industrials | |
| SubSector: Industrial Equipment & Components | |
| MarketCap: 2903.29 Millions | |
| Recent Price: 205.76 Smart Investing & Trading Score: 68 | |
| Day Percent Change: -0.42% Day Change: -0.86 | |
| Week Change: 1.25% Year-to-date Change: -1.2% | |
| WTS Links: Profile News Message Board | |
| Charts:- Daily , Weekly | |
| Add WTS to Watchlist: View: Get Complete WTS Trend Analysis ➞ | |
 | HRT HireRight Holdings Corporation |
| Sector: Industrials | |
| SubSector: Staffing & Employment Services | |
| MarketCap: 823 Millions | |
| Recent Price: 14.27 Smart Investing & Trading Score: 68 | |
| Day Percent Change: -0.42% Day Change: -0.06 | |
| Week Change: 0.21% Year-to-date Change: 6.1% | |
| HRT Links: Profile News Message Board | |
| Charts:- Daily , Weekly | |
| Add HRT to Watchlist: View: Get Complete HRT Trend Analysis ➞ | |
 | CHCT Community Healthcare Trust Incorporated |
| Sector: Financials | |
| SubSector: REIT - Healthcare Facilities | |
| MarketCap: 698.614 Millions | |
| Recent Price: 25.85 Smart Investing & Trading Score: 68 | |
| Day Percent Change: -0.42% Day Change: -0.11 | |
| Week Change: 1.33% Year-to-date Change: -3.0% | |
| CHCT Links: Profile News Message Board | |
| Charts:- Daily , Weekly | |
| Add CHCT to Watchlist: View: Get Complete CHCT Trend Analysis ➞ | |
 | PGRE Paramount Group, Inc. |
| Sector: Financials | |
| SubSector: Property Management | |
| MarketCap: 1722.72 Millions | |
| Recent Price: 4.69 Smart Investing & Trading Score: 57 | |
| Day Percent Change: -0.42% Day Change: -0.02 | |
| Week Change: 2.63% Year-to-date Change: -9.3% | |
| PGRE Links: Profile News Message Board | |
| Charts:- Daily , Weekly | |
| Add PGRE to Watchlist: View: Get Complete PGRE Trend Analysis ➞ | |
 | PETQ PetIQ, Inc. |
| Sector: Health Care | |
| SubSector: Drugs - Generic | |
| MarketCap: 587.585 Millions | |
| Recent Price: 16.53 Smart Investing & Trading Score: 42 | |
| Day Percent Change: -0.42% Day Change: -0.07 | |
| Week Change: 1.54% Year-to-date Change: -16.3% | |
| PETQ Links: Profile News Message Board | |
| Charts:- Daily , Weekly | |
| Add PETQ to Watchlist: View: Get Complete PETQ Trend Analysis ➞ | |
 | FTDR frontdoor, inc. |
| Sector: Services & Goods | |
| SubSector: Business Services | |
| MarketCap: 2974.22 Millions | |
| Recent Price: 30.92 Smart Investing & Trading Score: 37 | |
| Day Percent Change: -0.42% Day Change: -0.13 | |
| Week Change: 1.39% Year-to-date Change: -12.2% | |
| FTDR Links: Profile News Message Board | |
| Charts:- Daily , Weekly | |
| Add FTDR to Watchlist: View: Get Complete FTDR Trend Analysis ➞ | |
 | URBN Urban Outfitters, Inc. |
| Sector: Services & Goods | |
| SubSector: Apparel Stores | |
| MarketCap: 1638.08 Millions | |
| Recent Price: 39.19 Smart Investing & Trading Score: 75 | |
| Day Percent Change: -0.43% Day Change: -0.17 | |
| Week Change: 5.98% Year-to-date Change: 9.8% | |
| URBN Links: Profile News Message Board | |
| Charts:- Daily , Weekly | |
| Add URBN to Watchlist: View: Get Complete URBN Trend Analysis ➞ | |
 | HLF Herbalife Nutrition Ltd. |
| Sector: Consumer Staples | |
| SubSector: Personal Products | |
| MarketCap: 4884.65 Millions | |
| Recent Price: 9.20 Smart Investing & Trading Score: 62 | |
| Day Percent Change: -0.43% Day Change: -0.04 | |
| Week Change: 4.07% Year-to-date Change: -39.7% | |
| HLF Links: Profile News Message Board | |
| Charts:- Daily , Weekly | |
| Add HLF to Watchlist: View: Get Complete HLF Trend Analysis ➞ | |
 | PSTL Postal Realty Trust, Inc. |
| Sector: Financials | |
| SubSector: REIT - Office | |
| MarketCap: 82.9866 Millions | |
| Recent Price: 13.82 Smart Investing & Trading Score: 60 | |
| Day Percent Change: -0.43% Day Change: -0.06 | |
| Week Change: 0.44% Year-to-date Change: -5.1% | |
| PSTL Links: Profile News Message Board | |
| Charts:- Daily , Weekly | |
| Add PSTL to Watchlist: View: Get Complete PSTL Trend Analysis ➞ | |
 | PEPG PepGen Inc. |
| Sector: Health Care | |
| SubSector: Biotechnology | |
| MarketCap: 216 Millions | |
| Recent Price: 11.70 Smart Investing & Trading Score: 68 | |
| Day Percent Change: -0.43% Day Change: -0.05 | |
| Week Change: 11.06% Year-to-date Change: 71.1% | |
| PEPG Links: Profile News Message Board | |
| Charts:- Daily , Weekly | |
| Add PEPG to Watchlist: View: Get Complete PEPG Trend Analysis ➞ | |
 | OMGA Omega Therapeutics, Inc. |
| Sector: Health Care | |
| SubSector: Biotechnology | |
| MarketCap: 304 Millions | |
| Recent Price: 2.34 Smart Investing & Trading Score: 10 | |
| Day Percent Change: -0.43% Day Change: -0.01 | |
| Week Change: -2.71% Year-to-date Change: -22.4% | |
| OMGA Links: Profile News Message Board | |
| Charts:- Daily , Weekly | |
| Add OMGA to Watchlist: View: Get Complete OMGA Trend Analysis ➞ | |
 | DCGO DocGo Inc. |
| Sector: Health Care | |
| SubSector: Medical Care Facilities | |
| MarketCap: 972 Millions | |
| Recent Price: 3.49 Smart Investing & Trading Score: 35 | |
| Day Percent Change: -0.43% Day Change: -0.01 | |
| Week Change: -2.24% Year-to-date Change: -37.6% | |
| DCGO Links: Profile News Message Board | |
| Charts:- Daily , Weekly | |
| Add DCGO to Watchlist: View: Get Complete DCGO Trend Analysis ➞ | |
 | ITRI Itron, Inc. |
| Sector: Technology | |
| SubSector: Scientific & Technical Instruments | |
| MarketCap: 2222.23 Millions | |
| Recent Price: 94.42 Smart Investing & Trading Score: 95 | |
| Day Percent Change: -0.44% Day Change: -0.42 | |
| Week Change: 5.29% Year-to-date Change: 25.0% | |
| ITRI Links: Profile News Message Board | |
| Charts:- Daily , Weekly | |
| Add ITRI to Watchlist: View: Get Complete ITRI Trend Analysis ➞ | |
 | DHT DHT Holdings, Inc. |
| Sector: Transports | |
| SubSector: Shipping | |
| MarketCap: 754.514 Millions | |
| Recent Price: 11.28 Smart Investing & Trading Score: 51 | |
| Day Percent Change: -0.44% Day Change: -0.05 | |
| Week Change: 0.18% Year-to-date Change: 15.0% | |
| DHT Links: Profile News Message Board | |
| Charts:- Daily , Weekly | |
| Add DHT to Watchlist: View: Get Complete DHT Trend Analysis ➞ | |
 | AGIO Agios Pharmaceuticals, Inc. |
| Sector: Health Care | |
| SubSector: Biotechnology | |
| MarketCap: 2613.35 Millions | |
| Recent Price: 31.67 Smart Investing & Trading Score: 100 | |
| Day Percent Change: -0.44% Day Change: -0.14 | |
| Week Change: 7.25% Year-to-date Change: 42.2% | |
| AGIO Links: Profile News Message Board | |
| Charts:- Daily , Weekly | |
| Add AGIO to Watchlist: View: Get Complete AGIO Trend Analysis ➞ | |
 | SAFT Safety Insurance Group, Inc. |
| Sector: Financials | |
| SubSector: Property & Casualty Insurance | |
| MarketCap: 1145.12 Millions | |
| Recent Price: 81.69 Smart Investing & Trading Score: 55 | |
| Day Percent Change: -0.45% Day Change: -0.37 | |
| Week Change: -0.35% Year-to-date Change: 7.5% | |
| SAFT Links: Profile News Message Board | |
| Charts:- Daily , Weekly | |
| Add SAFT to Watchlist: View: Get Complete SAFT Trend Analysis ➞ | |
 | IPAR Inter Parfums, Inc. |
| Sector: Consumer Staples | |
| SubSector: Personal Products | |
| MarketCap: 1302.55 Millions | |
| Recent Price: 130.52 Smart Investing & Trading Score: 42 | |
| Day Percent Change: -0.45% Day Change: -0.59 | |
| Week Change: 2.06% Year-to-date Change: -9.4% | |
| IPAR Links: Profile News Message Board | |
| Charts:- Daily , Weekly | |
| Add IPAR to Watchlist: View: Get Complete IPAR Trend Analysis ➞ | |
 | DORM Dorman Products, Inc. |
| Sector: Consumer Staples | |
| SubSector: Auto Parts | |
| MarketCap: 2028.79 Millions | |
| Recent Price: 89.81 Smart Investing & Trading Score: 68 | |
| Day Percent Change: -0.45% Day Change: -0.41 | |
| Week Change: 1.6% Year-to-date Change: 7.7% | |
| DORM Links: Profile News Message Board | |
| Charts:- Daily , Weekly | |
| Add DORM to Watchlist: View: Get Complete DORM Trend Analysis ➞ | |
| Too many stocks? View smallcap stocks filtered by marketcap & sector |
| Marketcap: All SmallCap Stocks (default-no microcap), Large, Mid-Range, Small & MicroCap |
| Sector: Tech, Finance, Energy, Staples, Retail, Industrial, Materials, Utilities & Medical |
|
Best Stocks Today 12Stocks.com |
© 2024 12Stocks.com Terms & Conditions Privacy Contact Us
All Information Provided Only For Education And Not To Be Used For Investing or Trading. See Terms & Conditions


One More Thing ... Get Best Stocks Delivered Daily!
Never Ever Miss A Move With Our Top Ten Stocks Lists
Find Best Stocks In Any Market - Bull or Bear Market
Take A Peek At Our Top Ten Stocks Lists: Daily, Weekly, Year-to-Date & Top Trends
Find Best Stocks In Any Market - Bull or Bear Market
Take A Peek At Our Top Ten Stocks Lists: Daily, Weekly, Year-to-Date & Top Trends
Smallcap Stocks With Best Up Trends [0-bearish to 100-bullish]: B. Riley[100], Ribbon [100], Group 1[100], Trustmark [100], MBIA [100], Integer [100], EchoStar [100], Comstock Resources[100], Vishay Inter[100], Jamf Holding[100], SunOpta [100]
Best Smallcap Stocks Year-to-Date:
CareMax [574.23%], Janux [352.07%], Viking [249.65%], Alpine Immune[239.13%], Longboard [223.4%], Avidity Biosciences[177.71%], Arcutis Bio[170.9%], Super Micro[165.5%], Vera [149.61%], Hippo [130.79%], Y-mAbs [124.19%] Best Smallcap Stocks This Week:
Matterport [166.09%], B. Riley[48.82%], Seres [30.29%], Riot Blockchain[30.12%], CareMax [27.24%], Ribbon [25.97%], ProKidney [23.28%], SoundHound AI[22.54%], Cipher Mining[22.14%], Hibbett Sports[21.61%], Cullinan Oncology[20.69%] Best Smallcap Stocks Daily:
B. Riley[36.97%], Ribbon [26.46%], Babcock & Wilcox Enterprises[15.57%], Cullinan Oncology[13.55%], Amneal [12.04%], Comtech Tele[10.76%], Innodata [10.28%], Gritstone Oncology[10.06%], Navitas Semiconductor[8.83%], Eyenovia [8.68%], K12 [8.64%]