
 Login Sign Up


| |||||
 |  | ||||

| 12Stocks.com Market Intelligence |
Best SmallCap Stocks
|
| In a hurry? Small Cap Stock Lists: Performance Trends Table, Stock Charts
Sort Small Cap stocks: Daily, Weekly, Year-to-Date, Market Cap & Trends. Filter Small Cap stocks list by sector: Show all, Tech, Finance, Energy, Staples, Retail, Industrial, Materials, Utilities and HealthCare Filter Small Cap stocks list by size: All Large Medium Small and MicroCap |
| 12Stocks.com Small Cap Stocks Performances & Trends Daily | |||||||||
|
|  The overall Smart Investing & Trading Score is 58 (0-bearish to 100-bullish) which puts Small Cap index in short term neutral trend. The Smart Investing & Trading Score from previous trading session is 23 and an improvement of trend continues.
| ||||||||
Here are the Smart Investing & Trading Scores of the most requested small cap stocks at 12Stocks.com (click stock name for detailed review):
|


| 12Stocks.com: Investing in Smallcap Index with Stocks | |
|
The following table helps investors and traders sort through current performance and trends (as measured by Smart Investing & Trading Score) of various
stocks in the Smallcap Index. Quick View: Move mouse or cursor over stock symbol (ticker) to view short-term technical chart and over stock name to view long term chart. Click on  to add stock symbol to your watchlist and to add stock symbol to your watchlist and  to view watchlist. Click on any ticker or stock name for detailed market intelligence report for that stock. to view watchlist. Click on any ticker or stock name for detailed market intelligence report for that stock. |
12Stocks.com Performance of Stocks in Smallcap Index
| Ticker | Stock Name | Watchlist | Category | Recent Price | Smart Investing & Trading Score | Change % | YTD Change% |
| KRT | Karat Packaging |   | Services & Goods | 26.82 | 26 | 1.80 | 7.65% |
| TRMK | Trustmark | | Financials | 27.23 | 49 | 1.79 | -2.33% |
| TPH | TRI Pointe | | Industrials | 35.90 | 58 | 1.79 | 1.41% |
| HLLY | Holley | | Services & Goods | 4.25 | 54 | 1.79 | -14.30% |
| IPAR | Inter Parfums | | Consumer Staples | 131.82 | 49 | 1.78 | -8.46% |
| BCOV | Brightcove | | Technology | 1.72 | 30 | 1.78 | -33.59% |
| WAFD | Washington Federal | | Financials | 28.61 | 74 | 1.78 | -13.20% |
| AVTE | Aerovate | | Health Care | 22.57 | 53 | 1.78 | -0.02% |
| CRDO | Credo | | Technology | 17.63 | 17 | 1.76 | -9.89% |
| AWR | American States | | Utilities | 70.17 | 59 | 1.75 | -12.74% |
| CVLT | Commvault Systems | | Technology | 97.22 | 63 | 1.75 | 21.75% |
| WINA | Winmark | | Services & Goods | 384.75 | 90 | 1.75 | -7.86% |
| HLMN | Hillman Solutions | | Industrials | 9.57 | 48 | 1.75 | 3.57% |
| LGIH | LGI Homes | | Financials | 95.55 | 42 | 1.74 | -28.24% |
| RNST | Renasant | | Financials | 30.53 | 67 | 1.73 | -9.35% |
| AMPL | Amplitude | | Technology | 10.01 | 42 | 1.73 | -21.55% |
| CAKE | Cheesecake Factory | | Services & Goods | 34.90 | 70 | 1.72 | -0.31% |
| DCO | Ducommun | | Industrials | 53.13 | 78 | 1.72 | 2.06% |
| USPH | U.S. Physical | | Health Care | 101.64 | 63 | 1.71 | 9.13% |
| DIOD | Diodes | | Technology | 69.07 | 86 | 1.71 | -14.22% |
| ACLS | Axcelis | | Technology | 98.61 | 27 | 1.70 | -23.96% |
| BJRI | BJ s | | Services & Goods | 32.31 | 18 | 1.70 | -10.27% |
| FWRD | Forward Air | | Transports | 23.95 | 52 | 1.70 | -61.91% |
| MTH | Meritage Homes | | Industrials | 154.64 | 32 | 1.69 | -11.23% |
| COHU | Cohu | | Technology | 29.56 | 27 | 1.69 | -16.47% |
| For chart view version of above stock list: Chart View ➞ 0 - 25 , 25 - 50 , 50 - 75 , 75 - 100 , 100 - 125 , 125 - 150 , 150 - 175 , 175 - 200 , 200 - 225 , 225 - 250 , 250 - 275 , 275 - 300 , 300 - 325 , 325 - 350 , 350 - 375 , 375 - 400 , 400 - 425 , 425 - 450 , 450 - 475 , 475 - 500 , 500 - 525 , 525 - 550 , 550 - 575 , 575 - 600 , 600 - 625 , 625 - 650 , 650 - 675 , 675 - 700 , 700 - 725 , 725 - 750 , 750 - 775 , 775 - 800 , 800 - 825 , 825 - 850 , 850 - 875 , 875 - 900 , 900 - 925 , 925 - 950 , 950 - 975 , 975 - 1000 , 1000 - 1025 , 1025 - 1050 , 1050 - 1075 , 1075 - 1100 , 1100 - 1125 , 1125 - 1150 , 1150 - 1175 , 1175 - 1200 , 1200 - 1225 , 1225 - 1250 , 1250 - 1275 , 1275 - 1300 , 1300 - 1325 , 1325 - 1350 , 1350 - 1375 | ||
 | Click To Change The Sort Order: By Market Cap or Company Size Performance: Year-to-date, Week and Day |  |
| Too many stocks? View smallcap stocks filtered by marketcap & sector |
| Marketcap: All SmallCap Stocks (default-no microcap), Large, Mid-Range, Small |
| Smallcap Sector: Tech, Finance, Energy, Staples, Retail, Industrial, Materials, & Medical |
|
Get the most comprehensive stock market coverage daily at 12Stocks.com ➞ Best Stocks Today ➞ Best Stocks Weekly ➞ Best Stocks Year-to-Date ➞ Best Stocks Trends ➞  Best Stocks Today 12Stocks.com Best Nasdaq Stocks ➞ Best S&P 500 Stocks ➞ Best Tech Stocks ➞ Best Biotech Stocks ➞ |
| Detailed Overview of SmallCap Stocks |
| SmallCap Technical Overview, Leaders & Laggards, Top SmallCap ETF Funds & Detailed SmallCap Stocks List, Charts, Trends & More |
| Smallcap: Technical Analysis, Trends & YTD Performance | |
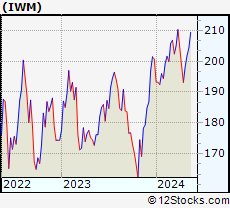
| SmallCap segment as represented by
IWM, an exchange-traded fund [ETF], holds basket of thousands of smallcap stocks from across all major sectors of the US stock market. The smallcap index (contains stocks like Riverbed & Sotheby's) is down by -1.52% and is currently underperforming the overall market by -6.66% year-to-date. Below is a quick view of technical charts and trends: | |
 IWM Weekly Chart |
|
| Long Term Trend: Good | |
| Medium Term Trend: Not Good | |
 IWM Daily Chart |
|
| Short Term Trend: Very Good | |
| Overall Trend Score: 58 | |
| YTD Performance: -1.52% | |
| **Trend Scores & Views Are Only For Educational Purposes And Not For Investing | |
| 12Stocks.com: Top Performing Small Cap Index Stocks | ||||||||||||||||||||||||||||||||||||||||||||||||
 The top performing Small Cap Index stocks year to date are
Now, more recently, over last week, the top performing Small Cap Index stocks on the move are


|
||||||||||||||||||||||||||||||||||||||||||||||||
| 12Stocks.com: Investing in Smallcap Index using Exchange Traded Funds | |
|
The following table shows list of key exchange traded funds (ETF) that
help investors track Smallcap index. The following list also includes leveraged ETF funds that track twice or thrice the daily returns of Smallcap indices. Short or inverse ETF funds move in the opposite direction to the index they track and are useful during market pullbacks or during bear markets. Quick View: Move mouse or cursor over ETF symbol (ticker) to view short-term technical chart and over ETF name to view long term chart. Click on ticker or stock name for detailed view. Click on to add stock symbol to your watchlist and to view watchlist. |
12Stocks.com List of ETFs that track Smallcap Index
| Ticker | ETF Name | Watchlist | Recent Price | Smart Investing & Trading Score | Change % | Week % | Year-to-date % |
| IWM | iShares Russell 2000 | | 197.66 | 58 | 1.21 | 2.34 | -1.52% |
| VTWO | Vanguard Russell 2000 ETF | | 79.92 | 65 | 1.27 | 2.36 | -1.45% |
| IJR | iShares Core S&P Small-Cap | | 105.23 | 45 | 1.71 | 1.95 | -2.79% |
| IWN | iShares Russell 2000 Value | | 150.98 | 63 | 0.98 | 2.17 | -2.8% |
| IWO | iShares Russell 2000 Growth | | 251.63 | 51 | 1.50 | 2.58 | -0.23% |
| IJS | iShares S&P Small-Cap 600 Value | | 97.52 | 39 | 1.13 | 2 | -5.38% |
| IJT | iShares S&P Small-Cap 600 Growth | | 123.36 | 70 | 0.00 | 0.94 | -1.42% |
| XSLV | PowerShares S&P SmallCap Low Volatil ETF | | 42.74 | 62 | 0.72 | 1.34 | -3.18% |
| 12Stocks.com: Charts, Trends, Fundamental Data and Performances of SmallCap Stocks | |
|
We now take in-depth look at all SmallCap stocks including charts, multi-period performances and overall trends (as measured by Smart Investing & Trading Score). One can sort SmallCap stocks (click link to choose) by Daily, Weekly and by Year-to-Date performances. Also, one can sort by size of the company or by market capitalization. |
| Select Your Default Chart Type: | |||||
| |||||
| Click on stock symbol or name for detailed view. Click on to add stock symbol to your watchlist and to view watchlist. Quick View: Move mouse or cursor over "Daily" to quickly view daily technical stock chart and over "Weekly" to view weekly technical stock chart. | |||||

 | KRT Karat Packaging Inc. |
| Sector: Services & Goods | |
| SubSector: Packaging & Containers | |
| MarketCap: 357 Millions | |
| Recent Price: 26.82 Smart Investing & Trading Score: 26 | |
| Day Percent Change: 1.80% Day Change: 0.48 | |
| Week Change: -0.06% Year-to-date Change: 7.7% | |
| KRT Links: Profile News Message Board | |
| Charts:- Daily , Weekly | |
| Add KRT to Watchlist: View: Get Complete KRT Trend Analysis ➞ | |
 | TRMK Trustmark Corporation |
| Sector: Financials | |
| SubSector: Regional - Southeast Banks | |
| MarketCap: 1630.15 Millions | |
| Recent Price: 27.23 Smart Investing & Trading Score: 49 | |
| Day Percent Change: 1.79% Day Change: 0.48 | |
| Week Change: 1.87% Year-to-date Change: -2.3% | |
| TRMK Links: Profile News Message Board | |
| Charts:- Daily , Weekly | |
| Add TRMK to Watchlist: View: Get Complete TRMK Trend Analysis ➞ | |
 | TPH TRI Pointe Group, Inc. |
| Sector: Industrials | |
| SubSector: Residential Construction | |
| MarketCap: 1140.06 Millions | |
| Recent Price: 35.90 Smart Investing & Trading Score: 58 | |
| Day Percent Change: 1.79% Day Change: 0.63 | |
| Week Change: 2.78% Year-to-date Change: 1.4% | |
| TPH Links: Profile News Message Board | |
| Charts:- Daily , Weekly | |
| Add TPH to Watchlist: View: Get Complete TPH Trend Analysis ➞ | |
 | HLLY Holley Inc. |
| Sector: Services & Goods | |
| SubSector: Auto Parts | |
| MarketCap: 469 Millions | |
| Recent Price: 4.25 Smart Investing & Trading Score: 54 | |
| Day Percent Change: 1.79% Day Change: 0.08 | |
| Week Change: 1.79% Year-to-date Change: -14.3% | |
| HLLY Links: Profile News Message Board | |
| Charts:- Daily , Weekly | |
| Add HLLY to Watchlist: View: Get Complete HLLY Trend Analysis ➞ | |
 | IPAR Inter Parfums, Inc. |
| Sector: Consumer Staples | |
| SubSector: Personal Products | |
| MarketCap: 1302.55 Millions | |
| Recent Price: 131.82 Smart Investing & Trading Score: 49 | |
| Day Percent Change: 1.78% Day Change: 2.30 | |
| Week Change: 3.08% Year-to-date Change: -8.5% | |
| IPAR Links: Profile News Message Board | |
| Charts:- Daily , Weekly | |
| Add IPAR to Watchlist: View: Get Complete IPAR Trend Analysis ➞ | |
 | BCOV Brightcove Inc. |
| Sector: Technology | |
| SubSector: Application Software | |
| MarketCap: 266.162 Millions | |
| Recent Price: 1.72 Smart Investing & Trading Score: 30 | |
| Day Percent Change: 1.78% Day Change: 0.03 | |
| Week Change: -1.15% Year-to-date Change: -33.6% | |
| BCOV Links: Profile News Message Board | |
| Charts:- Daily , Weekly | |
| Add BCOV to Watchlist: View: Get Complete BCOV Trend Analysis ➞ | |
 | WAFD Washington Federal, Inc. |
| Sector: Financials | |
| SubSector: Savings & Loans | |
| MarketCap: 2219.2 Millions | |
| Recent Price: 28.61 Smart Investing & Trading Score: 74 | |
| Day Percent Change: 1.78% Day Change: 0.50 | |
| Week Change: 2.54% Year-to-date Change: -13.2% | |
| WAFD Links: Profile News Message Board | |
| Charts:- Daily , Weekly | |
| Add WAFD to Watchlist: View: Get Complete WAFD Trend Analysis ➞ | |
 | AVTE Aerovate Therapeutics, Inc. |
| Sector: Health Care | |
| SubSector: Biotechnology | |
| MarketCap: 478 Millions | |
| Recent Price: 22.57 Smart Investing & Trading Score: 53 | |
| Day Percent Change: 1.78% Day Change: 0.39 | |
| Week Change: 2.34% Year-to-date Change: 0.0% | |
| AVTE Links: Profile News Message Board | |
| Charts:- Daily , Weekly | |
| Add AVTE to Watchlist: View: Get Complete AVTE Trend Analysis ➞ | |
 | CRDO Credo Technology Group Holding Ltd |
| Sector: Technology | |
| SubSector: Communication Equipment | |
| MarketCap: 2590 Millions | |
| Recent Price: 17.63 Smart Investing & Trading Score: 17 | |
| Day Percent Change: 1.76% Day Change: 0.30 | |
| Week Change: 4.17% Year-to-date Change: -9.9% | |
| CRDO Links: Profile News Message Board | |
| Charts:- Daily , Weekly | |
| Add CRDO to Watchlist: View: Get Complete CRDO Trend Analysis ➞ | |
 | AWR American States Water Company |
| Sector: Utilities | |
| SubSector: Water Utilities | |
| MarketCap: 3519.12 Millions | |
| Recent Price: 70.17 Smart Investing & Trading Score: 59 | |
| Day Percent Change: 1.75% Day Change: 1.20 | |
| Week Change: 1.34% Year-to-date Change: -12.7% | |
| AWR Links: Profile News Message Board | |
| Charts:- Daily , Weekly | |
| Add AWR to Watchlist: View: Get Complete AWR Trend Analysis ➞ | |
 | CVLT Commvault Systems, Inc. |
| Sector: Technology | |
| SubSector: Application Software | |
| MarketCap: 1607.22 Millions | |
| Recent Price: 97.22 Smart Investing & Trading Score: 63 | |
| Day Percent Change: 1.75% Day Change: 1.67 | |
| Week Change: 2.47% Year-to-date Change: 21.8% | |
| CVLT Links: Profile News Message Board | |
| Charts:- Daily , Weekly | |
| Add CVLT to Watchlist: View: Get Complete CVLT Trend Analysis ➞ | |
 | WINA Winmark Corporation |
| Sector: Services & Goods | |
| SubSector: Specialty Retail, Other | |
| MarketCap: 520.444 Millions | |
| Recent Price: 384.75 Smart Investing & Trading Score: 90 | |
| Day Percent Change: 1.75% Day Change: 6.60 | |
| Week Change: 0.28% Year-to-date Change: -7.9% | |
| WINA Links: Profile News Message Board | |
| Charts:- Daily , Weekly | |
| Add WINA to Watchlist: View: Get Complete WINA Trend Analysis ➞ | |
 | HLMN Hillman Solutions Corp. |
| Sector: Industrials | |
| SubSector: Tools & Accessories | |
| MarketCap: 1720 Millions | |
| Recent Price: 9.57 Smart Investing & Trading Score: 48 | |
| Day Percent Change: 1.75% Day Change: 0.16 | |
| Week Change: 2.3% Year-to-date Change: 3.6% | |
| HLMN Links: Profile News Message Board | |
| Charts:- Daily , Weekly | |
| Add HLMN to Watchlist: View: Get Complete HLMN Trend Analysis ➞ | |
 | LGIH LGI Homes, Inc. |
| Sector: Financials | |
| SubSector: Real Estate Development | |
| MarketCap: 1316.49 Millions | |
| Recent Price: 95.55 Smart Investing & Trading Score: 42 | |
| Day Percent Change: 1.74% Day Change: 1.63 | |
| Week Change: 2.32% Year-to-date Change: -28.2% | |
| LGIH Links: Profile News Message Board | |
| Charts:- Daily , Weekly | |
| Add LGIH to Watchlist: View: Get Complete LGIH Trend Analysis ➞ | |
 | RNST Renasant Corporation |
| Sector: Financials | |
| SubSector: Money Center Banks | |
| MarketCap: 1279.39 Millions | |
| Recent Price: 30.53 Smart Investing & Trading Score: 67 | |
| Day Percent Change: 1.73% Day Change: 0.52 | |
| Week Change: 2.45% Year-to-date Change: -9.4% | |
| RNST Links: Profile News Message Board | |
| Charts:- Daily , Weekly | |
| Add RNST to Watchlist: View: Get Complete RNST Trend Analysis ➞ | |
 | AMPL Amplitude, Inc. |
| Sector: Technology | |
| SubSector: Software - Application | |
| MarketCap: 1320 Millions | |
| Recent Price: 10.01 Smart Investing & Trading Score: 42 | |
| Day Percent Change: 1.73% Day Change: 0.17 | |
| Week Change: 5.81% Year-to-date Change: -21.6% | |
| AMPL Links: Profile News Message Board | |
| Charts:- Daily , Weekly | |
| Add AMPL to Watchlist: View: Get Complete AMPL Trend Analysis ➞ | |
 | CAKE The Cheesecake Factory Incorporated |
| Sector: Services & Goods | |
| SubSector: Restaurants | |
| MarketCap: 829 Millions | |
| Recent Price: 34.90 Smart Investing & Trading Score: 70 | |
| Day Percent Change: 1.72% Day Change: 0.59 | |
| Week Change: 2.65% Year-to-date Change: -0.3% | |
| CAKE Links: Profile News Message Board | |
| Charts:- Daily , Weekly | |
| Add CAKE to Watchlist: View: Get Complete CAKE Trend Analysis ➞ | |
 | DCO Ducommun Incorporated |
| Sector: Industrials | |
| SubSector: Aerospace/Defense Products & Services | |
| MarketCap: 261.101 Millions | |
| Recent Price: 53.13 Smart Investing & Trading Score: 78 | |
| Day Percent Change: 1.72% Day Change: 0.90 | |
| Week Change: 2.13% Year-to-date Change: 2.1% | |
| DCO Links: Profile News Message Board | |
| Charts:- Daily , Weekly | |
| Add DCO to Watchlist: View: Get Complete DCO Trend Analysis ➞ | |
 | USPH U.S. Physical Therapy, Inc. |
| Sector: Health Care | |
| SubSector: Specialized Health Services | |
| MarketCap: 793.556 Millions | |
| Recent Price: 101.64 Smart Investing & Trading Score: 63 | |
| Day Percent Change: 1.71% Day Change: 1.71 | |
| Week Change: 2.57% Year-to-date Change: 9.1% | |
| USPH Links: Profile News Message Board | |
| Charts:- Daily , Weekly | |
| Add USPH to Watchlist: View: Get Complete USPH Trend Analysis ➞ | |
 | DIOD Diodes Incorporated |
| Sector: Technology | |
| SubSector: Semiconductor - Integrated Circuits | |
| MarketCap: 1967.6 Millions | |
| Recent Price: 69.07 Smart Investing & Trading Score: 86 | |
| Day Percent Change: 1.71% Day Change: 1.16 | |
| Week Change: 3.26% Year-to-date Change: -14.2% | |
| DIOD Links: Profile News Message Board | |
| Charts:- Daily , Weekly | |
| Add DIOD to Watchlist: View: Get Complete DIOD Trend Analysis ➞ | |
 | ACLS Axcelis Technologies, Inc. |
| Sector: Technology | |
| SubSector: Semiconductor Equipment & Materials | |
| MarketCap: 498.518 Millions | |
| Recent Price: 98.61 Smart Investing & Trading Score: 27 | |
| Day Percent Change: 1.70% Day Change: 1.65 | |
| Week Change: 4.03% Year-to-date Change: -24.0% | |
| ACLS Links: Profile News Message Board | |
| Charts:- Daily , Weekly | |
| Add ACLS to Watchlist: View: Get Complete ACLS Trend Analysis ➞ | |
 | BJRI BJ s Restaurants, Inc. |
| Sector: Services & Goods | |
| SubSector: Restaurants | |
| MarketCap: 183.67 Millions | |
| Recent Price: 32.31 Smart Investing & Trading Score: 18 | |
| Day Percent Change: 1.70% Day Change: 0.54 | |
| Week Change: 0.65% Year-to-date Change: -10.3% | |
| BJRI Links: Profile News Message Board | |
| Charts:- Daily , Weekly | |
| Add BJRI to Watchlist: View: Get Complete BJRI Trend Analysis ➞ | |
 | FWRD Forward Air Corporation |
| Sector: Transports | |
| SubSector: Air Delivery & Freight Services | |
| MarketCap: 1278.88 Millions | |
| Recent Price: 23.95 Smart Investing & Trading Score: 52 | |
| Day Percent Change: 1.70% Day Change: 0.40 | |
| Week Change: 0.71% Year-to-date Change: -61.9% | |
| FWRD Links: Profile News Message Board | |
| Charts:- Daily , Weekly | |
| Add FWRD to Watchlist: View: Get Complete FWRD Trend Analysis ➞ | |
 | MTH Meritage Homes Corporation |
| Sector: Industrials | |
| SubSector: Residential Construction | |
| MarketCap: 1440.36 Millions | |
| Recent Price: 154.64 Smart Investing & Trading Score: 32 | |
| Day Percent Change: 1.69% Day Change: 2.57 | |
| Week Change: 2.8% Year-to-date Change: -11.2% | |
| MTH Links: Profile News Message Board | |
| Charts:- Daily , Weekly | |
| Add MTH to Watchlist: View: Get Complete MTH Trend Analysis ➞ | |
 | COHU Cohu, Inc. |
| Sector: Technology | |
| SubSector: Semiconductor Equipment & Materials | |
| MarketCap: 519.518 Millions | |
| Recent Price: 29.56 Smart Investing & Trading Score: 27 | |
| Day Percent Change: 1.69% Day Change: 0.49 | |
| Week Change: 2.71% Year-to-date Change: -16.5% | |
| COHU Links: Profile News Message Board | |
| Charts:- Daily , Weekly | |
| Add COHU to Watchlist: View: Get Complete COHU Trend Analysis ➞ | |
| For tabular summary view of above stock list: Summary View ➞ 0 - 25 , 25 - 50 , 50 - 75 , 75 - 100 , 100 - 125 , 125 - 150 , 150 - 175 , 175 - 200 , 200 - 225 , 225 - 250 , 250 - 275 , 275 - 300 , 300 - 325 , 325 - 350 , 350 - 375 , 375 - 400 , 400 - 425 , 425 - 450 , 450 - 475 , 475 - 500 , 500 - 525 , 525 - 550 , 550 - 575 , 575 - 600 , 600 - 625 , 625 - 650 , 650 - 675 , 675 - 700 , 700 - 725 , 725 - 750 , 750 - 775 , 775 - 800 , 800 - 825 , 825 - 850 , 850 - 875 , 875 - 900 , 900 - 925 , 925 - 950 , 950 - 975 , 975 - 1000 , 1000 - 1025 , 1025 - 1050 , 1050 - 1075 , 1075 - 1100 , 1100 - 1125 , 1125 - 1150 , 1150 - 1175 , 1175 - 1200 , 1200 - 1225 , 1225 - 1250 , 1250 - 1275 , 1275 - 1300 , 1300 - 1325 , 1325 - 1350 , 1350 - 1375 | ||
| Click To Change The Sort Order: By Market Cap or Company Size Performance: Year-to-date, Week and Day | |
| Select Chart Type: | ||
| Too many stocks? View smallcap stocks filtered by marketcap & sector |
| Marketcap: All SmallCap Stocks (default-no microcap), Large, Mid-Range, Small & MicroCap |
| Sector: Tech, Finance, Energy, Staples, Retail, Industrial, Materials, Utilities & Medical |
|
Best Stocks Today 12Stocks.com |
© 2024 12Stocks.com Terms & Conditions Privacy Contact Us
All Information Provided Only For Education And Not To Be Used For Investing or Trading. See Terms & Conditions


One More Thing ... Get Best Stocks Delivered Daily!
Never Ever Miss A Move With Our Top Ten Stocks Lists
Find Best Stocks In Any Market - Bull or Bear Market
Take A Peek At Our Top Ten Stocks Lists: Daily, Weekly, Year-to-Date & Top Trends
Find Best Stocks In Any Market - Bull or Bear Market
Take A Peek At Our Top Ten Stocks Lists: Daily, Weekly, Year-to-Date & Top Trends
Smallcap Stocks With Best Up Trends [0-bearish to 100-bullish]: Riot Blockchain[100], Payoneer Global[100], Gannett Co[100], Vertex Energy[100], Cricut [100], Piedmont Office[100], Badger Meter[100], Liberty Latin[100], Napco Security[100], Mercury General[100], BancFirst [100]
Best Smallcap Stocks Year-to-Date:
Janux [365.24%], Viking [246.13%], Longboard [219.64%], Super Micro[167.81%], Vera [163.02%], Hippo [129.8%], MicroStrategy [113.41%], Sana [99.27%], Verde Clean[97%], Dyne [90.56%], SoundHound AI[89.95%] Best Smallcap Stocks This Week:
Matterport [166.95%], ProKidney [31.37%], Riot Blockchain[31.11%], Cipher Mining[23.83%], Hibbett Sports[21.03%], BigBear.ai [18.62%], Prime Medicine[15.3%], Marathon Patent[15.21%], MicroStrategy [14.8%], SoundHound AI[14.51%], Stem [13.55%] Best Smallcap Stocks Daily:
Hibbett Sports[18.78%], Marathon Patent[17.38%], SES AI[16.52%], FuelCell Energy[13.40%], Heron [11.39%], BigBear.ai [10.26%], Digital Turbine[10.22%], Aceto [9.50%], HealthStream [9.12%], Prime Medicine[8.79%], BioLife Solutions[8.72%]