
 Login Sign Up


| |||||
 |  | ||||

| 12Stocks.com Market Intelligence |
Best SmallCap Stocks
|
| In a hurry? Small Cap Stock Lists: Performance Trends Table, Stock Charts
Sort Small Cap stocks: Daily, Weekly, Year-to-Date, Market Cap & Trends. Filter Small Cap stocks list by sector: Show all, Tech, Finance, Energy, Staples, Retail, Industrial, Materials, Utilities and HealthCare Filter Small Cap stocks list by size: All Large Medium Small and MicroCap |
| 12Stocks.com Small Cap Stocks Performances & Trends Daily | |||||||||
|
|  The overall Smart Investing & Trading Score is 70 (0-bearish to 100-bullish) which puts Small Cap index in short term neutral to bullish trend. The Smart Investing & Trading Score from previous trading session is 87 and hence a deterioration of trend.
| ||||||||
Here are the Smart Investing & Trading Scores of the most requested small cap stocks at 12Stocks.com (click stock name for detailed review):
|


| 12Stocks.com: Investing in Smallcap Index with Stocks | |
|
The following table helps investors and traders sort through current performance and trends (as measured by Smart Investing & Trading Score) of various
stocks in the Smallcap Index. Quick View: Move mouse or cursor over stock symbol (ticker) to view short-term technical chart and over stock name to view long term chart. Click on  to add stock symbol to your watchlist and to add stock symbol to your watchlist and  to view watchlist. Click on any ticker or stock name for detailed market intelligence report for that stock. to view watchlist. Click on any ticker or stock name for detailed market intelligence report for that stock. |
12Stocks.com Performance of Stocks in Smallcap Index
| Ticker | Stock Name | Watchlist | Category | Recent Price | Smart Investing & Trading Score | Change % | YTD Change% |
| YOU | Clear Secure |   | Technology | 17.18 | 0 | -4.98 | -17.08% |
| OPK | OPKO Health | | Health Care | 1.24 | 51 | -5.00 | -18.21% |
| NXT | Nextracker | | Technology | 43.72 | 7 | -5.01 | -6.45% |
| QTRX | Quanterix | | Health Care | 16.51 | 57 | -5.01 | -39.61% |
| TRUE | TrueCar | | Technology | 2.73 | 10 | -5.03 | -20.95% |
| CNNE | Cannae | | Financials | 19.74 | 57 | -5.05 | 1.18% |
| IHRT | iHeartMedia | | Services & Goods | 2.16 | 57 | -5.05 | -19.10% |
| CMTG | Claros Mortgage | | Financials | 8.21 | 10 | -5.14 | -40.79% |
| ALLO | Allogene | | Health Care | 2.76 | 10 | -5.15 | -14.02% |
| PCT | PureCycle | | Industrials | 4.76 | 10 | -5.18 | 17.39% |
| BIRD | Allbirds | | Services & Goods | 0.63 | 57 | -5.21 | -48.70% |
| CARA | Cara | | Health Care | 0.75 | 57 | -5.33 | 0.94% |
| CRC | California Resources | | Energy | 50.09 | 0 | -5.38 | -8.39% |
| ASRT | Assertio | | Health Care | 1.05 | 83 | -5.41 | -2.78% |
| AMRK | A-Mark Precious | | Financials | 38.15 | 51 | -5.43 | 26.12% |
| CDLX | Cardlytics | | Technology | 14.59 | 88 | -5.44 | 58.41% |
| ATRC | AtriCure | | Health Care | 20.67 | 10 | -5.49 | -42.08% |
| XMTR | Xometry | | Industrials | 15.49 | 25 | -5.49 | -57.83% |
| CGEM | Cullinan Oncology | | Health Care | 27.73 | 83 | -5.52 | 172.00% |
| upst | Upstart | | Financials | 23.11 | 32 | -5.56 | -42.95% |
| SPWR | SunPower | | Technology | 2.20 | 27 | -5.58 | -54.45% |
| SANA | Sana | | Health Care | 9.48 | 50 | -5.58 | 129.26% |
| CMPX | Compass | | Health Care | 1.59 | 50 | -5.65 | 3.26% |
| AMPL | Amplitude | | Technology | 9.43 | 50 | -5.70 | -26.10% |
| ALXO | ALX Oncology | | Health Care | 16.56 | 78 | -5.72 | 11.26% |


| Too many stocks? View smallcap stocks filtered by marketcap & sector |
| Marketcap: All SmallCap Stocks (default-no microcap), Large, Mid-Range, Small |
| Smallcap Sector: Tech, Finance, Energy, Staples, Retail, Industrial, Materials, & Medical |
|
Get the most comprehensive stock market coverage daily at 12Stocks.com ➞ Best Stocks Today ➞ Best Stocks Weekly ➞ Best Stocks Year-to-Date ➞ Best Stocks Trends ➞  Best Stocks Today 12Stocks.com Best Nasdaq Stocks ➞ Best S&P 500 Stocks ➞ Best Tech Stocks ➞ Best Biotech Stocks ➞ |
| Detailed Overview of SmallCap Stocks |
| SmallCap Technical Overview, Leaders & Laggards, Top SmallCap ETF Funds & Detailed SmallCap Stocks List, Charts, Trends & More |
| Smallcap: Technical Analysis, Trends & YTD Performance | |
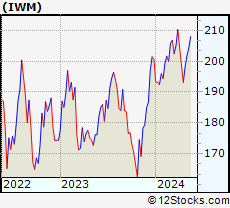
| SmallCap segment as represented by
IWM, an exchange-traded fund [ETF], holds basket of thousands of smallcap stocks from across all major sectors of the US stock market. The smallcap index (contains stocks like Riverbed & Sotheby's) is up by 1.53% and is currently underperforming the overall market by -6.51% year-to-date. Below is a quick view of technical charts and trends: | |
 IWM Weekly Chart |
|
| Long Term Trend: Deteriorating | |
| Medium Term Trend: Very Good | |
 IWM Daily Chart |
|
| Short Term Trend: Good | |
| Overall Trend Score: 70 | |
| YTD Performance: 1.53% | |
| **Trend Scores & Views Are Only For Educational Purposes And Not For Investing | |
| 12Stocks.com: Top Performing Small Cap Index Stocks | ||||||||||||||||||||||||||||||||||||||||||||||||
 The top performing Small Cap Index stocks year to date are
Now, more recently, over last week, the top performing Small Cap Index stocks on the move are


|
||||||||||||||||||||||||||||||||||||||||||||||||
| 12Stocks.com: Investing in Smallcap Index using Exchange Traded Funds | |
|
The following table shows list of key exchange traded funds (ETF) that
help investors track Smallcap index. The following list also includes leveraged ETF funds that track twice or thrice the daily returns of Smallcap indices. Short or inverse ETF funds move in the opposite direction to the index they track and are useful during market pullbacks or during bear markets. Quick View: Move mouse or cursor over ETF symbol (ticker) to view short-term technical chart and over ETF name to view long term chart. Click on ticker or stock name for detailed view. Click on to add stock symbol to your watchlist and to view watchlist. |
12Stocks.com List of ETFs that track Smallcap Index
| Ticker | ETF Name | Watchlist | Recent Price | Smart Investing & Trading Score | Change % | Week % | Year-to-date % |
| IWM | iShares Russell 2000 | | 203.78 | 70 | -0.58 | 0.93 | 1.53% |
| IJR | iShares Core S&P Small-Cap | | 108.26 | 58 | -0.33 | 1.05 | 0.01% |
| IWN | iShares Russell 2000 Value | | 155.37 | 76 | -0.17 | 0.75 | 0.03% |
| VTWO | Vanguard Russell 2000 ETF | | 82.40 | 57 | -0.53 | 0.97 | 1.6% |
| IWO | iShares Russell 2000 Growth | | 260.10 | 57 | -0.84 | 1.26 | 3.12% |
| IJS | iShares S&P Small-Cap 600 Value | | 99.80 | 40 | 0.12 | 1.09 | -3.17% |
| IJT | iShares S&P Small-Cap 600 Growth | | 129.03 | 71 | -0.62 | 0.99 | 3.11% |
| XSLV | PowerShares S&P SmallCap Low Volatil ETF | | 43.94 | 95 | -0.14 | 1.67 | -0.48% |
| SMLV | SPDR SSGA US Small Cap Low Volatil ETF | | 110.32 | 63 | -0.15 | 0.57 | -1.96% |
| SDD | ProShares UltraShort SmallCap600 | | 18.66 | 40 | 2.43 | -0.98 | 1.27% |
| SBB | ProShares Short SmallCap600 | | 16.08 | 25 | 0.69 | -0.5 | 0.94% |
| SAA | ProShares Ultra SmallCap600 | | 24.21 | 70 | -0.75 | 2.62 | -2.98% |
| 12Stocks.com: Charts, Trends, Fundamental Data and Performances of SmallCap Stocks | |
|
We now take in-depth look at all SmallCap stocks including charts, multi-period performances and overall trends (as measured by Smart Investing & Trading Score). One can sort SmallCap stocks (click link to choose) by Daily, Weekly and by Year-to-Date performances. Also, one can sort by size of the company or by market capitalization. |
| Select Your Default Chart Type: | |||||
| |||||
| Click on stock symbol or name for detailed view. Click on to add stock symbol to your watchlist and to view watchlist. Quick View: Move mouse or cursor over "Daily" to quickly view daily technical stock chart and over "Weekly" to view weekly technical stock chart. | |||||

 | YOU Clear Secure, Inc. |
| Sector: Technology | |
| SubSector: Software - Application | |
| MarketCap: 3510 Millions | |
| Recent Price: 17.18 Smart Investing & Trading Score: 0 | |
| Day Percent Change: -4.98% Day Change: -0.90 | |
| Week Change: -3.65% Year-to-date Change: -17.1% | |
| YOU Links: Profile News Message Board | |
| Charts:- Daily , Weekly | |
| Add YOU to Watchlist: View: Get Complete YOU Trend Analysis ➞ | |
 | OPK OPKO Health, Inc. |
| Sector: Health Care | |
| SubSector: Biotechnology | |
| MarketCap: 1116.05 Millions | |
| Recent Price: 1.24 Smart Investing & Trading Score: 51 | |
| Day Percent Change: -5.00% Day Change: -0.06 | |
| Week Change: -5% Year-to-date Change: -18.2% | |
| OPK Links: Profile News Message Board | |
| Charts:- Daily , Weekly | |
| Add OPK to Watchlist: View: Get Complete OPK Trend Analysis ➞ | |
 | NXT Nextracker Inc. |
| Sector: Technology | |
| SubSector: Solar | |
| MarketCap: 5590 Millions | |
| Recent Price: 43.72 Smart Investing & Trading Score: 7 | |
| Day Percent Change: -5.01% Day Change: -2.30 | |
| Week Change: -5.15% Year-to-date Change: -6.5% | |
| NXT Links: Profile News Message Board | |
| Charts:- Daily , Weekly | |
| Add NXT to Watchlist: View: Get Complete NXT Trend Analysis ➞ | |
 | QTRX Quanterix Corporation |
| Sector: Health Care | |
| SubSector: Biotechnology | |
| MarketCap: 448.685 Millions | |
| Recent Price: 16.51 Smart Investing & Trading Score: 57 | |
| Day Percent Change: -5.01% Day Change: -0.87 | |
| Week Change: -3% Year-to-date Change: -39.6% | |
| QTRX Links: Profile News Message Board | |
| Charts:- Daily , Weekly | |
| Add QTRX to Watchlist: View: Get Complete QTRX Trend Analysis ➞ | |
 | TRUE TrueCar, Inc. |
| Sector: Technology | |
| SubSector: Internet Service Providers | |
| MarketCap: 244.18 Millions | |
| Recent Price: 2.73 Smart Investing & Trading Score: 10 | |
| Day Percent Change: -5.03% Day Change: -0.15 | |
| Week Change: -4.04% Year-to-date Change: -21.0% | |
| TRUE Links: Profile News Message Board | |
| Charts:- Daily , Weekly | |
| Add TRUE to Watchlist: View: Get Complete TRUE Trend Analysis ➞ | |
 | CNNE Cannae Holdings, Inc. |
| Sector: Financials | |
| SubSector: Asset Management | |
| MarketCap: 2625.53 Millions | |
| Recent Price: 19.74 Smart Investing & Trading Score: 57 | |
| Day Percent Change: -5.05% Day Change: -1.05 | |
| Week Change: -2.03% Year-to-date Change: 1.2% | |
| CNNE Links: Profile News Message Board | |
| Charts:- Daily , Weekly | |
| Add CNNE to Watchlist: View: Get Complete CNNE Trend Analysis ➞ | |
 | IHRT iHeartMedia, Inc. |
| Sector: Services & Goods | |
| SubSector: Broadcasting - Radio | |
| MarketCap: 694 Millions | |
| Recent Price: 2.16 Smart Investing & Trading Score: 57 | |
| Day Percent Change: -5.05% Day Change: -0.11 | |
| Week Change: -4% Year-to-date Change: -19.1% | |
| IHRT Links: Profile News Message Board | |
| Charts:- Daily , Weekly | |
| Add IHRT to Watchlist: View: Get Complete IHRT Trend Analysis ➞ | |
 | CMTG Claros Mortgage Trust, Inc. |
| Sector: Financials | |
| SubSector: REIT - Mortgage | |
| MarketCap: 1610 Millions | |
| Recent Price: 8.21 Smart Investing & Trading Score: 10 | |
| Day Percent Change: -5.14% Day Change: -0.45 | |
| Week Change: -11.09% Year-to-date Change: -40.8% | |
| CMTG Links: Profile News Message Board | |
| Charts:- Daily , Weekly | |
| Add CMTG to Watchlist: View: Get Complete CMTG Trend Analysis ➞ | |
 | ALLO Allogene Therapeutics, Inc. |
| Sector: Health Care | |
| SubSector: Biotechnology | |
| MarketCap: 2858.65 Millions | |
| Recent Price: 2.76 Smart Investing & Trading Score: 10 | |
| Day Percent Change: -5.15% Day Change: -0.15 | |
| Week Change: -10.1% Year-to-date Change: -14.0% | |
| ALLO Links: Profile News Message Board | |
| Charts:- Daily , Weekly | |
| Add ALLO to Watchlist: View: Get Complete ALLO Trend Analysis ➞ | |
 | PCT PureCycle Technologies, Inc. |
| Sector: Industrials | |
| SubSector: Pollution & Treatment Controls | |
| MarketCap: 1610 Millions | |
| Recent Price: 4.76 Smart Investing & Trading Score: 10 | |
| Day Percent Change: -5.18% Day Change: -0.26 | |
| Week Change: -10.86% Year-to-date Change: 17.4% | |
| PCT Links: Profile News Message Board | |
| Charts:- Daily , Weekly | |
| Add PCT to Watchlist: View: Get Complete PCT Trend Analysis ➞ | |
 | BIRD Allbirds, Inc. |
| Sector: Services & Goods | |
| SubSector: Apparel Retail | |
| MarketCap: 184 Millions | |
| Recent Price: 0.63 Smart Investing & Trading Score: 57 | |
| Day Percent Change: -5.21% Day Change: -0.03 | |
| Week Change: 0.78% Year-to-date Change: -48.7% | |
| BIRD Links: Profile News Message Board | |
| Charts:- Daily , Weekly | |
| Add BIRD to Watchlist: View: Get Complete BIRD Trend Analysis ➞ | |
 | CARA Cara Therapeutics, Inc. |
| Sector: Health Care | |
| SubSector: Biotechnology | |
| MarketCap: 597.985 Millions | |
| Recent Price: 0.75 Smart Investing & Trading Score: 57 | |
| Day Percent Change: -5.33% Day Change: -0.04 | |
| Week Change: -3.62% Year-to-date Change: 0.9% | |
| CARA Links: Profile News Message Board | |
| Charts:- Daily , Weekly | |
| Add CARA to Watchlist: View: Get Complete CARA Trend Analysis ➞ | |
 | CRC California Resources Corporation |
| Sector: Energy | |
| SubSector: Oil & Gas E&P | |
| MarketCap: 18247 Millions | |
| Recent Price: 50.09 Smart Investing & Trading Score: 0 | |
| Day Percent Change: -5.38% Day Change: -2.85 | |
| Week Change: -3.08% Year-to-date Change: -8.4% | |
| CRC Links: Profile News Message Board | |
| Charts:- Daily , Weekly | |
| Add CRC to Watchlist: View: Get Complete CRC Trend Analysis ➞ | |
 | ASRT Assertio Therapeutics, Inc. |
| Sector: Health Care | |
| SubSector: Drugs - Generic | |
| MarketCap: 65.8185 Millions | |
| Recent Price: 1.05 Smart Investing & Trading Score: 83 | |
| Day Percent Change: -5.41% Day Change: -0.06 | |
| Week Change: 1.94% Year-to-date Change: -2.8% | |
| ASRT Links: Profile News Message Board | |
| Charts:- Daily , Weekly | |
| Add ASRT to Watchlist: View: Get Complete ASRT Trend Analysis ➞ | |
 | AMRK A-Mark Precious Metals, Inc. |
| Sector: Financials | |
| SubSector: Investment Brokerage - National | |
| MarketCap: 60.2805 Millions | |
| Recent Price: 38.15 Smart Investing & Trading Score: 51 | |
| Day Percent Change: -5.43% Day Change: -2.19 | |
| Week Change: -7.67% Year-to-date Change: 26.1% | |
| AMRK Links: Profile News Message Board | |
| Charts:- Daily , Weekly | |
| Add AMRK to Watchlist: View: Get Complete AMRK Trend Analysis ➞ | |
 | CDLX Cardlytics, Inc. |
| Sector: Technology | |
| SubSector: Internet Information Providers | |
| MarketCap: 855.48 Millions | |
| Recent Price: 14.59 Smart Investing & Trading Score: 88 | |
| Day Percent Change: -5.44% Day Change: -0.84 | |
| Week Change: -1.95% Year-to-date Change: 58.4% | |
| CDLX Links: Profile News Message Board | |
| Charts:- Daily , Weekly | |
| Add CDLX to Watchlist: View: Get Complete CDLX Trend Analysis ➞ | |
 | ATRC AtriCure, Inc. |
| Sector: Health Care | |
| SubSector: Medical Instruments & Supplies | |
| MarketCap: 1158.7 Millions | |
| Recent Price: 20.67 Smart Investing & Trading Score: 10 | |
| Day Percent Change: -5.49% Day Change: -1.20 | |
| Week Change: -1.05% Year-to-date Change: -42.1% | |
| ATRC Links: Profile News Message Board | |
| Charts:- Daily , Weekly | |
| Add ATRC to Watchlist: View: Get Complete ATRC Trend Analysis ➞ | |
 | XMTR Xometry, Inc. |
| Sector: Industrials | |
| SubSector: Specialty Industrial Machinery | |
| MarketCap: 1050 Millions | |
| Recent Price: 15.49 Smart Investing & Trading Score: 25 | |
| Day Percent Change: -5.49% Day Change: -0.90 | |
| Week Change: -16.27% Year-to-date Change: -57.8% | |
| XMTR Links: Profile News Message Board | |
| Charts:- Daily , Weekly | |
| Add XMTR to Watchlist: View: Get Complete XMTR Trend Analysis ➞ | |
 | CGEM Cullinan Oncology, Inc. |
| Sector: Health Care | |
| SubSector: Biotechnology | |
| MarketCap: 433 Millions | |
| Recent Price: 27.73 Smart Investing & Trading Score: 83 | |
| Day Percent Change: -5.52% Day Change: -1.62 | |
| Week Change: -1.77% Year-to-date Change: 172.0% | |
| CGEM Links: Profile News Message Board | |
| Charts:- Daily , Weekly | |
| Add CGEM to Watchlist: View: Get Complete CGEM Trend Analysis ➞ | |
 | upst Upstart Holdings, Inc. |
| Sector: Financials | |
| SubSector: Credit Services | |
| MarketCap: 2900 Millions | |
| Recent Price: 23.11 Smart Investing & Trading Score: 32 | |
| Day Percent Change: -5.56% Day Change: -1.36 | |
| Week Change: -3.35% Year-to-date Change: -43.0% | |
| upst Links: Profile News Message Board | |
| Charts:- Daily , Weekly | |
| Add upst to Watchlist: View: Get Complete upst Trend Analysis ➞ | |
 | SPWR SunPower Corporation |
| Sector: Technology | |
| SubSector: Semiconductor - Specialized | |
| MarketCap: 1202.6 Millions | |
| Recent Price: 2.20 Smart Investing & Trading Score: 27 | |
| Day Percent Change: -5.58% Day Change: -0.13 | |
| Week Change: -5.98% Year-to-date Change: -54.5% | |
| SPWR Links: Profile News Message Board | |
| Charts:- Daily , Weekly | |
| Add SPWR to Watchlist: View: Get Complete SPWR Trend Analysis ➞ | |
 | SANA Sana Biotechnology, Inc. |
| Sector: Health Care | |
| SubSector: Biotechnology | |
| MarketCap: 1210 Millions | |
| Recent Price: 9.48 Smart Investing & Trading Score: 50 | |
| Day Percent Change: -5.58% Day Change: -0.56 | |
| Week Change: -8.05% Year-to-date Change: 129.3% | |
| SANA Links: Profile News Message Board | |
| Charts:- Daily , Weekly | |
| Add SANA to Watchlist: View: Get Complete SANA Trend Analysis ➞ | |
 | CMPX Compass Therapeutics, Inc. |
| Sector: Health Care | |
| SubSector: Biotechnology | |
| MarketCap: 406 Millions | |
| Recent Price: 1.59 Smart Investing & Trading Score: 50 | |
| Day Percent Change: -5.65% Day Change: -0.09 | |
| Week Change: -10.45% Year-to-date Change: 3.3% | |
| CMPX Links: Profile News Message Board | |
| Charts:- Daily , Weekly | |
| Add CMPX to Watchlist: View: Get Complete CMPX Trend Analysis ➞ | |
 | AMPL Amplitude, Inc. |
| Sector: Technology | |
| SubSector: Software - Application | |
| MarketCap: 1320 Millions | |
| Recent Price: 9.43 Smart Investing & Trading Score: 50 | |
| Day Percent Change: -5.70% Day Change: -0.57 | |
| Week Change: -4.36% Year-to-date Change: -26.1% | |
| AMPL Links: Profile News Message Board | |
| Charts:- Daily , Weekly | |
| Add AMPL to Watchlist: View: Get Complete AMPL Trend Analysis ➞ | |
 | ALXO ALX Oncology Holdings Inc. |
| Sector: Health Care | |
| SubSector: Biotechnology | |
| MarketCap: 41787 Millions | |
| Recent Price: 16.56 Smart Investing & Trading Score: 78 | |
| Day Percent Change: -5.72% Day Change: -1.00 | |
| Week Change: 7.78% Year-to-date Change: 11.3% | |
| ALXO Links: Profile News Message Board | |
| Charts:- Daily , Weekly | |
| Add ALXO to Watchlist: View: Get Complete ALXO Trend Analysis ➞ | |
| Too many stocks? View smallcap stocks filtered by marketcap & sector |
| Marketcap: All SmallCap Stocks (default-no microcap), Large, Mid-Range, Small & MicroCap |
| Sector: Tech, Finance, Energy, Staples, Retail, Industrial, Materials, Utilities & Medical |
|
Best Stocks Today 12Stocks.com |
© 2024 12Stocks.com Terms & Conditions Privacy Contact Us
All Information Provided Only For Education And Not To Be Used For Investing or Trading. See Terms & Conditions


One More Thing ... Get Best Stocks Delivered Daily!
Never Ever Miss A Move With Our Top Ten Stocks Lists
Find Best Stocks In Any Market - Bull or Bear Market
Take A Peek At Our Top Ten Stocks Lists: Daily, Weekly, Year-to-Date & Top Trends
Find Best Stocks In Any Market - Bull or Bear Market
Take A Peek At Our Top Ten Stocks Lists: Daily, Weekly, Year-to-Date & Top Trends
Smallcap Stocks With Best Up Trends [0-bearish to 100-bullish]: Cricut [100], DASAN Zhone[100], Latham Group[100], Hyster-Yale Materials[100], Myriad Genetics[100], Alpha and[100], Vigil Neuroscience[100], Hannon Armstrong[100], Ardmore Shipping[100], Inogen [100], Payoneer Global[100]
Best Smallcap Stocks Year-to-Date:
CareMax [580.41%], Janux [415.82%], Viking [329.77%], Bakkt [295.29%], Longboard [255.4%], Alpine Immune[239.73%], Vera [190.25%], Super Micro[189.4%], Avidity Biosciences[188.27%], Cullinan Oncology[172%], Arcutis Bio[147.06%] Best Smallcap Stocks This Week:
DASAN Zhone[64.32%], Innodata [55.88%], Perficient [52.92%], Cricut [42.32%], Vigil Neuroscience[39.52%], Thoughtworks Holding[36.89%], Latham Group[35.9%], Great Lakes[32.18%], Bakkt [31.96%], Outset Medical[31.95%], P3 Health[27.95%] Best Smallcap Stocks Daily:
Innodata [55.42%], Cricut [47.47%], DASAN Zhone[30.11%], Latham Group[24.08%], Hyster-Yale Materials[23.55%], iRobot [21.40%], Myriad Genetics[21.13%], Ameresco [21.13%], Bakkt [20.92%], Alpha and[20.78%], Vigil Neuroscience[18.97%]