
 Login Sign Up


| |||||
 |  | ||||

| 12Stocks.com Market Intelligence |
Best SmallCap Stocks
|
| In a hurry? Small Cap Stock Lists: Performance Trends Table, Stock Charts
Sort Small Cap stocks: Daily, Weekly, Year-to-Date, Market Cap & Trends. Filter Small Cap stocks list by sector: Show all, Tech, Finance, Energy, Staples, Retail, Industrial, Materials, Utilities and HealthCare Filter Small Cap stocks list by size: All Large Medium Small and MicroCap |
| 12Stocks.com Small Cap Stocks Performances & Trends Daily | |||||||||
|
|  The overall Smart Investing & Trading Score is 49 (0-bearish to 100-bullish) which puts Small Cap index in short term neutral trend. The Smart Investing & Trading Score from previous trading session is 14 and hence an improvement of trend.
| ||||||||
Here are the Smart Investing & Trading Scores of the most requested small cap stocks at 12Stocks.com (click stock name for detailed review):
|


| 12Stocks.com: Investing in Smallcap Index with Stocks | |
|
The following table helps investors and traders sort through current performance and trends (as measured by Smart Investing & Trading Score) of various
stocks in the Smallcap Index. Quick View: Move mouse or cursor over stock symbol (ticker) to view short-term technical chart and over stock name to view long term chart. Click on  to add stock symbol to your watchlist and to add stock symbol to your watchlist and  to view watchlist. Click on any ticker or stock name for detailed market intelligence report for that stock. to view watchlist. Click on any ticker or stock name for detailed market intelligence report for that stock. |
12Stocks.com Performance of Stocks in Smallcap Index
| Ticker | Stock Name | Watchlist | Category | Recent Price | Smart Investing & Trading Score | Change % | YTD Change% |
| KBH | KB Home |   | Industrials | 66.11 | 70 | 0.72 | 5.84% |
| PSTX | Poseida | | Health Care | 2.79 | 64 | 0.72 | -17.09% |
| HLMN | Hillman Solutions | | Industrials | 9.75 | 50 | 0.72 | 5.46% |
| INMD | InMode | | Health Care | 17.36 | 52 | 0.70 | -21.94% |
| LCNB | LCNB | | Financials | 14.47 | 58 | 0.70 | -8.24% |
| TCMD | Tactile Systems | | Health Care | 14.44 | 32 | 0.70 | 0.98% |
| WASH | Washington Trust | | Financials | 26.38 | 93 | 0.69 | -18.53% |
| SIBN | SI-BONE | | Health Care | 14.61 | 28 | 0.69 | -30.40% |
| BKH | Black Hills | | Utilities | 55.98 | 100 | 0.68 | 3.76% |
| ALG | Alamo Group | | Industrials | 195.24 | 10 | 0.68 | -7.11% |
| AVD | American Vanguard | | Materials | 11.77 | 90 | 0.68 | 7.29% |
| EEX | Emerald Holding | | Services & Goods | 5.92 | 58 | 0.68 | -1.00% |
| LUNA | Luna Innovations | | Technology | 2.25 | 35 | 0.67 | -66.17% |
| DYN | Dyne | | Health Care | 26.00 | 27 | 0.66 | 95.49% |
| PRGS | Progress | | Technology | 50.44 | 35 | 0.66 | -7.11% |
| FLWS | 1-800-FLOWERS.COM | | Services & Goods | 9.12 | 37 | 0.66 | -15.40% |
| EBF | Ennis | | Consumer Staples | 20.27 | 87 | 0.65 | -7.49% |
| IMRX | Immuneering | | Health Care | 1.55 | 42 | 0.65 | -79.58% |
| CMRE | Costamare | | Transports | 12.36 | 100 | 0.65 | 18.73% |
| NDLS | Noodles & | | Services & Goods | 1.56 | 67 | 0.65 | -50.48% |
| BMEA | Biomea Fusion | | Health Care | 11.64 | 49 | 0.65 | -20.53% |
| NABL | N-able | | Technology | 12.39 | 34 | 0.65 | -6.88% |
| RYI | Ryerson Holding | | Industrials | 9.45 | 0 | 0.64 | -32.84% |
| MCBC | Macatawa Bank | | Financials | 14.30 | 76 | 0.63 | 26.77% |
| HL | Hecla Mining | | Materials | 4.77 | 46 | 0.63 | -0.83% |


| Too many stocks? View smallcap stocks filtered by marketcap & sector |
| Marketcap: All SmallCap Stocks (default-no microcap), Large, Mid-Range, Small |
| Smallcap Sector: Tech, Finance, Energy, Staples, Retail, Industrial, Materials, & Medical |
|
Get the most comprehensive stock market coverage daily at 12Stocks.com ➞ Best Stocks Today ➞ Best Stocks Weekly ➞ Best Stocks Year-to-Date ➞ Best Stocks Trends ➞  Best Stocks Today 12Stocks.com Best Nasdaq Stocks ➞ Best S&P 500 Stocks ➞ Best Tech Stocks ➞ Best Biotech Stocks ➞ |
| Detailed Overview of SmallCap Stocks |
| SmallCap Technical Overview, Leaders & Laggards, Top SmallCap ETF Funds & Detailed SmallCap Stocks List, Charts, Trends & More |
| Smallcap: Technical Analysis, Trends & YTD Performance | |
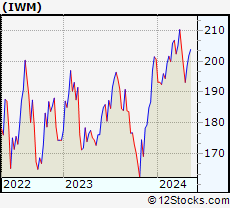
| SmallCap segment as represented by
IWM, an exchange-traded fund [ETF], holds basket of thousands of smallcap stocks from across all major sectors of the US stock market. The smallcap index (contains stocks like Riverbed & Sotheby's) is down by -0.39% and is currently underperforming the overall market by -6.01% year-to-date. Below is a quick view of technical charts and trends: | |
 IWM Weekly Chart |
|
| Long Term Trend: Not Good | |
| Medium Term Trend: Good | |
 IWM Daily Chart |
|
| Short Term Trend: Deteriorating | |
| Overall Trend Score: 49 | |
| YTD Performance: -0.39% | |
| **Trend Scores & Views Are Only For Educational Purposes And Not For Investing | |
| 12Stocks.com: Top Performing Small Cap Index Stocks | ||||||||||||||||||||||||||||||||||||||||||||||||
 The top performing Small Cap Index stocks year to date are
Now, more recently, over last week, the top performing Small Cap Index stocks on the move are


|
||||||||||||||||||||||||||||||||||||||||||||||||
| 12Stocks.com: Investing in Smallcap Index using Exchange Traded Funds | |
|
The following table shows list of key exchange traded funds (ETF) that
help investors track Smallcap index. The following list also includes leveraged ETF funds that track twice or thrice the daily returns of Smallcap indices. Short or inverse ETF funds move in the opposite direction to the index they track and are useful during market pullbacks or during bear markets. Quick View: Move mouse or cursor over ETF symbol (ticker) to view short-term technical chart and over ETF name to view long term chart. Click on ticker or stock name for detailed view. Click on to add stock symbol to your watchlist and to view watchlist. |
12Stocks.com List of ETFs that track Smallcap Index
| Ticker | ETF Name | Watchlist | Recent Price | Smart Investing & Trading Score | Change % | Week % | Year-to-date % |
| IWM | iShares Russell 2000 | | 199.92 | 49 | 1.84 | 0.77 | -0.39% |
| IJR | iShares Core S&P Small-Cap | | 106.33 | 50 | 1.52 | 0.64 | -1.77% |
| VTWO | Vanguard Russell 2000 ETF | | 80.85 | 42 | 1.88 | 0.79 | -0.31% |
| IWN | iShares Russell 2000 Value | | 152.88 | 75 | 2.04 | 1.15 | -1.58% |
| IWO | iShares Russell 2000 Growth | | 254.34 | 32 | 1.91 | 0.49 | 0.84% |
| IJS | iShares S&P Small-Cap 600 Value | | 98.02 | 43 | 1.68 | 0.85 | -4.9% |
| IJT | iShares S&P Small-Cap 600 Growth | | 126.72 | 63 | 1.42 | 0.5 | 1.26% |
| XSLV | PowerShares S&P SmallCap Low Volatil ETF | | 43.14 | 73 | 0.72 | 0.98 | -2.29% |
| SDD | ProShares UltraShort SmallCap600 | | 19.31 | 56 | -2.02 | -0.21 | 4.79% |
| SMLV | SPDR SSGA US Small Cap Low Volatil ETF | | 108.83 | 87 | 1.30 | 1.22 | -3.27% |
| SAA | ProShares Ultra SmallCap600 | | 22.93 | 42 | 1.56 | -0.46 | -8.08% |
| SBB | ProShares Short SmallCap600 | | 16.37 | 49 | -1.14 | -0.09 | 2.76% |
| 12Stocks.com: Charts, Trends, Fundamental Data and Performances of SmallCap Stocks | |
|
We now take in-depth look at all SmallCap stocks including charts, multi-period performances and overall trends (as measured by Smart Investing & Trading Score). One can sort SmallCap stocks (click link to choose) by Daily, Weekly and by Year-to-Date performances. Also, one can sort by size of the company or by market capitalization. |
| Select Your Default Chart Type: | |||||
| |||||
| Click on stock symbol or name for detailed view. Click on to add stock symbol to your watchlist and to view watchlist. Quick View: Move mouse or cursor over "Daily" to quickly view daily technical stock chart and over "Weekly" to view weekly technical stock chart. | |||||

 | KBH KB Home |
| Sector: Industrials | |
| SubSector: Residential Construction | |
| MarketCap: 1249.66 Millions | |
| Recent Price: 66.11 Smart Investing & Trading Score: 70 | |
| Day Percent Change: 0.72% Day Change: 0.47 | |
| Week Change: 0.78% Year-to-date Change: 5.8% | |
| KBH Links: Profile News Message Board | |
| Charts:- Daily , Weekly | |
| Add KBH to Watchlist: View: Get Complete KBH Trend Analysis ➞ | |
 | PSTX Poseida Therapeutics, Inc. |
| Sector: Health Care | |
| SubSector: Biotechnology | |
| MarketCap: 64487 Millions | |
| Recent Price: 2.79 Smart Investing & Trading Score: 64 | |
| Day Percent Change: 0.72% Day Change: 0.02 | |
| Week Change: 30.99% Year-to-date Change: -17.1% | |
| PSTX Links: Profile News Message Board | |
| Charts:- Daily , Weekly | |
| Add PSTX to Watchlist: View: Get Complete PSTX Trend Analysis ➞ | |
 | HLMN Hillman Solutions Corp. |
| Sector: Industrials | |
| SubSector: Tools & Accessories | |
| MarketCap: 1720 Millions | |
| Recent Price: 9.75 Smart Investing & Trading Score: 50 | |
| Day Percent Change: 0.72% Day Change: 0.07 | |
| Week Change: 0% Year-to-date Change: 5.5% | |
| HLMN Links: Profile News Message Board | |
| Charts:- Daily , Weekly | |
| Add HLMN to Watchlist: View: Get Complete HLMN Trend Analysis ➞ | |
 | INMD InMode Ltd. |
| Sector: Health Care | |
| SubSector: Medical Appliances & Equipment | |
| MarketCap: 689.08 Millions | |
| Recent Price: 17.36 Smart Investing & Trading Score: 52 | |
| Day Percent Change: 0.70% Day Change: 0.12 | |
| Week Change: 1.28% Year-to-date Change: -21.9% | |
| INMD Links: Profile News Message Board | |
| Charts:- Daily , Weekly | |
| Add INMD to Watchlist: View: Get Complete INMD Trend Analysis ➞ | |
 | LCNB LCNB Corp. |
| Sector: Financials | |
| SubSector: Regional - Mid-Atlantic Banks | |
| MarketCap: 176.759 Millions | |
| Recent Price: 14.47 Smart Investing & Trading Score: 58 | |
| Day Percent Change: 0.70% Day Change: 0.10 | |
| Week Change: -5.05% Year-to-date Change: -8.2% | |
| LCNB Links: Profile News Message Board | |
| Charts:- Daily , Weekly | |
| Add LCNB to Watchlist: View: Get Complete LCNB Trend Analysis ➞ | |
 | TCMD Tactile Systems Technology, Inc. |
| Sector: Health Care | |
| SubSector: Medical Instruments & Supplies | |
| MarketCap: 655.96 Millions | |
| Recent Price: 14.44 Smart Investing & Trading Score: 32 | |
| Day Percent Change: 0.70% Day Change: 0.10 | |
| Week Change: 0.98% Year-to-date Change: 1.0% | |
| TCMD Links: Profile News Message Board | |
| Charts:- Daily , Weekly | |
| Add TCMD to Watchlist: View: Get Complete TCMD Trend Analysis ➞ | |
 | WASH Washington Trust Bancorp, Inc. |
| Sector: Financials | |
| SubSector: Regional - Northeast Banks | |
| MarketCap: 590.099 Millions | |
| Recent Price: 26.38 Smart Investing & Trading Score: 93 | |
| Day Percent Change: 0.69% Day Change: 0.18 | |
| Week Change: 0.92% Year-to-date Change: -18.5% | |
| WASH Links: Profile News Message Board | |
| Charts:- Daily , Weekly | |
| Add WASH to Watchlist: View: Get Complete WASH Trend Analysis ➞ | |
 | SIBN SI-BONE, Inc. |
| Sector: Health Care | |
| SubSector: Medical Appliances & Equipment | |
| MarketCap: 234.78 Millions | |
| Recent Price: 14.61 Smart Investing & Trading Score: 28 | |
| Day Percent Change: 0.69% Day Change: 0.10 | |
| Week Change: 0.27% Year-to-date Change: -30.4% | |
| SIBN Links: Profile News Message Board | |
| Charts:- Daily , Weekly | |
| Add SIBN to Watchlist: View: Get Complete SIBN Trend Analysis ➞ | |
 | BKH Black Hills Corporation |
| Sector: Utilities | |
| SubSector: Electric Utilities | |
| MarketCap: 3666.94 Millions | |
| Recent Price: 55.98 Smart Investing & Trading Score: 100 | |
| Day Percent Change: 0.68% Day Change: 0.38 | |
| Week Change: 3.94% Year-to-date Change: 3.8% | |
| BKH Links: Profile News Message Board | |
| Charts:- Daily , Weekly | |
| Add BKH to Watchlist: View: Get Complete BKH Trend Analysis ➞ | |
 | ALG Alamo Group Inc. |
| Sector: Industrials | |
| SubSector: Farm & Construction Machinery | |
| MarketCap: 964.107 Millions | |
| Recent Price: 195.24 Smart Investing & Trading Score: 10 | |
| Day Percent Change: 0.68% Day Change: 1.31 | |
| Week Change: -1.65% Year-to-date Change: -7.1% | |
| ALG Links: Profile News Message Board | |
| Charts:- Daily , Weekly | |
| Add ALG to Watchlist: View: Get Complete ALG Trend Analysis ➞ | |
 | AVD American Vanguard Corporation |
| Sector: Materials | |
| SubSector: Agricultural Chemicals | |
| MarketCap: 419.329 Millions | |
| Recent Price: 11.77 Smart Investing & Trading Score: 90 | |
| Day Percent Change: 0.68% Day Change: 0.08 | |
| Week Change: 2.62% Year-to-date Change: 7.3% | |
| AVD Links: Profile News Message Board | |
| Charts:- Daily , Weekly | |
| Add AVD to Watchlist: View: Get Complete AVD Trend Analysis ➞ | |
 | EEX Emerald Holding, Inc. |
| Sector: Services & Goods | |
| SubSector: Business Services | |
| MarketCap: 252.682 Millions | |
| Recent Price: 5.92 Smart Investing & Trading Score: 58 | |
| Day Percent Change: 0.68% Day Change: 0.04 | |
| Week Change: 1.02% Year-to-date Change: -1.0% | |
| EEX Links: Profile News Message Board | |
| Charts:- Daily , Weekly | |
| Add EEX to Watchlist: View: Get Complete EEX Trend Analysis ➞ | |
 | LUNA Luna Innovations Incorporated |
| Sector: Technology | |
| SubSector: Scientific & Technical Instruments | |
| MarketCap: 166.353 Millions | |
| Recent Price: 2.25 Smart Investing & Trading Score: 35 | |
| Day Percent Change: 0.67% Day Change: 0.02 | |
| Week Change: 13.07% Year-to-date Change: -66.2% | |
| LUNA Links: Profile News Message Board | |
| Charts:- Daily , Weekly | |
| Add LUNA to Watchlist: View: Get Complete LUNA Trend Analysis ➞ | |
 | DYN Dyne Therapeutics, Inc. |
| Sector: Health Care | |
| SubSector: Biotechnology | |
| MarketCap: 88487 Millions | |
| Recent Price: 26.00 Smart Investing & Trading Score: 27 | |
| Day Percent Change: 0.66% Day Change: 0.17 | |
| Week Change: 5.14% Year-to-date Change: 95.5% | |
| DYN Links: Profile News Message Board | |
| Charts:- Daily , Weekly | |
| Add DYN to Watchlist: View: Get Complete DYN Trend Analysis ➞ | |
 | PRGS Progress Software Corporation |
| Sector: Technology | |
| SubSector: Application Software | |
| MarketCap: 1407.22 Millions | |
| Recent Price: 50.44 Smart Investing & Trading Score: 35 | |
| Day Percent Change: 0.66% Day Change: 0.33 | |
| Week Change: 0.2% Year-to-date Change: -7.1% | |
| PRGS Links: Profile News Message Board | |
| Charts:- Daily , Weekly | |
| Add PRGS to Watchlist: View: Get Complete PRGS Trend Analysis ➞ | |
 | FLWS 1-800-FLOWERS.COM, Inc. |
| Sector: Services & Goods | |
| SubSector: Specialty Retail, Other | |
| MarketCap: 940 Millions | |
| Recent Price: 9.12 Smart Investing & Trading Score: 37 | |
| Day Percent Change: 0.66% Day Change: 0.06 | |
| Week Change: -1.72% Year-to-date Change: -15.4% | |
| FLWS Links: Profile News Message Board | |
| Charts:- Daily , Weekly | |
| Add FLWS to Watchlist: View: Get Complete FLWS Trend Analysis ➞ | |
 | EBF Ennis, Inc. |
| Sector: Consumer Staples | |
| SubSector: Office Supplies | |
| MarketCap: 464.5 Millions | |
| Recent Price: 20.27 Smart Investing & Trading Score: 87 | |
| Day Percent Change: 0.65% Day Change: 0.13 | |
| Week Change: 2.89% Year-to-date Change: -7.5% | |
| EBF Links: Profile News Message Board | |
| Charts:- Daily , Weekly | |
| Add EBF to Watchlist: View: Get Complete EBF Trend Analysis ➞ | |
 | IMRX Immuneering Corporation |
| Sector: Health Care | |
| SubSector: Biotechnology | |
| MarketCap: 303 Millions | |
| Recent Price: 1.55 Smart Investing & Trading Score: 42 | |
| Day Percent Change: 0.65% Day Change: 0.01 | |
| Week Change: 5.44% Year-to-date Change: -79.6% | |
| IMRX Links: Profile News Message Board | |
| Charts:- Daily , Weekly | |
| Add IMRX to Watchlist: View: Get Complete IMRX Trend Analysis ➞ | |
 | CMRE Costamare Inc. |
| Sector: Transports | |
| SubSector: Shipping | |
| MarketCap: 492.214 Millions | |
| Recent Price: 12.36 Smart Investing & Trading Score: 100 | |
| Day Percent Change: 0.65% Day Change: 0.08 | |
| Week Change: 4.92% Year-to-date Change: 18.7% | |
| CMRE Links: Profile News Message Board | |
| Charts:- Daily , Weekly | |
| Add CMRE to Watchlist: View: Get Complete CMRE Trend Analysis ➞ | |
 | NDLS Noodles & Company |
| Sector: Services & Goods | |
| SubSector: Restaurants | |
| MarketCap: 188.77 Millions | |
| Recent Price: 1.56 Smart Investing & Trading Score: 67 | |
| Day Percent Change: 0.65% Day Change: 0.01 | |
| Week Change: 11.43% Year-to-date Change: -50.5% | |
| NDLS Links: Profile News Message Board | |
| Charts:- Daily , Weekly | |
| Add NDLS to Watchlist: View: Get Complete NDLS Trend Analysis ➞ | |
 | BMEA Biomea Fusion, Inc. |
| Sector: Health Care | |
| SubSector: Biotechnology | |
| MarketCap: 818 Millions | |
| Recent Price: 11.64 Smart Investing & Trading Score: 49 | |
| Day Percent Change: 0.65% Day Change: 0.07 | |
| Week Change: 8.03% Year-to-date Change: -20.5% | |
| BMEA Links: Profile News Message Board | |
| Charts:- Daily , Weekly | |
| Add BMEA to Watchlist: View: Get Complete BMEA Trend Analysis ➞ | |
 | NABL N-able, Inc. |
| Sector: Technology | |
| SubSector: Information Technology Services | |
| MarketCap: 2590 Millions | |
| Recent Price: 12.39 Smart Investing & Trading Score: 34 | |
| Day Percent Change: 0.65% Day Change: 0.08 | |
| Week Change: -0.08% Year-to-date Change: -6.9% | |
| NABL Links: Profile News Message Board | |
| Charts:- Daily , Weekly | |
| Add NABL to Watchlist: View: Get Complete NABL Trend Analysis ➞ | |
 | RYI Ryerson Holding Corporation |
| Sector: Industrials | |
| SubSector: Metal Fabrication | |
| MarketCap: 202.55 Millions | |
| Recent Price: 9.45 Smart Investing & Trading Score: 0 | |
| Day Percent Change: 0.64% Day Change: 0.06 | |
| Week Change: -24.04% Year-to-date Change: -32.8% | |
| RYI Links: Profile News Message Board | |
| Charts:- Daily , Weekly | |
| Add RYI to Watchlist: View: Get Complete RYI Trend Analysis ➞ | |
 | MCBC Macatawa Bank Corporation |
| Sector: Financials | |
| SubSector: Regional - Midwest Banks | |
| MarketCap: 264.37 Millions | |
| Recent Price: 14.30 Smart Investing & Trading Score: 76 | |
| Day Percent Change: 0.63% Day Change: 0.09 | |
| Week Change: 0.42% Year-to-date Change: 26.8% | |
| MCBC Links: Profile News Message Board | |
| Charts:- Daily , Weekly | |
| Add MCBC to Watchlist: View: Get Complete MCBC Trend Analysis ➞ | |
 | HL Hecla Mining Company |
| Sector: Materials | |
| SubSector: Gold | |
| MarketCap: 1048.49 Millions | |
| Recent Price: 4.77 Smart Investing & Trading Score: 46 | |
| Day Percent Change: 0.63% Day Change: 0.03 | |
| Week Change: -6.65% Year-to-date Change: -0.8% | |
| HL Links: Profile News Message Board | |
| Charts:- Daily , Weekly | |
| Add HL to Watchlist: View: Get Complete HL Trend Analysis ➞ | |
| Too many stocks? View smallcap stocks filtered by marketcap & sector |
| Marketcap: All SmallCap Stocks (default-no microcap), Large, Mid-Range, Small & MicroCap |
| Sector: Tech, Finance, Energy, Staples, Retail, Industrial, Materials, Utilities & Medical |
|
Best Stocks Today 12Stocks.com |
© 2024 12Stocks.com Terms & Conditions Privacy Contact Us
All Information Provided Only For Education And Not To Be Used For Investing or Trading. See Terms & Conditions


One More Thing ... Get Best Stocks Delivered Daily!
Never Ever Miss A Move With Our Top Ten Stocks Lists
Find Best Stocks In Any Market - Bull or Bear Market
Take A Peek At Our Top Ten Stocks Lists: Daily, Weekly, Year-to-Date & Top Trends
Find Best Stocks In Any Market - Bull or Bear Market
Take A Peek At Our Top Ten Stocks Lists: Daily, Weekly, Year-to-Date & Top Trends
Smallcap Stocks With Best Up Trends [0-bearish to 100-bullish]: Emergent BioSolutions[100], Aspen Aerogels[100], Carvana Co[100], Perdoceo Education[100], Gannett Co[100], Pitney Bowes[100], Benchmark Electronics[100], Origin Materials[100], FormFactor [100], Lantheus [100], Q2 [100]
Best Smallcap Stocks Year-to-Date:
Janux [440.16%], Viking [307.09%], Longboard [273.98%], Alpine Immune[239.29%], Bakkt [187.89%], Avidity Biosciences[182.96%], Vera [170.74%], Cullinan Oncology[169.74%], Super Micro[168.25%], Arcutis Bio[166.25%], Y-mAbs [152.93%] Best Smallcap Stocks This Week:
Deciphera [73.24%], Emergent BioSolutions[71.88%], Eyenovia [49.22%], Aspen Aerogels[48.14%], P3 Health[38.51%], Carvana Co[38.18%], Cue Biopharma[37.73%], Origin Materials[36.24%], TransMedics Group[35.14%], Seres [34.55%], Enovix [32.07%] Best Smallcap Stocks Daily:
Emergent BioSolutions[70.98%], Aspen Aerogels[56.70%], Carvana Co[33.77%], Perdoceo Education[31.46%], Enovix [31.06%], Office Properties[28.00%], Gannett Co[26.97%], Sunnova Energy[25.21%], Pitney Bowes[24.70%], Pulmonx [21.50%], CommScope Holding[20.95%]