
 Login Sign Up


| |||||
 |  | ||||

| 12Stocks.com Market Intelligence |
Best SmallCap Stocks
|
| In a hurry? Small Cap Stock Lists: Performance Trends Table, Stock Charts
Sort Small Cap stocks: Daily, Weekly, Year-to-Date, Market Cap & Trends. Filter Small Cap stocks list by sector: Show all, Tech, Finance, Energy, Staples, Retail, Industrial, Materials, Utilities and HealthCare Filter Small Cap stocks list by size: All Large Medium Small and MicroCap |
| 12Stocks.com Small Cap Stocks Performances & Trends Daily | |||||||||
|
|  The overall Smart Investing & Trading Score is 49 (0-bearish to 100-bullish) which puts Small Cap index in short term neutral trend. The Smart Investing & Trading Score from previous trading session is 14 and hence an improvement of trend.
| ||||||||
Here are the Smart Investing & Trading Scores of the most requested small cap stocks at 12Stocks.com (click stock name for detailed review):
|


| 12Stocks.com: Investing in Smallcap Index with Stocks | |
|
The following table helps investors and traders sort through current performance and trends (as measured by Smart Investing & Trading Score) of various
stocks in the Smallcap Index. Quick View: Move mouse or cursor over stock symbol (ticker) to view short-term technical chart and over stock name to view long term chart. Click on  to add stock symbol to your watchlist and to add stock symbol to your watchlist and  to view watchlist. Click on any ticker or stock name for detailed market intelligence report for that stock. to view watchlist. Click on any ticker or stock name for detailed market intelligence report for that stock. |
12Stocks.com Performance of Stocks in Smallcap Index
| Ticker | Stock Name | Watchlist | Category | Recent Price | Smart Investing & Trading Score | Change % | YTD Change% |
| GRNT | Granite Ridge |   | Energy | 6.34 | 36 | 0.87 | 5.22% |
| PNM | PNM Resources | | Utilities | 37.71 | 100 | 0.86 | -9.35% |
| PTEN | Patterson-UTI Energy | | Energy | 10.59 | 10 | 0.86 | -1.94% |
| RGR | Sturm Ruger | | Industrials | 46.85 | 95 | 0.86 | 3.08% |
| MNRO | Monro | | Consumer Staples | 26.94 | 20 | 0.86 | -8.18% |
| NBTB | NBT Bancorp | | Financials | 36.52 | 100 | 0.86 | -12.86% |
| NVAX | Novavax | | Health Care | 4.71 | 74 | 0.86 | -1.88% |
| SLP | Simulations Plus | | Technology | 46.72 | 93 | 0.86 | 4.40% |
| PL | Planet Labs | | Industrials | 1.77 | 37 | 0.85 | -28.43% |
| ABR | Arbor Realty | | Financials | 13.08 | 67 | 0.85 | -13.83% |
| VRNT | Verint Systems | | Technology | 30.78 | 50 | 0.85 | 13.87% |
| CLW | Clearwater Paper | | Consumer Staples | 44.86 | 100 | 0.85 | 24.20% |
| ACNB | ACNB | | Financials | 33.41 | 57 | 0.85 | -25.36% |
| BOH | Bank of Hawaii | | Financials | 58.49 | 57 | 0.84 | -19.28% |
| OFG | OFG Bancorp | | Financials | 37.01 | 90 | 0.84 | -1.25% |
| LZB | La-Z-Boy | | Consumer Staples | 32.98 | 10 | 0.83 | -10.67% |
| SVC | Service Properties | | Financials | 6.05 | 10 | 0.83 | -29.16% |
| EE | Excelerate Energy | | Utilities | 16.96 | 75 | 0.83 | 9.00% |
| ALE | ALLETE | | Utilities | 60.84 | 100 | 0.83 | -0.52% |
| HY | Hyster-Yale Materials | | Consumer Staples | 58.25 | 10 | 0.83 | -6.34% |
| IBEX | IBEX | | Technology | 13.39 | 45 | 0.83 | -29.45% |
| HSII | Heidrick & Struggles | | Services & Goods | 29.63 | 10 | 0.82 | 0.34% |
| FCF | First Commonwealth | | Financials | 13.59 | 95 | 0.82 | -11.98% |
| UE | Urban Edge | | Financials | 17.14 | 90 | 0.82 | -6.34% |
| AESI | Atlas Energy | | Energy | 22.15 | 36 | 0.82 | 29.38% |


| Too many stocks? View smallcap stocks filtered by marketcap & sector |
| Marketcap: All SmallCap Stocks (default-no microcap), Large, Mid-Range, Small |
| Smallcap Sector: Tech, Finance, Energy, Staples, Retail, Industrial, Materials, & Medical |
|
Get the most comprehensive stock market coverage daily at 12Stocks.com ➞ Best Stocks Today ➞ Best Stocks Weekly ➞ Best Stocks Year-to-Date ➞ Best Stocks Trends ➞  Best Stocks Today 12Stocks.com Best Nasdaq Stocks ➞ Best S&P 500 Stocks ➞ Best Tech Stocks ➞ Best Biotech Stocks ➞ |
| Detailed Overview of SmallCap Stocks |
| SmallCap Technical Overview, Leaders & Laggards, Top SmallCap ETF Funds & Detailed SmallCap Stocks List, Charts, Trends & More |
| Smallcap: Technical Analysis, Trends & YTD Performance | |
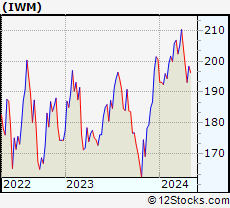
| SmallCap segment as represented by
IWM, an exchange-traded fund [ETF], holds basket of thousands of smallcap stocks from across all major sectors of the US stock market. The smallcap index (contains stocks like Riverbed & Sotheby's) is down by -0.39% and is currently underperforming the overall market by -6.01% year-to-date. Below is a quick view of technical charts and trends: | |
 IWM Weekly Chart |
|
| Long Term Trend: Not Good | |
| Medium Term Trend: Good | |
 IWM Daily Chart |
|
| Short Term Trend: Deteriorating | |
| Overall Trend Score: 49 | |
| YTD Performance: -0.39% | |
| **Trend Scores & Views Are Only For Educational Purposes And Not For Investing | |
| 12Stocks.com: Top Performing Small Cap Index Stocks | ||||||||||||||||||||||||||||||||||||||||||||||||
 The top performing Small Cap Index stocks year to date are
Now, more recently, over last week, the top performing Small Cap Index stocks on the move are


|
||||||||||||||||||||||||||||||||||||||||||||||||
| 12Stocks.com: Investing in Smallcap Index using Exchange Traded Funds | |
|
The following table shows list of key exchange traded funds (ETF) that
help investors track Smallcap index. The following list also includes leveraged ETF funds that track twice or thrice the daily returns of Smallcap indices. Short or inverse ETF funds move in the opposite direction to the index they track and are useful during market pullbacks or during bear markets. Quick View: Move mouse or cursor over ETF symbol (ticker) to view short-term technical chart and over ETF name to view long term chart. Click on ticker or stock name for detailed view. Click on to add stock symbol to your watchlist and to view watchlist. |
12Stocks.com List of ETFs that track Smallcap Index
| Ticker | ETF Name | Watchlist | Recent Price | Smart Investing & Trading Score | Change % | Week % | Year-to-date % |
| IWM | iShares Russell 2000 | | 199.92 | 49 | 1.84 | 0.77 | -0.39% |
| IJR | iShares Core S&P Small-Cap | | 106.33 | 50 | 1.52 | 0.64 | -1.77% |
| VTWO | Vanguard Russell 2000 ETF | | 80.85 | 42 | 1.88 | 0.79 | -0.31% |
| IWN | iShares Russell 2000 Value | | 152.88 | 75 | 2.04 | 1.15 | -1.58% |
| IWO | iShares Russell 2000 Growth | | 254.34 | 32 | 1.91 | 0.49 | 0.84% |
| IJS | iShares S&P Small-Cap 600 Value | | 98.02 | 43 | 1.68 | 0.85 | -4.9% |
| IJT | iShares S&P Small-Cap 600 Growth | | 126.72 | 63 | 1.42 | 0.5 | 1.26% |
| XSLV | PowerShares S&P SmallCap Low Volatil ETF | | 43.14 | 73 | 0.72 | 0.98 | -2.29% |
| SDD | ProShares UltraShort SmallCap600 | | 19.31 | 56 | -2.02 | -0.21 | 4.79% |
| SMLV | SPDR SSGA US Small Cap Low Volatil ETF | | 108.83 | 87 | 1.30 | 1.22 | -3.27% |
| SAA | ProShares Ultra SmallCap600 | | 22.93 | 42 | 1.56 | -0.46 | -8.08% |
| SBB | ProShares Short SmallCap600 | | 16.37 | 49 | -1.14 | -0.09 | 2.76% |
| 12Stocks.com: Charts, Trends, Fundamental Data and Performances of SmallCap Stocks | |
|
We now take in-depth look at all SmallCap stocks including charts, multi-period performances and overall trends (as measured by Smart Investing & Trading Score). One can sort SmallCap stocks (click link to choose) by Daily, Weekly and by Year-to-Date performances. Also, one can sort by size of the company or by market capitalization. |
| Select Your Default Chart Type: | |||||
| |||||
| Click on stock symbol or name for detailed view. Click on to add stock symbol to your watchlist and to view watchlist. Quick View: Move mouse or cursor over "Daily" to quickly view daily technical stock chart and over "Weekly" to view weekly technical stock chart. | |||||

 | GRNT Granite Ridge Resources, Inc. |
| Sector: Energy | |
| SubSector: Oil & Gas E&P | |
| MarketCap: 890 Millions | |
| Recent Price: 6.34 Smart Investing & Trading Score: 36 | |
| Day Percent Change: 0.87% Day Change: 0.05 | |
| Week Change: -4.3% Year-to-date Change: 5.2% | |
| GRNT Links: Profile News Message Board | |
| Charts:- Daily , Weekly | |
| Add GRNT to Watchlist: View: Get Complete GRNT Trend Analysis ➞ | |
 | PNM PNM Resources, Inc. |
| Sector: Utilities | |
| SubSector: Diversified Utilities | |
| MarketCap: 2755.3 Millions | |
| Recent Price: 37.71 Smart Investing & Trading Score: 100 | |
| Day Percent Change: 0.86% Day Change: 0.32 | |
| Week Change: 3.83% Year-to-date Change: -9.4% | |
| PNM Links: Profile News Message Board | |
| Charts:- Daily , Weekly | |
| Add PNM to Watchlist: View: Get Complete PNM Trend Analysis ➞ | |
 | PTEN Patterson-UTI Energy, Inc. |
| Sector: Energy | |
| SubSector: Oil & Gas Drilling & Exploration | |
| MarketCap: 422.639 Millions | |
| Recent Price: 10.59 Smart Investing & Trading Score: 10 | |
| Day Percent Change: 0.86% Day Change: 0.09 | |
| Week Change: -5.87% Year-to-date Change: -1.9% | |
| PTEN Links: Profile News Message Board | |
| Charts:- Daily , Weekly | |
| Add PTEN to Watchlist: View: Get Complete PTEN Trend Analysis ➞ | |
 | RGR Sturm, Ruger & Company, Inc. |
| Sector: Industrials | |
| SubSector: Aerospace/Defense Products & Services | |
| MarketCap: 752 Millions | |
| Recent Price: 46.85 Smart Investing & Trading Score: 95 | |
| Day Percent Change: 0.86% Day Change: 0.40 | |
| Week Change: 0.82% Year-to-date Change: 3.1% | |
| RGR Links: Profile News Message Board | |
| Charts:- Daily , Weekly | |
| Add RGR to Watchlist: View: Get Complete RGR Trend Analysis ➞ | |
 | MNRO Monro, Inc. |
| Sector: Consumer Staples | |
| SubSector: Auto Parts | |
| MarketCap: 1514.89 Millions | |
| Recent Price: 26.94 Smart Investing & Trading Score: 20 | |
| Day Percent Change: 0.86% Day Change: 0.23 | |
| Week Change: -3.06% Year-to-date Change: -8.2% | |
| MNRO Links: Profile News Message Board | |
| Charts:- Daily , Weekly | |
| Add MNRO to Watchlist: View: Get Complete MNRO Trend Analysis ➞ | |
 | NBTB NBT Bancorp Inc. |
| Sector: Financials | |
| SubSector: Regional - Northeast Banks | |
| MarketCap: 1451.89 Millions | |
| Recent Price: 36.52 Smart Investing & Trading Score: 100 | |
| Day Percent Change: 0.86% Day Change: 0.31 | |
| Week Change: 1.53% Year-to-date Change: -12.9% | |
| NBTB Links: Profile News Message Board | |
| Charts:- Daily , Weekly | |
| Add NBTB to Watchlist: View: Get Complete NBTB Trend Analysis ➞ | |
 | NVAX Novavax, Inc. |
| Sector: Health Care | |
| SubSector: Biotechnology | |
| MarketCap: 376.185 Millions | |
| Recent Price: 4.71 Smart Investing & Trading Score: 74 | |
| Day Percent Change: 0.86% Day Change: 0.04 | |
| Week Change: 15.16% Year-to-date Change: -1.9% | |
| NVAX Links: Profile News Message Board | |
| Charts:- Daily , Weekly | |
| Add NVAX to Watchlist: View: Get Complete NVAX Trend Analysis ➞ | |
 | SLP Simulations Plus, Inc. |
| Sector: Technology | |
| SubSector: Business Software & Services | |
| MarketCap: 564.258 Millions | |
| Recent Price: 46.72 Smart Investing & Trading Score: 93 | |
| Day Percent Change: 0.86% Day Change: 0.40 | |
| Week Change: 4.54% Year-to-date Change: 4.4% | |
| SLP Links: Profile News Message Board | |
| Charts:- Daily , Weekly | |
| Add SLP to Watchlist: View: Get Complete SLP Trend Analysis ➞ | |
 | PL Planet Labs PBC |
| Sector: Industrials | |
| SubSector: Aerospace & Defense | |
| MarketCap: 874 Millions | |
| Recent Price: 1.77 Smart Investing & Trading Score: 37 | |
| Day Percent Change: 0.85% Day Change: 0.01 | |
| Week Change: 0.28% Year-to-date Change: -28.4% | |
| PL Links: Profile News Message Board | |
| Charts:- Daily , Weekly | |
| Add PL to Watchlist: View: Get Complete PL Trend Analysis ➞ | |
 | ABR Arbor Realty Trust, Inc. |
| Sector: Financials | |
| SubSector: Mortgage Investment | |
| MarketCap: 648.939 Millions | |
| Recent Price: 13.08 Smart Investing & Trading Score: 67 | |
| Day Percent Change: 0.85% Day Change: 0.11 | |
| Week Change: 2.03% Year-to-date Change: -13.8% | |
| ABR Links: Profile News Message Board | |
| Charts:- Daily , Weekly | |
| Add ABR to Watchlist: View: Get Complete ABR Trend Analysis ➞ | |
 | VRNT Verint Systems Inc. |
| Sector: Technology | |
| SubSector: Business Software & Services | |
| MarketCap: 2902.18 Millions | |
| Recent Price: 30.78 Smart Investing & Trading Score: 50 | |
| Day Percent Change: 0.85% Day Change: 0.26 | |
| Week Change: -0.48% Year-to-date Change: 13.9% | |
| VRNT Links: Profile News Message Board | |
| Charts:- Daily , Weekly | |
| Add VRNT to Watchlist: View: Get Complete VRNT Trend Analysis ➞ | |
 | CLW Clearwater Paper Corporation |
| Sector: Consumer Staples | |
| SubSector: Paper & Paper Products | |
| MarketCap: 416.803 Millions | |
| Recent Price: 44.86 Smart Investing & Trading Score: 100 | |
| Day Percent Change: 0.85% Day Change: 0.38 | |
| Week Change: 11.51% Year-to-date Change: 24.2% | |
| CLW Links: Profile News Message Board | |
| Charts:- Daily , Weekly | |
| Add CLW to Watchlist: View: Get Complete CLW Trend Analysis ➞ | |
 | ACNB ACNB Corporation |
| Sector: Financials | |
| SubSector: Regional - Southwest Banks | |
| MarketCap: 231.065 Millions | |
| Recent Price: 33.41 Smart Investing & Trading Score: 57 | |
| Day Percent Change: 0.85% Day Change: 0.28 | |
| Week Change: -2.2% Year-to-date Change: -25.4% | |
| ACNB Links: Profile News Message Board | |
| Charts:- Daily , Weekly | |
| Add ACNB to Watchlist: View: Get Complete ACNB Trend Analysis ➞ | |
 | BOH Bank of Hawaii Corporation |
| Sector: Financials | |
| SubSector: Regional - Pacific Banks | |
| MarketCap: 2305.19 Millions | |
| Recent Price: 58.49 Smart Investing & Trading Score: 57 | |
| Day Percent Change: 0.84% Day Change: 0.49 | |
| Week Change: -0.24% Year-to-date Change: -19.3% | |
| BOH Links: Profile News Message Board | |
| Charts:- Daily , Weekly | |
| Add BOH to Watchlist: View: Get Complete BOH Trend Analysis ➞ | |
 | OFG OFG Bancorp |
| Sector: Financials | |
| SubSector: Money Center Banks | |
| MarketCap: 537.599 Millions | |
| Recent Price: 37.01 Smart Investing & Trading Score: 90 | |
| Day Percent Change: 0.84% Day Change: 0.31 | |
| Week Change: 1.96% Year-to-date Change: -1.3% | |
| OFG Links: Profile News Message Board | |
| Charts:- Daily , Weekly | |
| Add OFG to Watchlist: View: Get Complete OFG Trend Analysis ➞ | |
 | LZB La-Z-Boy Incorporated |
| Sector: Consumer Staples | |
| SubSector: Home Furnishings & Fixtures | |
| MarketCap: 951.635 Millions | |
| Recent Price: 32.98 Smart Investing & Trading Score: 10 | |
| Day Percent Change: 0.83% Day Change: 0.27 | |
| Week Change: -0.39% Year-to-date Change: -10.7% | |
| LZB Links: Profile News Message Board | |
| Charts:- Daily , Weekly | |
| Add LZB to Watchlist: View: Get Complete LZB Trend Analysis ➞ | |
 | SVC Service Properties Trust |
| Sector: Financials | |
| SubSector: REIT - Hotel/Motel | |
| MarketCap: 1067.74 Millions | |
| Recent Price: 6.05 Smart Investing & Trading Score: 10 | |
| Day Percent Change: 0.83% Day Change: 0.05 | |
| Week Change: -2.81% Year-to-date Change: -29.2% | |
| SVC Links: Profile News Message Board | |
| Charts:- Daily , Weekly | |
| Add SVC to Watchlist: View: Get Complete SVC Trend Analysis ➞ | |
 | EE Excelerate Energy, Inc. |
| Sector: Utilities | |
| SubSector: Utilities - Renewable | |
| MarketCap: 2140 Millions | |
| Recent Price: 16.96 Smart Investing & Trading Score: 75 | |
| Day Percent Change: 0.83% Day Change: 0.14 | |
| Week Change: -1.45% Year-to-date Change: 9.0% | |
| EE Links: Profile News Message Board | |
| Charts:- Daily , Weekly | |
| Add EE to Watchlist: View: Get Complete EE Trend Analysis ➞ | |
 | ALE ALLETE, Inc. |
| Sector: Utilities | |
| SubSector: Diversified Utilities | |
| MarketCap: 3145.4 Millions | |
| Recent Price: 60.84 Smart Investing & Trading Score: 100 | |
| Day Percent Change: 0.83% Day Change: 0.50 | |
| Week Change: 3.08% Year-to-date Change: -0.5% | |
| ALE Links: Profile News Message Board | |
| Charts:- Daily , Weekly | |
| Add ALE to Watchlist: View: Get Complete ALE Trend Analysis ➞ | |
 | HY Hyster-Yale Materials Handling, Inc. |
| Sector: Consumer Staples | |
| SubSector: Trucks & Other Vehicles | |
| MarketCap: 660 Millions | |
| Recent Price: 58.25 Smart Investing & Trading Score: 10 | |
| Day Percent Change: 0.83% Day Change: 0.48 | |
| Week Change: -0.73% Year-to-date Change: -6.3% | |
| HY Links: Profile News Message Board | |
| Charts:- Daily , Weekly | |
| Add HY to Watchlist: View: Get Complete HY Trend Analysis ➞ | |
 | IBEX IBEX Limited |
| Sector: Technology | |
| SubSector: Software Application | |
| MarketCap: 37787 Millions | |
| Recent Price: 13.39 Smart Investing & Trading Score: 45 | |
| Day Percent Change: 0.83% Day Change: 0.11 | |
| Week Change: 1.44% Year-to-date Change: -29.5% | |
| IBEX Links: Profile News Message Board | |
| Charts:- Daily , Weekly | |
| Add IBEX to Watchlist: View: Get Complete IBEX Trend Analysis ➞ | |
 | HSII Heidrick & Struggles International, Inc. |
| Sector: Services & Goods | |
| SubSector: Staffing & Outsourcing Services | |
| MarketCap: 431.428 Millions | |
| Recent Price: 29.63 Smart Investing & Trading Score: 10 | |
| Day Percent Change: 0.82% Day Change: 0.24 | |
| Week Change: -2.08% Year-to-date Change: 0.3% | |
| HSII Links: Profile News Message Board | |
| Charts:- Daily , Weekly | |
| Add HSII to Watchlist: View: Get Complete HSII Trend Analysis ➞ | |
 | FCF First Commonwealth Financial Corporation |
| Sector: Financials | |
| SubSector: Regional - Northeast Banks | |
| MarketCap: 900.299 Millions | |
| Recent Price: 13.59 Smart Investing & Trading Score: 95 | |
| Day Percent Change: 0.82% Day Change: 0.11 | |
| Week Change: 0.3% Year-to-date Change: -12.0% | |
| FCF Links: Profile News Message Board | |
| Charts:- Daily , Weekly | |
| Add FCF to Watchlist: View: Get Complete FCF Trend Analysis ➞ | |
 | UE Urban Edge Properties |
| Sector: Financials | |
| SubSector: REIT - Diversified | |
| MarketCap: 1112.33 Millions | |
| Recent Price: 17.14 Smart Investing & Trading Score: 90 | |
| Day Percent Change: 0.82% Day Change: 0.14 | |
| Week Change: 3.82% Year-to-date Change: -6.3% | |
| UE Links: Profile News Message Board | |
| Charts:- Daily , Weekly | |
| Add UE to Watchlist: View: Get Complete UE Trend Analysis ➞ | |
 | AESI Atlas Energy Solutions Inc. |
| Sector: Energy | |
| SubSector: Oil & Gas Equipment & Services | |
| MarketCap: 947 Millions | |
| Recent Price: 22.15 Smart Investing & Trading Score: 36 | |
| Day Percent Change: 0.82% Day Change: 0.18 | |
| Week Change: -5.46% Year-to-date Change: 29.4% | |
| AESI Links: Profile News Message Board | |
| Charts:- Daily , Weekly | |
| Add AESI to Watchlist: View: Get Complete AESI Trend Analysis ➞ | |
| Too many stocks? View smallcap stocks filtered by marketcap & sector |
| Marketcap: All SmallCap Stocks (default-no microcap), Large, Mid-Range, Small & MicroCap |
| Sector: Tech, Finance, Energy, Staples, Retail, Industrial, Materials, Utilities & Medical |
|
Best Stocks Today 12Stocks.com |
© 2024 12Stocks.com Terms & Conditions Privacy Contact Us
All Information Provided Only For Education And Not To Be Used For Investing or Trading. See Terms & Conditions


One More Thing ... Get Best Stocks Delivered Daily!
Never Ever Miss A Move With Our Top Ten Stocks Lists
Find Best Stocks In Any Market - Bull or Bear Market
Take A Peek At Our Top Ten Stocks Lists: Daily, Weekly, Year-to-Date & Top Trends
Find Best Stocks In Any Market - Bull or Bear Market
Take A Peek At Our Top Ten Stocks Lists: Daily, Weekly, Year-to-Date & Top Trends
Smallcap Stocks With Best Up Trends [0-bearish to 100-bullish]: Emergent BioSolutions[100], Aspen Aerogels[100], Carvana Co[100], Perdoceo Education[100], Gannett Co[100], Pitney Bowes[100], Benchmark Electronics[100], Origin Materials[100], FormFactor [100], Lantheus [100], Q2 [100]
Best Smallcap Stocks Year-to-Date:
Janux [440.16%], Viking [307.09%], Longboard [273.98%], Alpine Immune[239.29%], Bakkt [187.89%], Avidity Biosciences[182.96%], Vera [170.74%], Cullinan Oncology[169.74%], Super Micro[168.25%], Arcutis Bio[166.25%], Y-mAbs [152.93%] Best Smallcap Stocks This Week:
Deciphera [73.24%], Emergent BioSolutions[71.88%], Eyenovia [49.22%], Aspen Aerogels[48.14%], P3 Health[38.51%], Carvana Co[38.18%], Cue Biopharma[37.73%], Origin Materials[36.24%], TransMedics Group[35.14%], Seres [34.55%], Enovix [32.07%] Best Smallcap Stocks Daily:
Emergent BioSolutions[70.98%], Aspen Aerogels[56.70%], Carvana Co[33.77%], Perdoceo Education[31.46%], Enovix [31.06%], Office Properties[28.00%], Gannett Co[26.97%], Sunnova Energy[25.21%], Pitney Bowes[24.70%], Pulmonx [21.50%], CommScope Holding[20.95%]