
 Login Sign Up


| |||||
 |  | ||||

| 12Stocks.com Market Intelligence |
Best SmallCap Stocks
|
| In a hurry? Small Cap Stock Lists: Performance Trends Table, Stock Charts
Sort Small Cap stocks: Daily, Weekly, Year-to-Date, Market Cap & Trends. Filter Small Cap stocks list by sector: Show all, Tech, Finance, Energy, Staples, Retail, Industrial, Materials, Utilities and HealthCare Filter Small Cap stocks list by size: All Large Medium Small and MicroCap |
| 12Stocks.com Small Cap Stocks Performances & Trends Daily | |||||||||
|
|  The overall Smart Investing & Trading Score is 56 (0-bearish to 100-bullish) which puts Small Cap index in short term neutral trend. The Smart Investing & Trading Score from previous trading session is 44 and hence an improvement of trend.
| ||||||||
Here are the Smart Investing & Trading Scores of the most requested small cap stocks at 12Stocks.com (click stock name for detailed review):
|


| 12Stocks.com: Investing in Smallcap Index with Stocks | |
|
The following table helps investors and traders sort through current performance and trends (as measured by Smart Investing & Trading Score) of various
stocks in the Smallcap Index. Quick View: Move mouse or cursor over stock symbol (ticker) to view short-term technical chart and over stock name to view long term chart. Click on  to add stock symbol to your watchlist and to add stock symbol to your watchlist and  to view watchlist. Click on any ticker or stock name for detailed market intelligence report for that stock. to view watchlist. Click on any ticker or stock name for detailed market intelligence report for that stock. |
12Stocks.com Performance of Stocks in Smallcap Index
| Ticker | Stock Name | Watchlist | Category | Recent Price | Smart Investing & Trading Score | Change % | YTD Change% |
| ABG | Asbury Automotive |   | Services & Goods | 221.97 | 80 | 2.23 | -1.33% |
| DX | Dynex Capital | | Financials | 11.92 | 44 | 2.23 | -4.79% |
| PKOH | Park-Ohio | | Services & Goods | 23.91 | 17 | 2.22 | -11.31% |
| MPX | Marine Products | | Consumer Staples | 11.50 | 60 | 2.22 | 0.88% |
| PRIM | Primoris Services | | Industrials | 46.42 | 75 | 2.22 | 39.78% |
| STKL | SunOpta | | Consumer Staples | 6.70 | 100 | 2.21 | 22.39% |
| TLYS | Tilly s | | Services & Goods | 6.01 | 49 | 2.21 | -20.29% |
| YEXT | Yext | | Technology | 5.54 | 7 | 2.21 | -5.94% |
| TRS | TriMas | | Industrials | 26.50 | 73 | 2.20 | 4.62% |
| CHEF | Chefs | | Consumer Staples | 33.58 | 68 | 2.19 | 14.10% |
| PNTG | Pennant Group | | Health Care | 20.75 | 90 | 2.19 | 49.07% |
| ZYXI | Zynex | | Health Care | 11.18 | 17 | 2.19 | 2.66% |
| VECO | Veeco Instruments | | Technology | 35.15 | 58 | 2.18 | 13.28% |
| CYRX | Cryoport | | Consumer Staples | 16.38 | 61 | 2.18 | 5.75% |
| PAHC | Phibro Animal | | Health Care | 12.71 | 58 | 2.17 | 9.76% |
| SIG | Signet Jewelers | | Services & Goods | 101.80 | 88 | 2.15 | -5.09% |
| IHRT | iHeartMedia | | Services & Goods | 2.13 | 52 | 2.15 | -20.04% |
| HRMY | Harmony Biosciences | | Health Care | 29.48 | 35 | 2.15 | -8.69% |
| GES | Guess | | Services & Goods | 26.23 | 43 | 2.14 | 13.75% |
| LILA | Liberty Latin | | Technology | 7.62 | 100 | 2.14 | 4.24% |
| SIBN | SI-BONE | | Health Care | 14.57 | 17 | 2.14 | -30.61% |
| AFRI | Forafric Global | | Consumer Staples | 10.49 | 17 | 2.14 | -0.94% |
| YELP | Yelp | | Technology | 40.82 | 57 | 2.13 | -13.77% |
| CRMD | CorMedix | | Health Care | 5.30 | 71 | 2.12 | 40.96% |
| SBRA | Sabra Health | | Financials | 13.94 | 58 | 2.12 | -2.31% |


| Too many stocks? View smallcap stocks filtered by marketcap & sector |
| Marketcap: All SmallCap Stocks (default-no microcap), Large, Mid-Range, Small |
| Smallcap Sector: Tech, Finance, Energy, Staples, Retail, Industrial, Materials, & Medical |
|
Get the most comprehensive stock market coverage daily at 12Stocks.com ➞ Best Stocks Today ➞ Best Stocks Weekly ➞ Best Stocks Year-to-Date ➞ Best Stocks Trends ➞  Best Stocks Today 12Stocks.com Best Nasdaq Stocks ➞ Best S&P 500 Stocks ➞ Best Tech Stocks ➞ Best Biotech Stocks ➞ |
| Detailed Overview of SmallCap Stocks |
| SmallCap Technical Overview, Leaders & Laggards, Top SmallCap ETF Funds & Detailed SmallCap Stocks List, Charts, Trends & More |
| Smallcap: Technical Analysis, Trends & YTD Performance | |
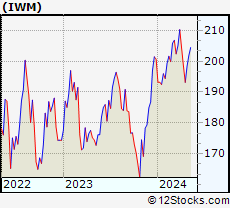
| SmallCap segment as represented by
IWM, an exchange-traded fund [ETF], holds basket of thousands of smallcap stocks from across all major sectors of the US stock market. The smallcap index (contains stocks like Riverbed & Sotheby's) is down by -1.16% and is currently underperforming the overall market by -7.3% year-to-date. Below is a quick view of technical charts and trends: | |
 IWM Weekly Chart |
|
| Long Term Trend: Good | |
| Medium Term Trend: Not Good | |
 IWM Daily Chart |
|
| Short Term Trend: Very Good | |
| Overall Trend Score: 56 | |
| YTD Performance: -1.16% | |
| **Trend Scores & Views Are Only For Educational Purposes And Not For Investing | |
| 12Stocks.com: Top Performing Small Cap Index Stocks | ||||||||||||||||||||||||||||||||||||||||||||||||
 The top performing Small Cap Index stocks year to date are
Now, more recently, over last week, the top performing Small Cap Index stocks on the move are


|
||||||||||||||||||||||||||||||||||||||||||||||||
| 12Stocks.com: Investing in Smallcap Index using Exchange Traded Funds | |
|
The following table shows list of key exchange traded funds (ETF) that
help investors track Smallcap index. The following list also includes leveraged ETF funds that track twice or thrice the daily returns of Smallcap indices. Short or inverse ETF funds move in the opposite direction to the index they track and are useful during market pullbacks or during bear markets. Quick View: Move mouse or cursor over ETF symbol (ticker) to view short-term technical chart and over ETF name to view long term chart. Click on ticker or stock name for detailed view. Click on to add stock symbol to your watchlist and to view watchlist. |
12Stocks.com List of ETFs that track Smallcap Index
| Ticker | ETF Name | Watchlist | Recent Price | Smart Investing & Trading Score | Change % | Week % | Year-to-date % |
| IWM | iShares Russell 2000 | | 198.39 | 56 | 0.97 | 2.72 | -1.16% |
| IJR | iShares Core S&P Small-Cap | | 105.65 | 85 | 0.75 | 2.35 | -2.4% |
| VTWO | Vanguard Russell 2000 ETF | | 80.28 | 70 | 1.04 | 2.82 | -1.01% |
| IWN | iShares Russell 2000 Value | | 151.14 | 75 | 0.64 | 2.27 | -2.7% |
| IWO | iShares Russell 2000 Growth | | 253.09 | 58 | 1.29 | 3.18 | 0.34% |
| IJS | iShares S&P Small-Cap 600 Value | | 97.19 | 67 | 0.52 | 1.65 | -5.7% |
| IJT | iShares S&P Small-Cap 600 Growth | | 126.16 | 70 | 0.88 | 3.23 | 0.82% |
| XSLV | PowerShares S&P SmallCap Low Volatil ETF | | 42.72 | 80 | 0.42 | 1.28 | -3.24% |
| SAA | ProShares Ultra SmallCap600 | | 23.04 | 65 | 1.65 | 5.67 | -7.68% |
| SBB | ProShares Short SmallCap600 | | 16.39 | 33 | -0.70 | -2.7 | 2.86% |
| SDD | ProShares UltraShort SmallCap600 | | 19.35 | 35 | -1.17 | -4.87 | 5.01% |
| SMLV | SPDR SSGA US Small Cap Low Volatil ETF | | 107.52 | 80 | 0.18 | 1.35 | -4.44% |
| 12Stocks.com: Charts, Trends, Fundamental Data and Performances of SmallCap Stocks | |
|
We now take in-depth look at all SmallCap stocks including charts, multi-period performances and overall trends (as measured by Smart Investing & Trading Score). One can sort SmallCap stocks (click link to choose) by Daily, Weekly and by Year-to-Date performances. Also, one can sort by size of the company or by market capitalization. |
| Select Your Default Chart Type: | |||||
| |||||
| Click on stock symbol or name for detailed view. Click on to add stock symbol to your watchlist and to view watchlist. Quick View: Move mouse or cursor over "Daily" to quickly view daily technical stock chart and over "Weekly" to view weekly technical stock chart. | |||||

 | ABG Asbury Automotive Group, Inc. |
| Sector: Services & Goods | |
| SubSector: Auto Dealerships | |
| MarketCap: 1203.21 Millions | |
| Recent Price: 221.97 Smart Investing & Trading Score: 80 | |
| Day Percent Change: 2.23% Day Change: 4.85 | |
| Week Change: 3.18% Year-to-date Change: -1.3% | |
| ABG Links: Profile News Message Board | |
| Charts:- Daily , Weekly | |
| Add ABG to Watchlist: View: Get Complete ABG Trend Analysis ➞ | |
 | DX Dynex Capital, Inc. |
| Sector: Financials | |
| SubSector: Mortgage Investment | |
| MarketCap: 327.839 Millions | |
| Recent Price: 11.92 Smart Investing & Trading Score: 44 | |
| Day Percent Change: 2.23% Day Change: 0.26 | |
| Week Change: 1.79% Year-to-date Change: -4.8% | |
| DX Links: Profile News Message Board | |
| Charts:- Daily , Weekly | |
| Add DX to Watchlist: View: Get Complete DX Trend Analysis ➞ | |
 | PKOH Park-Ohio Holdings Corp. |
| Sector: Services & Goods | |
| SubSector: Industrial Equipment Wholesale | |
| MarketCap: 214.358 Millions | |
| Recent Price: 23.91 Smart Investing & Trading Score: 17 | |
| Day Percent Change: 2.22% Day Change: 0.52 | |
| Week Change: 0.04% Year-to-date Change: -11.3% | |
| PKOH Links: Profile News Message Board | |
| Charts:- Daily , Weekly | |
| Add PKOH to Watchlist: View: Get Complete PKOH Trend Analysis ➞ | |
 | MPX Marine Products Corporation |
| Sector: Consumer Staples | |
| SubSector: Recreational Vehicles | |
| MarketCap: 316.059 Millions | |
| Recent Price: 11.50 Smart Investing & Trading Score: 60 | |
| Day Percent Change: 2.22% Day Change: 0.25 | |
| Week Change: 1.5% Year-to-date Change: 0.9% | |
| MPX Links: Profile News Message Board | |
| Charts:- Daily , Weekly | |
| Add MPX to Watchlist: View: Get Complete MPX Trend Analysis ➞ | |
 | PRIM Primoris Services Corporation |
| Sector: Industrials | |
| SubSector: Heavy Construction | |
| MarketCap: 931.895 Millions | |
| Recent Price: 46.42 Smart Investing & Trading Score: 75 | |
| Day Percent Change: 2.22% Day Change: 1.01 | |
| Week Change: 6.64% Year-to-date Change: 39.8% | |
| PRIM Links: Profile News Message Board | |
| Charts:- Daily , Weekly | |
| Add PRIM to Watchlist: View: Get Complete PRIM Trend Analysis ➞ | |
 | STKL SunOpta Inc. |
| Sector: Consumer Staples | |
| SubSector: Processed & Packaged Goods | |
| MarketCap: 174.548 Millions | |
| Recent Price: 6.70 Smart Investing & Trading Score: 100 | |
| Day Percent Change: 2.21% Day Change: 0.15 | |
| Week Change: 12.33% Year-to-date Change: 22.4% | |
| STKL Links: Profile News Message Board | |
| Charts:- Daily , Weekly | |
| Add STKL to Watchlist: View: Get Complete STKL Trend Analysis ➞ | |
 | TLYS Tilly s, Inc. |
| Sector: Services & Goods | |
| SubSector: Apparel Stores | |
| MarketCap: 127.408 Millions | |
| Recent Price: 6.01 Smart Investing & Trading Score: 49 | |
| Day Percent Change: 2.21% Day Change: 0.13 | |
| Week Change: 4.52% Year-to-date Change: -20.3% | |
| TLYS Links: Profile News Message Board | |
| Charts:- Daily , Weekly | |
| Add TLYS to Watchlist: View: Get Complete TLYS Trend Analysis ➞ | |
 | YEXT Yext, Inc. |
| Sector: Technology | |
| SubSector: Internet Software & Services | |
| MarketCap: 1414.91 Millions | |
| Recent Price: 5.54 Smart Investing & Trading Score: 7 | |
| Day Percent Change: 2.21% Day Change: 0.12 | |
| Week Change: 1.47% Year-to-date Change: -5.9% | |
| YEXT Links: Profile News Message Board | |
| Charts:- Daily , Weekly | |
| Add YEXT to Watchlist: View: Get Complete YEXT Trend Analysis ➞ | |
 | TRS TriMas Corporation |
| Sector: Industrials | |
| SubSector: Industrial Equipment & Components | |
| MarketCap: 963.509 Millions | |
| Recent Price: 26.50 Smart Investing & Trading Score: 73 | |
| Day Percent Change: 2.20% Day Change: 0.57 | |
| Week Change: 1.69% Year-to-date Change: 4.6% | |
| TRS Links: Profile News Message Board | |
| Charts:- Daily , Weekly | |
| Add TRS to Watchlist: View: Get Complete TRS Trend Analysis ➞ | |
 | CHEF The Chefs Warehouse, Inc. |
| Sector: Consumer Staples | |
| SubSector: Food Wholesale | |
| MarketCap: 207.529 Millions | |
| Recent Price: 33.58 Smart Investing & Trading Score: 68 | |
| Day Percent Change: 2.19% Day Change: 0.72 | |
| Week Change: 3.58% Year-to-date Change: 14.1% | |
| CHEF Links: Profile News Message Board | |
| Charts:- Daily , Weekly | |
| Add CHEF to Watchlist: View: Get Complete CHEF Trend Analysis ➞ | |
 | PNTG The Pennant Group, Inc. |
| Sector: Health Care | |
| SubSector: Long-Term Care Facilities | |
| MarketCap: 451.786 Millions | |
| Recent Price: 20.75 Smart Investing & Trading Score: 90 | |
| Day Percent Change: 2.19% Day Change: 0.45 | |
| Week Change: 2.22% Year-to-date Change: 49.1% | |
| PNTG Links: Profile News Message Board | |
| Charts:- Daily , Weekly | |
| Add PNTG to Watchlist: View: Get Complete PNTG Trend Analysis ➞ | |
 | ZYXI Zynex, Inc. |
| Sector: Health Care | |
| SubSector: Medical Appliances & Equipment | |
| MarketCap: 388.58 Millions | |
| Recent Price: 11.18 Smart Investing & Trading Score: 17 | |
| Day Percent Change: 2.19% Day Change: 0.24 | |
| Week Change: -1.63% Year-to-date Change: 2.7% | |
| ZYXI Links: Profile News Message Board | |
| Charts:- Daily , Weekly | |
| Add ZYXI to Watchlist: View: Get Complete ZYXI Trend Analysis ➞ | |
 | VECO Veeco Instruments Inc. |
| Sector: Technology | |
| SubSector: Semiconductor Equipment & Materials | |
| MarketCap: 450.718 Millions | |
| Recent Price: 35.15 Smart Investing & Trading Score: 58 | |
| Day Percent Change: 2.18% Day Change: 0.75 | |
| Week Change: 7.89% Year-to-date Change: 13.3% | |
| VECO Links: Profile News Message Board | |
| Charts:- Daily , Weekly | |
| Add VECO to Watchlist: View: Get Complete VECO Trend Analysis ➞ | |
 | CYRX Cryoport, Inc. |
| Sector: Consumer Staples | |
| SubSector: Packaging & Containers | |
| MarketCap: 576.653 Millions | |
| Recent Price: 16.38 Smart Investing & Trading Score: 61 | |
| Day Percent Change: 2.18% Day Change: 0.35 | |
| Week Change: 1.55% Year-to-date Change: 5.8% | |
| CYRX Links: Profile News Message Board | |
| Charts:- Daily , Weekly | |
| Add CYRX to Watchlist: View: Get Complete CYRX Trend Analysis ➞ | |
 | PAHC Phibro Animal Health Corporation |
| Sector: Health Care | |
| SubSector: Specialized Health Services | |
| MarketCap: 852.956 Millions | |
| Recent Price: 12.71 Smart Investing & Trading Score: 58 | |
| Day Percent Change: 2.17% Day Change: 0.27 | |
| Week Change: -4.44% Year-to-date Change: 9.8% | |
| PAHC Links: Profile News Message Board | |
| Charts:- Daily , Weekly | |
| Add PAHC to Watchlist: View: Get Complete PAHC Trend Analysis ➞ | |
 | SIG Signet Jewelers Limited |
| Sector: Services & Goods | |
| SubSector: Jewelry Stores | |
| MarketCap: 518.1 Millions | |
| Recent Price: 101.80 Smart Investing & Trading Score: 88 | |
| Day Percent Change: 2.15% Day Change: 2.14 | |
| Week Change: 6.63% Year-to-date Change: -5.1% | |
| SIG Links: Profile News Message Board | |
| Charts:- Daily , Weekly | |
| Add SIG to Watchlist: View: Get Complete SIG Trend Analysis ➞ | |
 | IHRT iHeartMedia, Inc. |
| Sector: Services & Goods | |
| SubSector: Broadcasting - Radio | |
| MarketCap: 694 Millions | |
| Recent Price: 2.13 Smart Investing & Trading Score: 52 | |
| Day Percent Change: 2.15% Day Change: 0.04 | |
| Week Change: 12.37% Year-to-date Change: -20.0% | |
| IHRT Links: Profile News Message Board | |
| Charts:- Daily , Weekly | |
| Add IHRT to Watchlist: View: Get Complete IHRT Trend Analysis ➞ | |
 | HRMY Harmony Biosciences Holdings, Inc. |
| Sector: Health Care | |
| SubSector: Biotechnology | |
| MarketCap: 24487 Millions | |
| Recent Price: 29.48 Smart Investing & Trading Score: 35 | |
| Day Percent Change: 2.15% Day Change: 0.62 | |
| Week Change: 1.22% Year-to-date Change: -8.7% | |
| HRMY Links: Profile News Message Board | |
| Charts:- Daily , Weekly | |
| Add HRMY to Watchlist: View: Get Complete HRMY Trend Analysis ➞ | |
 | GES Guess , Inc. |
| Sector: Services & Goods | |
| SubSector: Apparel Stores | |
| MarketCap: 591.908 Millions | |
| Recent Price: 26.23 Smart Investing & Trading Score: 43 | |
| Day Percent Change: 2.14% Day Change: 0.55 | |
| Week Change: 2.1% Year-to-date Change: 13.8% | |
| GES Links: Profile News Message Board | |
| Charts:- Daily , Weekly | |
| Add GES to Watchlist: View: Get Complete GES Trend Analysis ➞ | |
 | LILA Liberty Latin America Ltd. |
| Sector: Technology | |
| SubSector: CATV Systems | |
| MarketCap: 2092.62 Millions | |
| Recent Price: 7.62 Smart Investing & Trading Score: 100 | |
| Day Percent Change: 2.14% Day Change: 0.16 | |
| Week Change: 4.53% Year-to-date Change: 4.2% | |
| LILA Links: Profile News Message Board | |
| Charts:- Daily , Weekly | |
| Add LILA to Watchlist: View: Get Complete LILA Trend Analysis ➞ | |
 | SIBN SI-BONE, Inc. |
| Sector: Health Care | |
| SubSector: Medical Appliances & Equipment | |
| MarketCap: 234.78 Millions | |
| Recent Price: 14.57 Smart Investing & Trading Score: 17 | |
| Day Percent Change: 2.14% Day Change: 0.30 | |
| Week Change: -5.67% Year-to-date Change: -30.6% | |
| SIBN Links: Profile News Message Board | |
| Charts:- Daily , Weekly | |
| Add SIBN to Watchlist: View: Get Complete SIBN Trend Analysis ➞ | |
 | AFRI Forafric Global PLC |
| Sector: Consumer Staples | |
| SubSector: Farm Products | |
| MarketCap: 295 Millions | |
| Recent Price: 10.49 Smart Investing & Trading Score: 17 | |
| Day Percent Change: 2.14% Day Change: 0.22 | |
| Week Change: 0.96% Year-to-date Change: -0.9% | |
| AFRI Links: Profile News Message Board | |
| Charts:- Daily , Weekly | |
| Add AFRI to Watchlist: View: Get Complete AFRI Trend Analysis ➞ | |
 | YELP Yelp Inc. |
| Sector: Technology | |
| SubSector: Internet Information Providers | |
| MarketCap: 1430.1 Millions | |
| Recent Price: 40.82 Smart Investing & Trading Score: 57 | |
| Day Percent Change: 2.13% Day Change: 0.85 | |
| Week Change: 3.89% Year-to-date Change: -13.8% | |
| YELP Links: Profile News Message Board | |
| Charts:- Daily , Weekly | |
| Add YELP to Watchlist: View: Get Complete YELP Trend Analysis ➞ | |
 | CRMD CorMedix, Inc. |
| Sector: Health Care | |
| SubSector: Biotechnology | |
| MarketCap: 90.7785 Millions | |
| Recent Price: 5.30 Smart Investing & Trading Score: 71 | |
| Day Percent Change: 2.12% Day Change: 0.11 | |
| Week Change: 0.38% Year-to-date Change: 41.0% | |
| CRMD Links: Profile News Message Board | |
| Charts:- Daily , Weekly | |
| Add CRMD to Watchlist: View: Get Complete CRMD Trend Analysis ➞ | |
 | SBRA Sabra Health Care REIT, Inc. |
| Sector: Financials | |
| SubSector: REIT - Healthcare Facilities | |
| MarketCap: 2576.54 Millions | |
| Recent Price: 13.94 Smart Investing & Trading Score: 58 | |
| Day Percent Change: 2.12% Day Change: 0.29 | |
| Week Change: 2.05% Year-to-date Change: -2.3% | |
| SBRA Links: Profile News Message Board | |
| Charts:- Daily , Weekly | |
| Add SBRA to Watchlist: View: Get Complete SBRA Trend Analysis ➞ | |
| Too many stocks? View smallcap stocks filtered by marketcap & sector |
| Marketcap: All SmallCap Stocks (default-no microcap), Large, Mid-Range, Small & MicroCap |
| Sector: Tech, Finance, Energy, Staples, Retail, Industrial, Materials, Utilities & Medical |
|
Best Stocks Today 12Stocks.com |
© 2024 12Stocks.com Terms & Conditions Privacy Contact Us
All Information Provided Only For Education And Not To Be Used For Investing or Trading. See Terms & Conditions


One More Thing ... Get Best Stocks Delivered Daily!
Never Ever Miss A Move With Our Top Ten Stocks Lists
Find Best Stocks In Any Market - Bull or Bear Market
Take A Peek At Our Top Ten Stocks Lists: Daily, Weekly, Year-to-Date & Top Trends
Find Best Stocks In Any Market - Bull or Bear Market
Take A Peek At Our Top Ten Stocks Lists: Daily, Weekly, Year-to-Date & Top Trends
Smallcap Stocks With Best Up Trends [0-bearish to 100-bullish]: Cullinan Oncology[100], NextNav [100], MBIA [100], Reservoir Media[100], Braemar Hotels[100], B. Riley[100], Pactiv Evergreen[100], Wolverine World[100], Haemonetics [100], Benchmark Electronics[100], Uniti Group[100]
Best Smallcap Stocks Year-to-Date:
CareMax [568.04%], Janux [341.65%], Viking [299.3%], Alpine Immune[239.21%], Longboard [222.09%], Super Micro[201.81%], Avidity Biosciences[166.81%], Arcutis Bio[161.92%], Vera [156.27%], Cullinan Oncology[147.08%], Hippo [141.6%] Best Smallcap Stocks This Week:
Matterport [170.98%], B. Riley[83.84%], Cullinan Oncology[60.86%], Seres [48.22%], Zura Bio[38.67%], Universal Logistics[36.27%], Tutor Perini[33.89%], IGM Biosciences[30.83%], Riot Blockchain[30.61%], Impinj [29.79%], Sonic Automotive[28.14%] Best Smallcap Stocks Daily:
Universal Logistics[38.80%], Zura Bio[31.90%], Cullinan Oncology[30.86%], Tutor Perini[28.01%], IGM Biosciences[23.62%], U.S. Silica[21.67%], Maxeon Solar[20.17%], Exponent [19.40%], TPI Composites[16.32%], OptimizeRx [14.84%], Solaris Oilfield[13.95%]