
 Login Sign Up


| |||||
 |  | ||||

| 12Stocks.com Market Intelligence |
Best S&P 500 Stocks
|
On this page, you will find the most comprehensive analysis of S&P 500 stocks and ETFs - from latest trends to performances to charts ➞. First, here are the year-to-date (YTD) performances of the most requested S&P 500 stocks at 12Stocks.com (click stock for review):
| NVIDIA 75% | ||
| Merck 19% | ||
| Google 17% | ||
| Amazon.com 16% | ||
| Caterpillar 13% | ||
| Walmart 13% | ||
| JPMorgan Chase 13% | ||
| Goldman Sachs 11% | ||
| Chevron 8% | ||
| Microsoft 4% | ||
| Johnson & Johnson -8% | ||
| Starbucks -8% | ||
| McDonald s -8% | ||
| Apple -12% | ||
| Gilead -20% | ||
| Boeing -36% | ||
| Intel -39% | ||
| Quick: S&P 500 Stocks Lists: Performances & Trends, S&P 500 Stock Charts
Sort S&P 500 stocks: Daily, Weekly, Year-to-Date, Market Cap & Trends. Filter S&P 500 stocks list by sector: Show all, Tech, Finance, Energy, Staples, Retail, Industrial, Materials, Utilities and HealthCare |
| 12Stocks.com S&P 500 Stocks Performances & Trends Daily Report | |||||||||
|
| 
The overall Smart Investing & Trading Score is 51 (0-bearish to 100-bullish) which puts S&P 500 index in short term neutral trend. The Smart Investing & Trading Score from previous trading session is 78 and hence a deterioration of trend. | ||||||||
Here are the Smart Investing & Trading Scores of the most requested S&P 500 stocks at 12Stocks.com (click stock name for detailed review):
|


| 12Stocks.com: Top Performing S&P 500 Index Stocks | ||||||||||||||||||||||||||||||||||||||||||||||||
 The top performing S&P 500 Index stocks year to date are
Now, more recently, over last week, the top performing S&P 500 Index stocks on the move are


|
||||||||||||||||||||||||||||||||||||||||||||||||
| 12Stocks.com: Investing in S&P 500 Index with Stocks | |
|
The following table helps investors and traders sort through current performance and trends (as measured by Smart Investing & Trading Score) of various
stocks in the S&P 500 Index. Quick View: Move mouse or cursor over stock symbol (ticker) to view short-term technical chart and over stock name to view long term chart. Click on  to add stock symbol to your watchlist and to add stock symbol to your watchlist and  to view watchlist. Click on any ticker or stock name for detailed market intelligence report for that stock. to view watchlist. Click on any ticker or stock name for detailed market intelligence report for that stock. |
12Stocks.com Performance of Stocks in S&P 500 Index
| Ticker | Stock Name | Watchlist | Category | Recent Price | Smart Investing & Trading Score | Change % | Weekly Change% |
| STLD | Steel Dynamics |   | Materials | 130.08 | 36 | -3.69% | -2.95% |
| ORCL | Oracle | | Technology | 113.75 | 44 | -2.35% | -2.95% |
| META | Meta Platforms | | Technology | 430.23 | 44 | -0.55% | -2.95% |
| MLM | Martin Marietta | | Industrials | 587.07 | 38 | -2.58% | -2.96% |
| CFG | Citizens Financial | | Financials | 34.11 | 58 | -2.49% | -2.96% |
| CMI | Cummins | | Industrials | 282.49 | 36 | -3.80% | -2.97% |
| GNRC | Generac Holdings | | Industrials | 135.96 | 71 | -0.98% | -2.97% |
| ROST | Ross Stores | | Services & Goods | 129.59 | 0 | -1.12% | -3.01% |
| ANET | Arista Networks | | Technology | 256.56 | 58 | -2.70% | -3.08% |
| HES | Hess | | Energy | 157.49 | 63 | -3.46% | -3.10% |
| ADBE | Adobe | | Technology | 462.65 | 10 | -2.20% | -3.12% |
| OMC | Omnicom | | Services & Goods | 92.84 | 58 | -3.18% | -3.18% |
| FANG | Diamondback | | Energy | 201.07 | 54 | -2.33% | -3.22% |
| APA | Apache | | Energy | 31.43 | 23 | -3.94% | -3.26% |
| IPG | Interpublic | | Services & Goods | 30.44 | 8 | -3.15% | -3.27% |
| ROK | Rockwell Automation | | Industrials | 270.96 | 26 | -3.22% | -3.27% |
| CTRA | Contura | | Materials | 27.36 | 74 | -3.63% | -3.29% |
| URI | United Rentals | | Transports | 667.99 | 41 | -6.27% | -3.30% |
| MRO | Marathon Oil | | Energy | 26.85 | 36 | -3.90% | -3.31% |
| MTCH | Match | | Technology | 30.82 | 15 | -2.24% | -3.34% |
| AVGO | Broadcom | | Technology | 1299.06 | 56 | -2.96% | -3.35% |
| LRCX | Lam Research | | Technology | 894.21 | 51 | -3.73% | -3.37% |
| IVZ | Invesco | | Financials | 14.17 | 10 | -2.01% | -3.41% |
| VRSN | VeriSign | | Technology | 169.43 | 0 | -3.24% | -3.45% |
| ABNB | Airbnb | | Technology | 158.56 | 53 | -2.27% | -3.45% |
| For chart view version of above stock list: Chart View ➞ 0 - 25 , 25 - 50 , 50 - 75 , 75 - 100 , 100 - 125 , 125 - 150 , 150 - 175 , 175 - 200 , 200 - 225 , 225 - 250 , 250 - 275 , 275 - 300 , 300 - 325 , 325 - 350 , 350 - 375 , 375 - 400 , 400 - 425 , 425 - 450 , 450 - 475 , 475 - 500 | ||
 | Click To Change The Sort Order: By Market Cap or Company Size Performance: Year-to-date, Week and Day |  |
|
Get the most comprehensive stock market coverage daily at 12Stocks.com ➞ Best Stocks Today ➞ Best Stocks Weekly ➞ Best Stocks Year-to-Date ➞ Best Stocks Trends ➞  Best Stocks Today 12Stocks.com Best Nasdaq Stocks ➞ Best S&P 500 Stocks ➞ Best Tech Stocks ➞ Best Biotech Stocks ➞ |
| Detailed Overview of S&P 500 Stocks |
| S&P 500 Technical Overview, Leaders & Laggards, Top S&P 500 ETF Funds & Detailed S&P 500 Stocks List, Charts, Trends & More |
| S&P 500: Technical Analysis, Trends & YTD Performance | |
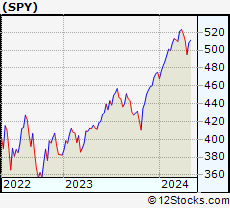
| S&P 500 index as represented by
SPY, an exchange-traded fund [ETF], holds basket of five hundred (mostly largecap) stocks from across all major sectors of the US stock market. The S&P 500 index (contains stocks like Apple and Exxon) is up by 5.61% and is currently outperforming the overall market by 0.81% year-to-date. Below is a quick view of technical charts and trends: | |
 SPY Weekly Chart |
|
| Long Term Trend: Good | |
| Medium Term Trend: Not Good | |
 SPY Daily Chart |
|
| Short Term Trend: Very Good | |
| Overall Trend Score: 51 | |
| YTD Performance: 5.61% | |
| **Trend Scores & Views Are Only For Educational Purposes And Not For Investing | |
| 12Stocks.com: Investing in S&P 500 Index using Exchange Traded Funds | |
|
The following table shows list of key exchange traded funds (ETF) that
help investors track S&P 500 index. The following list also includes leveraged ETF funds that track twice or thrice the daily returns of S&P 500 indices. Short or inverse ETF funds move in the opposite direction to the index they track and are useful during market pullbacks or during bear markets. Quick View: Move mouse or cursor over ETF symbol (ticker) to view short-term technical chart and over ETF name to view long term chart. Click on ticker or stock name for detailed view. Click on to add stock symbol to your watchlist and to view watchlist. |
12Stocks.com List of ETFs that track S&P 500 Index
| Ticker | ETF Name | Watchlist | Recent Price | Smart Investing & Trading Score | Change % | Week % | Year-to-date % |
| SPY | SPDR S&P 500 ETF | | 501.98 | 51 | -1.58 | -1.24 | 5.61% |
| IVV | iShares Core S&P 500 ETF | | 504.70 | 71 | -1.54 | -1.19 | 5.67% |
| VOO | Vanguard 500 ETF | | 461.59 | 71 | -1.55 | -1.2 | 5.68% |
| OEF | iShares S&P 100 | | 238.44 | 51 | -1.51 | -1.29 | 6.74% |
| SSO | ProShares Ultra S&P500 | | 70.87 | 51 | -3.17 | -2.53 | 8.91% |
| UPRO | ProShares UltraPro S&P500 | | 61.40 | 58 | -4.72 | -3.79 | 12.17% |
| SPXL | Direxion Daily S&P500 Bull 3X ETF | | 116.70 | 63 | -4.63 | -3.67 | 12.22% |
| SH | ProShares Short S&P500 | | 12.43 | 60 | 1.47 | 1.22 | -4.31% |
| SDS | ProShares UltraShort S&P500 | | 27.20 | 50 | 3.19 | 2.53 | -9.09% |
| SPXU | ProShares UltraPro Short S&P500 | | 36.85 | 42 | 4.78 | 3.8 | -14.3% |
| SPXS | Direxion Daily S&P 500 Bear 3X ETF | | 9.96 | 32 | 4.57 | 3.59 | -13.81% |
| 12Stocks.com: Charts, Trends, Fundamental Data and Performances of S&P 500 Stocks | |
|
We now take in-depth look at all S&P 500 stocks including charts, multi-period performances and overall trends (as measured by Smart Investing & Trading Score). One can sort S&P 500 stocks (click link to choose) by Daily, Weekly and by Year-to-Date performances. Also, one can sort by size of the company or by market capitalization. |
| Select Your Default Chart Type: | |||||
| |||||
| Click on stock symbol or name for detailed view. Click on to add stock symbol to your watchlist and to view watchlist. Quick View: Move mouse or cursor over "Daily" to quickly view daily technical stock chart and over "Weekly" to view weekly technical stock chart. | |||||

 | STLD Steel Dynamics, Inc. |
| Sector: Materials | |
| SubSector: Steel & Iron | |
| MarketCap: 4533.58 Millions | |
| Recent Price: 130.08 Smart Investing & Trading Score: 36 | |
| Day Percent Change: -3.69% Day Change: -4.99 | |
| Week Change: -2.95% Year-to-date Change: 10.1% | |
| STLD Links: Profile News Message Board | |
| Charts:- Daily , Weekly | |
| Add STLD to Watchlist: View: Get STLD Trend Analysis ➞ | |
 | ORCL Oracle Corporation |
| Sector: Technology | |
| SubSector: Application Software | |
| MarketCap: 164530 Millions | |
| Recent Price: 113.75 Smart Investing & Trading Score: 44 | |
| Day Percent Change: -2.35% Day Change: -2.74 | |
| Week Change: -2.95% Year-to-date Change: 7.9% | |
| ORCL Links: Profile News Message Board | |
| Charts:- Daily , Weekly | |
| Add ORCL to Watchlist: View: Get ORCL Trend Analysis ➞ | |
 | META Meta Platforms, Inc. |
| Sector: Technology | |
| SubSector: Internet Content & Information | |
| MarketCap: 732990 Millions | |
| Recent Price: 430.23 Smart Investing & Trading Score: 44 | |
| Day Percent Change: -0.55% Day Change: -2.39 | |
| Week Change: -2.95% Year-to-date Change: 21.5% | |
| META Links: Profile News Message Board | |
| Charts:- Daily , Weekly | |
| Add META to Watchlist: View: Get META Trend Analysis ➞ | |
 | MLM Martin Marietta Materials, Inc. |
| Sector: Industrials | |
| SubSector: General Building Materials | |
| MarketCap: 10624.3 Millions | |
| Recent Price: 587.07 Smart Investing & Trading Score: 38 | |
| Day Percent Change: -2.58% Day Change: -15.57 | |
| Week Change: -2.96% Year-to-date Change: 17.7% | |
| MLM Links: Profile News Message Board | |
| Charts:- Daily , Weekly | |
| Add MLM to Watchlist: View: Get MLM Trend Analysis ➞ | |
 | CFG Citizens Financial Group, Inc. |
| Sector: Financials | |
| SubSector: Regional - Mid-Atlantic Banks | |
| MarketCap: 8225.19 Millions | |
| Recent Price: 34.11 Smart Investing & Trading Score: 58 | |
| Day Percent Change: -2.49% Day Change: -0.87 | |
| Week Change: -2.96% Year-to-date Change: 2.9% | |
| CFG Links: Profile News Message Board | |
| Charts:- Daily , Weekly | |
| Add CFG to Watchlist: View: Get CFG Trend Analysis ➞ | |
 | CMI Cummins Inc. |
| Sector: Industrials | |
| SubSector: Diversified Machinery | |
| MarketCap: 19127.1 Millions | |
| Recent Price: 282.49 Smart Investing & Trading Score: 36 | |
| Day Percent Change: -3.80% Day Change: -11.16 | |
| Week Change: -2.97% Year-to-date Change: 17.9% | |
| CMI Links: Profile News Message Board | |
| Charts:- Daily , Weekly | |
| Add CMI to Watchlist: View: Get CMI Trend Analysis ➞ | |
 | GNRC Generac Holdings Inc. |
| Sector: Industrials | |
| SubSector: Diversified Machinery | |
| MarketCap: 5736.26 Millions | |
| Recent Price: 135.96 Smart Investing & Trading Score: 71 | |
| Day Percent Change: -0.98% Day Change: -1.34 | |
| Week Change: -2.97% Year-to-date Change: 5.2% | |
| GNRC Links: Profile News Message Board | |
| Charts:- Daily , Weekly | |
| Add GNRC to Watchlist: View: Get GNRC Trend Analysis ➞ | |
 | ROST Ross Stores, Inc. |
| Sector: Services & Goods | |
| SubSector: Apparel Stores | |
| MarketCap: 24938.8 Millions | |
| Recent Price: 129.59 Smart Investing & Trading Score: 0 | |
| Day Percent Change: -1.12% Day Change: -1.47 | |
| Week Change: -3.01% Year-to-date Change: -6.4% | |
| ROST Links: Profile News Message Board | |
| Charts:- Daily , Weekly | |
| Add ROST to Watchlist: View: Get ROST Trend Analysis ➞ | |
 | ANET Arista Networks, Inc. |
| Sector: Technology | |
| SubSector: Diversified Computer Systems | |
| MarketCap: 14071.2 Millions | |
| Recent Price: 256.56 Smart Investing & Trading Score: 58 | |
| Day Percent Change: -2.70% Day Change: -7.11 | |
| Week Change: -3.08% Year-to-date Change: 8.9% | |
| ANET Links: Profile News Message Board | |
| Charts:- Daily , Weekly | |
| Add ANET to Watchlist: View: Get ANET Trend Analysis ➞ | |
 | HES Hess Corporation |
| Sector: Energy | |
| SubSector: Independent Oil & Gas | |
| MarketCap: 10465.3 Millions | |
| Recent Price: 157.49 Smart Investing & Trading Score: 63 | |
| Day Percent Change: -3.46% Day Change: -5.64 | |
| Week Change: -3.1% Year-to-date Change: 9.3% | |
| HES Links: Profile News Message Board | |
| Charts:- Daily , Weekly | |
| Add HES to Watchlist: View: Get HES Trend Analysis ➞ | |
 | ADBE Adobe Inc. |
| Sector: Technology | |
| SubSector: Application Software | |
| MarketCap: 157868 Millions | |
| Recent Price: 462.65 Smart Investing & Trading Score: 10 | |
| Day Percent Change: -2.20% Day Change: -10.42 | |
| Week Change: -3.12% Year-to-date Change: -22.5% | |
| ADBE Links: Profile News Message Board | |
| Charts:- Daily , Weekly | |
| Add ADBE to Watchlist: View: Get ADBE Trend Analysis ➞ | |
 | OMC Omnicom Group Inc. |
| Sector: Services & Goods | |
| SubSector: Advertising Agencies | |
| MarketCap: 11813.5 Millions | |
| Recent Price: 92.84 Smart Investing & Trading Score: 58 | |
| Day Percent Change: -3.18% Day Change: -3.05 | |
| Week Change: -3.18% Year-to-date Change: 7.3% | |
| OMC Links: Profile News Message Board | |
| Charts:- Daily , Weekly | |
| Add OMC to Watchlist: View: Get OMC Trend Analysis ➞ | |
 | FANG Diamondback Energy, Inc. |
| Sector: Energy | |
| SubSector: Independent Oil & Gas | |
| MarketCap: 3009.13 Millions | |
| Recent Price: 201.07 Smart Investing & Trading Score: 54 | |
| Day Percent Change: -2.33% Day Change: -4.79 | |
| Week Change: -3.22% Year-to-date Change: 29.7% | |
| FANG Links: Profile News Message Board | |
| Charts:- Daily , Weekly | |
| Add FANG to Watchlist: View: Get FANG Trend Analysis ➞ | |
 | APA Apache Corporation |
| Sector: Energy | |
| SubSector: Independent Oil & Gas | |
| MarketCap: 1937.53 Millions | |
| Recent Price: 31.43 Smart Investing & Trading Score: 23 | |
| Day Percent Change: -3.94% Day Change: -1.29 | |
| Week Change: -3.26% Year-to-date Change: -12.4% | |
| APA Links: Profile News Message Board | |
| Charts:- Daily , Weekly | |
| Add APA to Watchlist: View: Get APA Trend Analysis ➞ | |
 | IPG The Interpublic Group of Companies, Inc. |
| Sector: Services & Goods | |
| SubSector: Advertising Agencies | |
| MarketCap: 5730.55 Millions | |
| Recent Price: 30.44 Smart Investing & Trading Score: 8 | |
| Day Percent Change: -3.15% Day Change: -0.99 | |
| Week Change: -3.27% Year-to-date Change: -6.7% | |
| IPG Links: Profile News Message Board | |
| Charts:- Daily , Weekly | |
| Add IPG to Watchlist: View: Get IPG Trend Analysis ➞ | |
 | ROK Rockwell Automation, Inc. |
| Sector: Industrials | |
| SubSector: Diversified Machinery | |
| MarketCap: 15666.1 Millions | |
| Recent Price: 270.96 Smart Investing & Trading Score: 26 | |
| Day Percent Change: -3.22% Day Change: -9.01 | |
| Week Change: -3.27% Year-to-date Change: -12.7% | |
| ROK Links: Profile News Message Board | |
| Charts:- Daily , Weekly | |
| Add ROK to Watchlist: View: Get ROK Trend Analysis ➞ | |
 | CTRA Contura Energy, Inc. |
| Sector: Materials | |
| SubSector: Industrial Metals & Minerals | |
| MarketCap: 75.291 Millions | |
| Recent Price: 27.36 Smart Investing & Trading Score: 74 | |
| Day Percent Change: -3.63% Day Change: -1.03 | |
| Week Change: -3.29% Year-to-date Change: 7.2% | |
| CTRA Links: Profile News Message Board | |
| Charts:- Daily , Weekly | |
| Add CTRA to Watchlist: View: Get CTRA Trend Analysis ➞ | |
 | URI United Rentals, Inc. |
| Sector: Transports | |
| SubSector: Rental & Leasing Services | |
| MarketCap: 6246.64 Millions | |
| Recent Price: 667.99 Smart Investing & Trading Score: 41 | |
| Day Percent Change: -6.27% Day Change: -44.70 | |
| Week Change: -3.3% Year-to-date Change: 16.5% | |
| URI Links: Profile News Message Board | |
| Charts:- Daily , Weekly | |
| Add URI to Watchlist: View: Get URI Trend Analysis ➞ | |
 | MRO Marathon Oil Corporation |
| Sector: Energy | |
| SubSector: Independent Oil & Gas | |
| MarketCap: 2911.53 Millions | |
| Recent Price: 26.85 Smart Investing & Trading Score: 36 | |
| Day Percent Change: -3.90% Day Change: -1.09 | |
| Week Change: -3.31% Year-to-date Change: 11.1% | |
| MRO Links: Profile News Message Board | |
| Charts:- Daily , Weekly | |
| Add MRO to Watchlist: View: Get MRO Trend Analysis ➞ | |
 | MTCH Match Group, Inc. |
| Sector: Technology | |
| SubSector: Internet Information Providers | |
| MarketCap: 14655.8 Millions | |
| Recent Price: 30.82 Smart Investing & Trading Score: 15 | |
| Day Percent Change: -2.24% Day Change: -0.71 | |
| Week Change: -3.34% Year-to-date Change: -15.6% | |
| MTCH Links: Profile News Message Board | |
| Charts:- Daily , Weekly | |
| Add MTCH to Watchlist: View: Get MTCH Trend Analysis ➞ | |
 | AVGO Broadcom Inc. |
| Sector: Technology | |
| SubSector: Semiconductor - Broad Line | |
| MarketCap: 86329.1 Millions | |
| Recent Price: 1299.06 Smart Investing & Trading Score: 56 | |
| Day Percent Change: -2.96% Day Change: -39.56 | |
| Week Change: -3.35% Year-to-date Change: 16.4% | |
| AVGO Links: Profile News Message Board | |
| Charts:- Daily , Weekly | |
| Add AVGO to Watchlist: View: Get AVGO Trend Analysis ➞ | |
 | LRCX Lam Research Corporation |
| Sector: Technology | |
| SubSector: Semiconductor Equipment & Materials | |
| MarketCap: 31806 Millions | |
| Recent Price: 894.21 Smart Investing & Trading Score: 51 | |
| Day Percent Change: -3.73% Day Change: -34.60 | |
| Week Change: -3.37% Year-to-date Change: 14.2% | |
| LRCX Links: Profile News Message Board | |
| Charts:- Daily , Weekly | |
| Add LRCX to Watchlist: View: Get LRCX Trend Analysis ➞ | |
 | IVZ Invesco Ltd. |
| Sector: Financials | |
| SubSector: Asset Management | |
| MarketCap: 4578.23 Millions | |
| Recent Price: 14.17 Smart Investing & Trading Score: 10 | |
| Day Percent Change: -2.01% Day Change: -0.29 | |
| Week Change: -3.41% Year-to-date Change: -20.6% | |
| IVZ Links: Profile News Message Board | |
| Charts:- Daily , Weekly | |
| Add IVZ to Watchlist: View: Get IVZ Trend Analysis ➞ | |
 | VRSN VeriSign, Inc. |
| Sector: Technology | |
| SubSector: Internet Information Providers | |
| MarketCap: 19657 Millions | |
| Recent Price: 169.43 Smart Investing & Trading Score: 0 | |
| Day Percent Change: -3.24% Day Change: -5.68 | |
| Week Change: -3.45% Year-to-date Change: -17.7% | |
| VRSN Links: Profile News Message Board | |
| Charts:- Daily , Weekly | |
| Add VRSN to Watchlist: View: Get VRSN Trend Analysis ➞ | |
 | ABNB Airbnb, Inc. |
| Sector: Technology | |
| SubSector: Internet Content & Information | |
| MarketCap: 86237 Millions | |
| Recent Price: 158.56 Smart Investing & Trading Score: 53 | |
| Day Percent Change: -2.27% Day Change: -3.69 | |
| Week Change: -3.45% Year-to-date Change: 16.5% | |
| ABNB Links: Profile News Message Board | |
| Charts:- Daily , Weekly | |
| Add ABNB to Watchlist: View: Get ABNB Trend Analysis ➞ | |
| For tabular summary view of above stock list: Summary View ➞ 0 - 25 , 25 - 50 , 50 - 75 , 75 - 100 , 100 - 125 , 125 - 150 , 150 - 175 , 175 - 200 , 200 - 225 , 225 - 250 , 250 - 275 , 275 - 300 , 300 - 325 , 325 - 350 , 350 - 375 , 375 - 400 , 400 - 425 , 425 - 450 , 450 - 475 , 475 - 500 | ||
| Click To Change The Sort Order: By Market Cap or Company Size Performance: Year-to-date, Week and Day | |
| Select Chart Type: | ||
|
Best Stocks Today 12Stocks.com |
© 2024 12Stocks.com Terms & Conditions Privacy Contact Us
All Information Provided Only For Education And Not To Be Used For Investing or Trading. See Terms & Conditions


One More Thing ... Get Best Stocks Delivered Daily!
Never Ever Miss A Move With Our Top Ten Stocks Lists
Find Best Stocks In Any Market - Bull or Bear Market
Take A Peek At Our Top Ten Stocks Lists: Daily, Weekly, Year-to-Date & Top Trends
Find Best Stocks In Any Market - Bull or Bear Market
Take A Peek At Our Top Ten Stocks Lists: Daily, Weekly, Year-to-Date & Top Trends
S&P 500 Stocks With Best Up Trends [0-bearish to 100-bullish]: Leidos Holdings[100], Corning [100], Zebra Technologies[100], 3M [100], NXP Semiconductors[100], Campbell Soup[100], Mosaic [100], Colgate-Palmolive [100], PayPal Holdings[100], Federal Realty[100], Hershey [100]
Best S&P 500 Stocks Year-to-Date:
NVIDIA [74.5%], Constellation [58.77%], NRG [40.56%], Chipotle Mexican[38.16%], Western Digital[35.42%], Eli Lilly[34%], DaVita [32.69%], Micron [32.41%], Eaton [32.16%], Targa Resources[31.3%], Progressive [30.74%] Best S&P 500 Stocks This Week:
Tesla [8.94%], Leidos Holdings[7.56%], Corning [6.54%], Eli Lilly[6.49%], Domino s[6.05%], Zebra Technologies[5.76%], NXP Semiconductors[5.5%], 3M [5.1%], Cincinnati Financial[4.31%], Hershey [4.17%], DaVita [4.12%] Best S&P 500 Stocks Daily:
Leidos Holdings[6.53%], Eli Lilly[5.95%], Corning [5.03%], Zebra Technologies[4.78%], ProShares UltraPro[4.78%], 3M [4.72%], NXP Semiconductors[3.61%], Arch Capital[2.49%], Ecolab [2.02%], Cincinnati Financial[1.86%], Campbell Soup[1.74%]