
 Login Sign Up


| |||||
 |  | ||||

| 12Stocks.com Market Intelligence |
Best S&P 500 Stocks
|
On this page, you will find the most comprehensive analysis of S&P 500 stocks and ETFs - from latest trends to performances to charts ➞. First, here are the year-to-date (YTD) performances of the most requested S&P 500 stocks at 12Stocks.com (click stock for review):
| NVIDIA 73% | ||
| Amazon.com 22% | ||
| Google 19% | ||
| Merck 18% | ||
| Walmart 14% | ||
| Caterpillar 13% | ||
| JPMorgan Chase 13% | ||
| Goldman Sachs 12% | ||
| Chevron 8% | ||
| Microsoft 6% | ||
| Johnson & Johnson -4% | ||
| McDonald s -8% | ||
| Apple -10% | ||
| Gilead -19% | ||
| Starbucks -22% | ||
| Boeing -31% | ||
| Intel -39% | ||
| Quick: S&P 500 Stocks Lists: Performances & Trends, S&P 500 Stock Charts
Sort S&P 500 stocks: Daily, Weekly, Year-to-Date, Market Cap & Trends. Filter S&P 500 stocks list by sector: Show all, Tech, Finance, Energy, Staples, Retail, Industrial, Materials, Utilities and HealthCare |
| 12Stocks.com S&P 500 Stocks Performances & Trends Daily Report | |||||||||
|
| 
The overall Smart Investing & Trading Score is 30 (0-bearish to 100-bullish) which puts S&P 500 index in short term bearish to neutral trend. The Smart Investing & Trading Score from previous trading session is 7 and hence an improvement of trend. | ||||||||
Here are the Smart Investing & Trading Scores of the most requested S&P 500 stocks at 12Stocks.com (click stock name for detailed review):
|


| 12Stocks.com: Top Performing S&P 500 Index Stocks | ||||||||||||||||||||||||||||||||||||||||||||||||
 The top performing S&P 500 Index stocks year to date are
Now, more recently, over last week, the top performing S&P 500 Index stocks on the move are


|
||||||||||||||||||||||||||||||||||||||||||||||||
| 12Stocks.com: Investing in S&P 500 Index with Stocks | |
|
The following table helps investors and traders sort through current performance and trends (as measured by Smart Investing & Trading Score) of various
stocks in the S&P 500 Index. Quick View: Move mouse or cursor over stock symbol (ticker) to view short-term technical chart and over stock name to view long term chart. Click on  to add stock symbol to your watchlist and to add stock symbol to your watchlist and  to view watchlist. Click on any ticker or stock name for detailed market intelligence report for that stock. to view watchlist. Click on any ticker or stock name for detailed market intelligence report for that stock. |
12Stocks.com Performance of Stocks in S&P 500 Index
| Ticker | Stock Name | Watchlist | Category | Recent Price | Smart Investing & Trading Score | Change % | Weekly Change% |
| ABBV | AbbVie |   | Health Care | 160.81 | 8 | -0.56% | 0.75% |
| CTLT | Catalent | | Health Care | 56.34 | 49 | 0.61% | 0.75% |
| LW | Lamb Weston | | Consumer Staples | 84.48 | 57 | 2.75% | 0.75% |
| CARR | Carrier Global | | Industrials | 60.94 | 63 | -0.29% | 0.73% |
| PRU | Prudential Financial | | Financials | 111.29 | 68 | -0.90% | 0.71% |
| MMC | Marsh & McLennan | | Financials | 199.36 | 25 | -0.21% | 0.71% |
| HCA | HCA Healthcare | | Health Care | 308.84 | 17 | -0.19% | 0.70% |
| NFLX | Netflix | | Technology | 565.15 | 32 | 2.44% | 0.70% |
| VRTX | Vertex | | Health Care | 400.16 | 57 | -0.49% | 0.67% |
| DE | Deere & | | Industrials | 395.96 | 61 | 2.18% | 0.67% |
| EQR | Equity Residential | | Financials | 65.56 | 93 | 2.37% | 0.64% |
| ETR | Entergy | | Utilities | 107.16 | 68 | 0.17% | 0.62% |
| ISRG | Intuitive Surgical | | Health Care | 377.65 | 25 | 1.60% | 0.62% |
| BR | Broadridge Financial | | Technology | 195.35 | 35 | 0.99% | 0.62% |
| LEN | Lennar | | Industrials | 155.21 | 18 | 1.80% | 0.60% |
| BLDR | Builders FirstSource | | Industrials | 188.74 | 39 | 2.36% | 0.58% |
| TMUS | T-Mobile US | | Technology | 164.91 | 73 | -0.34% | 0.58% |
| AZO | AutoZone | | Services & Goods | 2962.09 | 25 | 0.52% | 0.55% |
| EXPD | Expeditors | | Transports | 113.91 | 35 | 1.71% | 0.54% |
| ODFL | Old Dominion | | Transports | 183.40 | 35 | 0.50% | 0.54% |
| TSN | Tyson Foods | | Consumer Staples | 60.95 | 70 | 1.09% | 0.53% |
| AVB | AvalonBay Communities | | Financials | 192.45 | 93 | 2.41% | 0.52% |
| AFL | Aflac | | Financials | 84.04 | 59 | -0.63% | 0.51% |
| PGR | Progressive | | Financials | 209.03 | 61 | -1.31% | 0.48% |
| EFX | Equifax | | Financials | 224.50 | 18 | 1.74% | 0.48% |
| For chart view version of above stock list: Chart View ➞ 0 - 25 , 25 - 50 , 50 - 75 , 75 - 100 , 100 - 125 , 125 - 150 , 150 - 175 , 175 - 200 , 200 - 225 , 225 - 250 , 250 - 275 , 275 - 300 , 300 - 325 , 325 - 350 , 350 - 375 , 375 - 400 , 400 - 425 , 425 - 450 , 450 - 475 , 475 - 500 | ||
 | Click To Change The Sort Order: By Market Cap or Company Size Performance: Year-to-date, Week and Day |  |
|
Get the most comprehensive stock market coverage daily at 12Stocks.com ➞ Best Stocks Today ➞ Best Stocks Weekly ➞ Best Stocks Year-to-Date ➞ Best Stocks Trends ➞  Best Stocks Today 12Stocks.com Best Nasdaq Stocks ➞ Best S&P 500 Stocks ➞ Best Tech Stocks ➞ Best Biotech Stocks ➞ |
| Detailed Overview of S&P 500 Stocks |
| S&P 500 Technical Overview, Leaders & Laggards, Top S&P 500 ETF Funds & Detailed S&P 500 Stocks List, Charts, Trends & More |
| S&P 500: Technical Analysis, Trends & YTD Performance | |
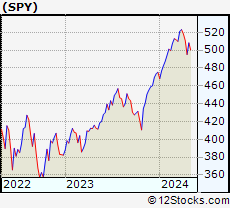
| S&P 500 index as represented by
SPY, an exchange-traded fund [ETF], holds basket of five hundred (mostly largecap) stocks from across all major sectors of the US stock market. The S&P 500 index (contains stocks like Apple and Exxon) is up by 6.25% and is currently outperforming the overall market by 0.63% year-to-date. Below is a quick view of technical charts and trends: | |
 SPY Weekly Chart |
|
| Long Term Trend: Not Good | |
| Medium Term Trend: Not Good | |
 SPY Daily Chart |
|
| Short Term Trend: Deteriorating | |
| Overall Trend Score: 30 | |
| YTD Performance: 6.25% | |
| **Trend Scores & Views Are Only For Educational Purposes And Not For Investing | |
| 12Stocks.com: Investing in S&P 500 Index using Exchange Traded Funds | |
|
The following table shows list of key exchange traded funds (ETF) that
help investors track S&P 500 index. The following list also includes leveraged ETF funds that track twice or thrice the daily returns of S&P 500 indices. Short or inverse ETF funds move in the opposite direction to the index they track and are useful during market pullbacks or during bear markets. Quick View: Move mouse or cursor over ETF symbol (ticker) to view short-term technical chart and over ETF name to view long term chart. Click on ticker or stock name for detailed view. Click on to add stock symbol to your watchlist and to view watchlist. |
12Stocks.com List of ETFs that track S&P 500 Index
| Ticker | ETF Name | Watchlist | Recent Price | Smart Investing & Trading Score | Change % | Week % | Year-to-date % |
| SPY | SPDR S&P 500 ETF | | 505.03 | 30 | 0.94 | -0.64 | 6.25% |
| IVV | iShares Core S&P 500 ETF | | 507.46 | 30 | 0.91 | -0.65 | 6.25% |
| VOO | Vanguard 500 ETF | | 464.22 | 30 | 0.93 | -0.64 | 6.28% |
| OEF | iShares S&P 100 | | 240.23 | 30 | 1.16 | -0.55 | 7.54% |
| SSO | ProShares Ultra S&P500 | | 71.66 | 17 | 1.80 | -1.44 | 10.13% |
| UPRO | ProShares UltraPro S&P500 | | 62.37 | 17 | 2.75 | -2.27 | 13.94% |
| SPXL | Direxion Daily S&P500 Bull 3X ETF | | 118.44 | 17 | 2.68 | -2.23 | 13.9% |
| SH | ProShares Short S&P500 | | 12.38 | 70 | -0.88 | 0.81 | -4.7% |
| SDS | ProShares UltraShort S&P500 | | 26.90 | 83 | -1.82 | 1.39 | -10.09% |
| SPXU | ProShares UltraPro Short S&P500 | | 36.26 | 78 | -2.55 | 2.14 | -15.67% |
| SPXS | Direxion Daily S&P 500 Bear 3X ETF | | 9.81 | 78 | -2.58 | 2.08 | -15.06% |
| 12Stocks.com: Charts, Trends, Fundamental Data and Performances of S&P 500 Stocks | |
|
We now take in-depth look at all S&P 500 stocks including charts, multi-period performances and overall trends (as measured by Smart Investing & Trading Score). One can sort S&P 500 stocks (click link to choose) by Daily, Weekly and by Year-to-Date performances. Also, one can sort by size of the company or by market capitalization. |
| Select Your Default Chart Type: | |||||
| |||||
| Click on stock symbol or name for detailed view. Click on to add stock symbol to your watchlist and to view watchlist. Quick View: Move mouse or cursor over "Daily" to quickly view daily technical stock chart and over "Weekly" to view weekly technical stock chart. | |||||

 | ABBV AbbVie Inc. |
| Sector: Health Care | |
| SubSector: Drug Manufacturers - Major | |
| MarketCap: 110080 Millions | |
| Recent Price: 160.81 Smart Investing & Trading Score: 8 | |
| Day Percent Change: -0.56% Day Change: -0.91 | |
| Week Change: 0.75% Year-to-date Change: 3.8% | |
| ABBV Links: Profile News Message Board | |
| Charts:- Daily , Weekly | |
| Add ABBV to Watchlist: View: Get ABBV Trend Analysis ➞ | |
 | CTLT Catalent, Inc. |
| Sector: Health Care | |
| SubSector: Drugs - Generic | |
| MarketCap: 6351.95 Millions | |
| Recent Price: 56.34 Smart Investing & Trading Score: 49 | |
| Day Percent Change: 0.61% Day Change: 0.34 | |
| Week Change: 0.75% Year-to-date Change: 25.4% | |
| CTLT Links: Profile News Message Board | |
| Charts:- Daily , Weekly | |
| Add CTLT to Watchlist: View: Get CTLT Trend Analysis ➞ | |
 | LW Lamb Weston Holdings, Inc. |
| Sector: Consumer Staples | |
| SubSector: Food - Major Diversified | |
| MarketCap: 7844.63 Millions | |
| Recent Price: 84.48 Smart Investing & Trading Score: 57 | |
| Day Percent Change: 2.75% Day Change: 2.26 | |
| Week Change: 0.75% Year-to-date Change: -21.8% | |
| LW Links: Profile News Message Board | |
| Charts:- Daily , Weekly | |
| Add LW to Watchlist: View: Get LW Trend Analysis ➞ | |
 | CARR Carrier Global Corporation |
| Sector: Industrials | |
| SubSector: Building Products & Equipment | |
| MarketCap: 32547 Millions | |
| Recent Price: 60.94 Smart Investing & Trading Score: 63 | |
| Day Percent Change: -0.29% Day Change: -0.18 | |
| Week Change: 0.73% Year-to-date Change: 6.1% | |
| CARR Links: Profile News Message Board | |
| Charts:- Daily , Weekly | |
| Add CARR to Watchlist: View: Get CARR Trend Analysis ➞ | |
 | PRU Prudential Financial, Inc. |
| Sector: Financials | |
| SubSector: Life Insurance | |
| MarketCap: 21001.6 Millions | |
| Recent Price: 111.29 Smart Investing & Trading Score: 68 | |
| Day Percent Change: -0.90% Day Change: -1.01 | |
| Week Change: 0.71% Year-to-date Change: 7.3% | |
| PRU Links: Profile News Message Board | |
| Charts:- Daily , Weekly | |
| Add PRU to Watchlist: View: Get PRU Trend Analysis ➞ | |
 | MMC Marsh & McLennan Companies, Inc. |
| Sector: Financials | |
| SubSector: Insurance Brokers | |
| MarketCap: 42821.8 Millions | |
| Recent Price: 199.36 Smart Investing & Trading Score: 25 | |
| Day Percent Change: -0.21% Day Change: -0.41 | |
| Week Change: 0.71% Year-to-date Change: 5.2% | |
| MMC Links: Profile News Message Board | |
| Charts:- Daily , Weekly | |
| Add MMC to Watchlist: View: Get MMC Trend Analysis ➞ | |
 | HCA HCA Healthcare, Inc. |
| Sector: Health Care | |
| SubSector: Hospitals | |
| MarketCap: 29466.6 Millions | |
| Recent Price: 308.84 Smart Investing & Trading Score: 17 | |
| Day Percent Change: -0.19% Day Change: -0.60 | |
| Week Change: 0.7% Year-to-date Change: 14.1% | |
| HCA Links: Profile News Message Board | |
| Charts:- Daily , Weekly | |
| Add HCA to Watchlist: View: Get HCA Trend Analysis ➞ | |
 | NFLX Netflix, Inc. |
| Sector: Technology | |
| SubSector: CATV Systems | |
| MarketCap: 162108 Millions | |
| Recent Price: 565.15 Smart Investing & Trading Score: 32 | |
| Day Percent Change: 2.44% Day Change: 13.44 | |
| Week Change: 0.7% Year-to-date Change: 16.1% | |
| NFLX Links: Profile News Message Board | |
| Charts:- Daily , Weekly | |
| Add NFLX to Watchlist: View: Get NFLX Trend Analysis ➞ | |
 | VRTX Vertex Pharmaceuticals Incorporated |
| Sector: Health Care | |
| SubSector: Biotechnology | |
| MarketCap: 57669.6 Millions | |
| Recent Price: 400.16 Smart Investing & Trading Score: 57 | |
| Day Percent Change: -0.49% Day Change: -1.98 | |
| Week Change: 0.67% Year-to-date Change: -1.7% | |
| VRTX Links: Profile News Message Board | |
| Charts:- Daily , Weekly | |
| Add VRTX to Watchlist: View: Get VRTX Trend Analysis ➞ | |
 | DE Deere & Company |
| Sector: Industrials | |
| SubSector: Farm & Construction Machinery | |
| MarketCap: 39168.7 Millions | |
| Recent Price: 395.96 Smart Investing & Trading Score: 61 | |
| Day Percent Change: 2.18% Day Change: 8.46 | |
| Week Change: 0.67% Year-to-date Change: -1.0% | |
| DE Links: Profile News Message Board | |
| Charts:- Daily , Weekly | |
| Add DE to Watchlist: View: Get DE Trend Analysis ➞ | |
 | EQR Equity Residential |
| Sector: Financials | |
| SubSector: REIT - Residential | |
| MarketCap: 22061.9 Millions | |
| Recent Price: 65.56 Smart Investing & Trading Score: 93 | |
| Day Percent Change: 2.37% Day Change: 1.52 | |
| Week Change: 0.64% Year-to-date Change: 7.2% | |
| EQR Links: Profile News Message Board | |
| Charts:- Daily , Weekly | |
| Add EQR to Watchlist: View: Get EQR Trend Analysis ➞ | |
 | ETR Entergy Corporation |
| Sector: Utilities | |
| SubSector: Electric Utilities | |
| MarketCap: 17545 Millions | |
| Recent Price: 107.16 Smart Investing & Trading Score: 68 | |
| Day Percent Change: 0.17% Day Change: 0.18 | |
| Week Change: 0.62% Year-to-date Change: 5.9% | |
| ETR Links: Profile News Message Board | |
| Charts:- Daily , Weekly | |
| Add ETR to Watchlist: View: Get ETR Trend Analysis ➞ | |
 | ISRG Intuitive Surgical, Inc. |
| Sector: Health Care | |
| SubSector: Medical Instruments & Supplies | |
| MarketCap: 50917.5 Millions | |
| Recent Price: 377.65 Smart Investing & Trading Score: 25 | |
| Day Percent Change: 1.60% Day Change: 5.95 | |
| Week Change: 0.62% Year-to-date Change: 11.9% | |
| ISRG Links: Profile News Message Board | |
| Charts:- Daily , Weekly | |
| Add ISRG to Watchlist: View: Get ISRG Trend Analysis ➞ | |
 | BR Broadridge Financial Solutions, Inc. |
| Sector: Technology | |
| SubSector: Information Technology Services | |
| MarketCap: 10633.8 Millions | |
| Recent Price: 195.35 Smart Investing & Trading Score: 35 | |
| Day Percent Change: 0.99% Day Change: 1.92 | |
| Week Change: 0.62% Year-to-date Change: -5.1% | |
| BR Links: Profile News Message Board | |
| Charts:- Daily , Weekly | |
| Add BR to Watchlist: View: Get BR Trend Analysis ➞ | |
 | LEN Lennar Corporation |
| Sector: Industrials | |
| SubSector: Residential Construction | |
| MarketCap: 11926.6 Millions | |
| Recent Price: 155.21 Smart Investing & Trading Score: 18 | |
| Day Percent Change: 1.80% Day Change: 2.74 | |
| Week Change: 0.6% Year-to-date Change: 4.1% | |
| LEN Links: Profile News Message Board | |
| Charts:- Daily , Weekly | |
| Add LEN to Watchlist: View: Get LEN Trend Analysis ➞ | |
 | BLDR Builders FirstSource, Inc. |
| Sector: Industrials | |
| SubSector: General Building Materials | |
| MarketCap: 1714.63 Millions | |
| Recent Price: 188.74 Smart Investing & Trading Score: 39 | |
| Day Percent Change: 2.36% Day Change: 4.35 | |
| Week Change: 0.58% Year-to-date Change: 13.1% | |
| BLDR Links: Profile News Message Board | |
| Charts:- Daily , Weekly | |
| Add BLDR to Watchlist: View: Get BLDR Trend Analysis ➞ | |
 | TMUS T-Mobile US, Inc. |
| Sector: Technology | |
| SubSector: Wireless Communications | |
| MarketCap: 71949 Millions | |
| Recent Price: 164.91 Smart Investing & Trading Score: 73 | |
| Day Percent Change: -0.34% Day Change: -0.56 | |
| Week Change: 0.58% Year-to-date Change: 2.9% | |
| TMUS Links: Profile News Message Board | |
| Charts:- Daily , Weekly | |
| Add TMUS to Watchlist: View: Get TMUS Trend Analysis ➞ | |
 | AZO AutoZone, Inc. |
| Sector: Services & Goods | |
| SubSector: Auto Parts Stores | |
| MarketCap: 19128 Millions | |
| Recent Price: 2962.09 Smart Investing & Trading Score: 25 | |
| Day Percent Change: 0.52% Day Change: 15.28 | |
| Week Change: 0.55% Year-to-date Change: 14.6% | |
| AZO Links: Profile News Message Board | |
| Charts:- Daily , Weekly | |
| Add AZO to Watchlist: View: Get AZO Trend Analysis ➞ | |
 | EXPD Expeditors International of Washington, Inc. |
| Sector: Transports | |
| SubSector: Air Delivery & Freight Services | |
| MarketCap: 10129.8 Millions | |
| Recent Price: 113.91 Smart Investing & Trading Score: 35 | |
| Day Percent Change: 1.71% Day Change: 1.92 | |
| Week Change: 0.54% Year-to-date Change: -10.5% | |
| EXPD Links: Profile News Message Board | |
| Charts:- Daily , Weekly | |
| Add EXPD to Watchlist: View: Get EXPD Trend Analysis ➞ | |
 | ODFL Old Dominion Freight Line, Inc. |
| Sector: Transports | |
| SubSector: Trucking | |
| MarketCap: 14457.5 Millions | |
| Recent Price: 183.40 Smart Investing & Trading Score: 35 | |
| Day Percent Change: 0.50% Day Change: 0.91 | |
| Week Change: 0.54% Year-to-date Change: -54.8% | |
| ODFL Links: Profile News Message Board | |
| Charts:- Daily , Weekly | |
| Add ODFL to Watchlist: View: Get ODFL Trend Analysis ➞ | |
 | TSN Tyson Foods, Inc. |
| Sector: Consumer Staples | |
| SubSector: Meat Products | |
| MarketCap: 22124.1 Millions | |
| Recent Price: 60.95 Smart Investing & Trading Score: 70 | |
| Day Percent Change: 1.09% Day Change: 0.66 | |
| Week Change: 0.53% Year-to-date Change: 13.4% | |
| TSN Links: Profile News Message Board | |
| Charts:- Daily , Weekly | |
| Add TSN to Watchlist: View: Get TSN Trend Analysis ➞ | |
 | AVB AvalonBay Communities, Inc. |
| Sector: Financials | |
| SubSector: REIT - Residential | |
| MarketCap: 19921.9 Millions | |
| Recent Price: 192.45 Smart Investing & Trading Score: 93 | |
| Day Percent Change: 2.41% Day Change: 4.52 | |
| Week Change: 0.52% Year-to-date Change: 2.8% | |
| AVB Links: Profile News Message Board | |
| Charts:- Daily , Weekly | |
| Add AVB to Watchlist: View: Get AVB Trend Analysis ➞ | |
 | AFL Aflac Incorporated |
| Sector: Financials | |
| SubSector: Accident & Health Insurance | |
| MarketCap: 22706 Millions | |
| Recent Price: 84.04 Smart Investing & Trading Score: 59 | |
| Day Percent Change: -0.63% Day Change: -0.53 | |
| Week Change: 0.51% Year-to-date Change: 1.9% | |
| AFL Links: Profile News Message Board | |
| Charts:- Daily , Weekly | |
| Add AFL to Watchlist: View: Get AFL Trend Analysis ➞ | |
 | PGR The Progressive Corporation |
| Sector: Financials | |
| SubSector: Property & Casualty Insurance | |
| MarketCap: 43112 Millions | |
| Recent Price: 209.03 Smart Investing & Trading Score: 61 | |
| Day Percent Change: -1.31% Day Change: -2.77 | |
| Week Change: 0.48% Year-to-date Change: 31.2% | |
| PGR Links: Profile News Message Board | |
| Charts:- Daily , Weekly | |
| Add PGR to Watchlist: View: Get PGR Trend Analysis ➞ | |
 | EFX Equifax Inc. |
| Sector: Financials | |
| SubSector: Credit Services | |
| MarketCap: 13754.6 Millions | |
| Recent Price: 224.50 Smart Investing & Trading Score: 18 | |
| Day Percent Change: 1.74% Day Change: 3.83 | |
| Week Change: 0.48% Year-to-date Change: -9.2% | |
| EFX Links: Profile News Message Board | |
| Charts:- Daily , Weekly | |
| Add EFX to Watchlist: View: Get EFX Trend Analysis ➞ | |
| For tabular summary view of above stock list: Summary View ➞ 0 - 25 , 25 - 50 , 50 - 75 , 75 - 100 , 100 - 125 , 125 - 150 , 150 - 175 , 175 - 200 , 200 - 225 , 225 - 250 , 250 - 275 , 275 - 300 , 300 - 325 , 325 - 350 , 350 - 375 , 375 - 400 , 400 - 425 , 425 - 450 , 450 - 475 , 475 - 500 | ||
| Click To Change The Sort Order: By Market Cap or Company Size Performance: Year-to-date, Week and Day | |
| Select Chart Type: | ||
|
Best Stocks Today 12Stocks.com |
© 2024 12Stocks.com Terms & Conditions Privacy Contact Us
All Information Provided Only For Education And Not To Be Used For Investing or Trading. See Terms & Conditions


One More Thing ... Get Best Stocks Delivered Daily!
Never Ever Miss A Move With Our Top Ten Stocks Lists
Find Best Stocks In Any Market - Bull or Bear Market
Take A Peek At Our Top Ten Stocks Lists: Daily, Weekly, Year-to-Date & Top Trends
Find Best Stocks In Any Market - Bull or Bear Market
Take A Peek At Our Top Ten Stocks Lists: Daily, Weekly, Year-to-Date & Top Trends
S&P 500 Stocks With Best Up Trends [0-bearish to 100-bullish]: Moderna [100], C.H. Robinson[100], QUALCOMM [100], BorgWarner [100], Kellogg [100], WestRock [100], Ventas [100], AES [100], Xylem [100], Flavors[100], Synchrony Financial[100]
Best S&P 500 Stocks Year-to-Date:
NVIDIA [73.29%], Constellation [58.62%], NRG [45.32%], Chipotle Mexican[37.39%], DaVita [35.78%], Western Digital[33.13%], Leidos Holdings[31.8%], Micron [31.63%], Progressive [31.23%], Eaton [30.92%], Targa Resources[30.07%] Best S&P 500 Stocks This Week:
Bio-Techne [18.01%], Moderna [16.32%], C.H. Robinson[15.25%], Garmin [15.25%], Amcor [10.03%], AES [9.99%], Leidos Holdings[9.44%], Aptiv [9.24%], Pfizer [9.06%], QUALCOMM [8.72%], WestRock [8.17%] Best S&P 500 Stocks Daily:
Moderna [12.68%], C.H. Robinson[12.26%], Aptiv [11.53%], QUALCOMM [9.74%], Monolithic Power[9.24%], BorgWarner [8.40%], Kellogg [7.55%], WestRock [6.70%], Estee Lauder[5.94%], Corteva [5.69%], Zoetis [5.51%]