
 Login Sign Up


| |||||
 |  | ||||

| 12Stocks.com Market Intelligence |
Best China Stocks
|
On this page, you will find the most comprehensive analysis of Chinese stocks and ETFs - from latest trends to performances to charts ➞. First, here are the year-to-date (YTD) performances of the most requested China stocks at 12Stocks.com (click stock for review):
| Sohu.com 19% | ||
| JD.com 13% | ||
| New Oriental 10% | ||
| NetEase 6% | ||
| Alibaba 4% | ||
| Baidu -6% | ||
| Vipshop -10% | ||
| JOYY -15% | ||
| Weibo -15% | ||
| In a hurry? China Stocks Lists: Performance Trends Table, Stock Charts
Sort China stocks: Daily, Weekly, Year-to-Date, Market Cap & Trends. Filter China stocks list by sector: Show all, Tech, Finance, Energy, Staples, Retail, Industrial, Materials, Utilities and HealthCare Filter China stocks list by size: All China Large Medium Small and MicroCap |
| May 3, 2024 - 12Stocks.com China Stocks Performances & Trends Daily | |||||||||
|
|  The overall Smart Investing & Trading Score is 100 (0-bearish to 100-bullish) which puts China index in short term bullish trend. The Smart Investing & Trading Score from previous trading session is 83 and hence an improvement of trend.
| ||||||||
| Here are the Smart Investing & Trading Scores of the most requested China stocks at 12Stocks.com (click stock name for detailed review): |

| 12Stocks.com: Top Performing China Index Stocks | ||||||||||||||||||||||||||||||||||||||||||||||||
 The top performing China Index stocks year to date are
Now, more recently, over last week, the top performing China Index stocks on the move are


|
||||||||||||||||||||||||||||||||||||||||||||||||
| 12Stocks.com: Investing in China Index with Stocks | |
|
The following table helps investors and traders sort through current performance and trends (as measured by Smart Investing & Trading Score) of various
stocks in the China Index. Quick View: Move mouse or cursor over stock symbol (ticker) to view short-term technical chart and over stock name to view long term chart. Click on  to add stock symbol to your watchlist and to add stock symbol to your watchlist and  to view watchlist. Click on any ticker or stock name for detailed market intelligence report for that stock. to view watchlist. Click on any ticker or stock name for detailed market intelligence report for that stock. |
12Stocks.com Performance of Stocks in China Index
| Ticker | Stock Name | Watchlist | Category | Recent Price | Smart Investing & Trading Score | Change % | YTD Change% |
| TUYA | Tuya |   | Technology | 1.78 | 64 | 2.59% | -22.22% |
| API | Agora | | Technology | 2.56 | 57 | 1.79% | -2.84% |
| HYW | Hywin | | Financials | 0.81 | 37 | 3.66% | -56.38% |
| WDH | Waterdrop | | Financials | 1.19 | 28 | 2.16% | 13.18% |
| BQ | Boqii Holding | | Services & Goods | 0.33 | 90 | 10.40% | -27.62% |
| AIH | Aesthetic Medical | | Health Care | 0.45 | 37 | 5.96% | -34.28% |
| DAO | Youdao | | Technology | 3.56 | 37 | 0.85% | -9.64% |
| HOLO | MicroCloud Hologram | | Technology | 2.56 | 37 | 0.59% | 635.25% |
| THCH | TH | | Services & Goods | 1.09 | 17 | 1.40% | -37.36% |
| WIMI | WiMi Hologram | | Technology | 0.95 | 30 | 2.08% | 18.19% |
| IH | iHuman | | Consumer Staples | 1.75 | 57 | 1.16% | -42.62% |
| KRKR | 36Kr | | Technology | 0.37 | 17 | 5.37% | -34.09% |
| AGMH | AGM | | Technology | 1.08 | 25 | 1.89% | -40.33% |
| CANG | Cango | | Technology | 1.48 | 37 | 1.37% | 45.10% |
| BEST | BEST | | Consumer Staples | 2.13 | 17 | 0.95% | -16.52% |
| UTSI | UTStarcom | | Technology | 2.69 | 20 | 0.37% | -21.80% |
| SFWL | Shengfeng Development | | Industrials | 1.74 | 85 | 0.58% | -36.73% |
| LKCO | Luokung | | Technology | 0.49 | 7 | 2.33% | -0.41% |
| QD | Qudian | | Technology | 2.41 | 22 | 0.42% | 18.14% |
| COE | China Online | | Services & Goods | 7.01 | 73 | 0.14% | -12.71% |
| SY | So-Young | | Technology | 1.29 | 73 | 0.78% | 0.00% |
| ZH | Zhihu | | Services & Goods | 0.66 | 29 | 0.39% | -29.84% |
| YQ | 17 Education | | Consumer Staples | 2.62 | 22 | 0.00% | 28.43% |
| EDTK | Skillful Craftsman | | Consumer Staples | 0.95 | 63 | 0.00% | -24.98% |
| CLEU | China Liberal | | Consumer Staples | 1.05 | 25 | 0.00% | 487.25% |
| For chart view version of above stock list: Chart View ➞ 0 - 25 , 25 - 50 , 50 - 75 , 75 - 100 , 100 - 125 , 125 - 150 | ||
 | Click To Change The Sort Order: By Market Cap or Company Size Performance: Year-to-date, Week and Day |  |
|
Get the most comprehensive stock market coverage daily at 12Stocks.com ➞ Best Stocks Today ➞ Best Stocks Weekly ➞ Best Stocks Year-to-Date ➞ Best Stocks Trends ➞  Best Stocks Today 12Stocks.com Best Nasdaq Stocks ➞ Best S&P 500 Stocks ➞ Best Tech Stocks ➞ Best Biotech Stocks ➞ |
| Detailed Overview of China Stocks |
| China Technical Overview, Leaders & Laggards, Top China ETF Funds & Detailed China Stocks List, Charts, Trends & More |
| China: Technical Analysis, Trends & YTD Performance | |
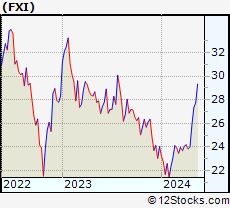
 FXI Weekly Chart |
|
| Long Term Trend: Very Good | |
| Medium Term Trend: Very Good | |
 FXI Daily Chart |
|
| Short Term Trend: Very Good | |
| Overall Trend Score: 100 | |
| YTD Performance: 12.98% | |
| **Trend Scores & Views Are Only For Educational Purposes And Not For Investing | |
| 12Stocks.com: Investing in China Index using Exchange Traded Funds | |
|
The following table shows list of key exchange traded funds (ETF) that
help investors play China stock market. For detailed view, check out our ETF Funds section of our website. Quick View: Move mouse or cursor over ETF symbol (ticker) to view short-term technical chart and over ETF name to view long term chart. Click on ticker or stock name for detailed view. Click on to add stock symbol to your watchlist and to view watchlist. |
12Stocks.com List of ETFs that track China Index
| Ticker | ETF Name | Watchlist | Recent Price | Smart Investing & Trading Score | Change % | Week % | Year-to-date % |
| FXI | China Large-Cap | | 27.15 | 100 | 5.72 | 4.95 | 12.98% |
| EWH | Hong Kong | | 16.79 | 100 | 4.09 | 5.07 | -3.34% |
| YINN | China Bull 3X | | 26.39 | 100 | 16.46 | 13.7 | 26.03% |
| YANG | China Bear 3X | | 7.95 | 0 | -16.40 | -14.88 | -37.89% |
| XPP | China 50 | | 16.37 | 100 | 10.64 | 8.92 | 19.1% |
| MCHI | China | | 44.47 | 100 | 5.45 | 5.01 | 9.16% |
| GXC | China | | 72.73 | 100 | 5.09 | 4.74 | 6.77% |
| CBON | ChinaAMC China Bond | | 21.98 | 65 | 0.41 | 0.64 | -0.54% |
| 12Stocks.com: Charts, Trends, Fundamental Data and Performances of China Stocks | |
|
We now take in-depth look at all China stocks including charts, multi-period performances and overall trends (as measured by Smart Investing & Trading Score). One can sort China stocks (click link to choose) by Daily, Weekly and by Year-to-Date performances. Also, one can sort by size of the company or by market capitalization. |
| Select Your Default Chart Type: | |||||
| |||||
| Click on stock symbol or name for detailed view. Click on to add stock symbol to your watchlist and to view watchlist. Quick View: Move mouse or cursor over "Daily" to quickly view daily technical stock chart and over "Weekly" to view weekly technical stock chart. | |||||

 | TUYA Tuya Inc. |
| Sector: Technology | |
| SubSector: Software - Infrastructure | |
| MarketCap: 1050 Millions | |
| Recent Price: 1.78 Smart Investing & Trading Score: 64 | |
| Day Percent Change: 2.59% Day Change: 0.04 | |
| Week Change: 2.59% Year-to-date Change: -22.2% | |
| TUYA Links: Profile News Message Board | |
| Charts:- Daily , Weekly | |
| Add TUYA to Watchlist: View: Get Complete TUYA Trend Analysis ➞ | |
 | API Agora, Inc. |
| Sector: Technology | |
| SubSector: Software Application | |
| MarketCap: 42787 Millions | |
| Recent Price: 2.56 Smart Investing & Trading Score: 57 | |
| Day Percent Change: 1.79% Day Change: 0.04 | |
| Week Change: 1.79% Year-to-date Change: -2.8% | |
| API Links: Profile News Message Board | |
| Charts:- Daily , Weekly | |
| Add API to Watchlist: View: Get Complete API Trend Analysis ➞ | |
 | HYW Hywin Holdings Ltd. |
| Sector: Financials | |
| SubSector: Asset Management | |
| MarketCap: 161 Millions | |
| Recent Price: 0.81 Smart Investing & Trading Score: 37 | |
| Day Percent Change: 3.66% Day Change: 0.03 | |
| Week Change: -4.77% Year-to-date Change: -56.4% | |
| HYW Links: Profile News Message Board | |
| Charts:- Daily , Weekly | |
| Add HYW to Watchlist: View: Get Complete HYW Trend Analysis ➞ | |
 | WDH Waterdrop Inc. |
| Sector: Financials | |
| SubSector: Insurance - Diversified | |
| MarketCap: 874 Millions | |
| Recent Price: 1.19 Smart Investing & Trading Score: 28 | |
| Day Percent Change: 2.16% Day Change: 0.03 | |
| Week Change: -1.25% Year-to-date Change: 13.2% | |
| WDH Links: Profile News Message Board | |
| Charts:- Daily , Weekly | |
| Add WDH to Watchlist: View: Get Complete WDH Trend Analysis ➞ | |
 | BQ Boqii Holding Limited |
| Sector: Services & Goods | |
| SubSector: Specialty Retail | |
| MarketCap: 33027 Millions | |
| Recent Price: 0.33 Smart Investing & Trading Score: 90 | |
| Day Percent Change: 10.40% Day Change: 0.03 | |
| Week Change: 8.22% Year-to-date Change: -27.6% | |
| BQ Links: Profile News Message Board | |
| Charts:- Daily , Weekly | |
| Add BQ to Watchlist: View: Get Complete BQ Trend Analysis ➞ | |
 | AIH Aesthetic Medical International Holdings Group Limited |
| Sector: Health Care | |
| SubSector: Specialized Health Services | |
| MarketCap: 205.356 Millions | |
| Recent Price: 0.45 Smart Investing & Trading Score: 37 | |
| Day Percent Change: 5.96% Day Change: 0.03 | |
| Week Change: 5.37% Year-to-date Change: -34.3% | |
| AIH Links: Profile News Message Board | |
| Charts:- Daily , Weekly | |
| Add AIH to Watchlist: View: Get Complete AIH Trend Analysis ➞ | |
 | DAO Youdao, Inc. |
| Sector: Technology | |
| SubSector: Internet Information Providers | |
| MarketCap: 2073.2 Millions | |
| Recent Price: 3.56 Smart Investing & Trading Score: 37 | |
| Day Percent Change: 0.85% Day Change: 0.03 | |
| Week Change: 1.14% Year-to-date Change: -9.6% | |
| DAO Links: Profile News Message Board | |
| Charts:- Daily , Weekly | |
| Add DAO to Watchlist: View: Get Complete DAO Trend Analysis ➞ | |
 | HOLO MicroCloud Hologram Inc. |
| Sector: Technology | |
| SubSector: Electronic Components | |
| MarketCap: 159 Millions | |
| Recent Price: 2.56 Smart Investing & Trading Score: 37 | |
| Day Percent Change: 0.59% Day Change: 0.02 | |
| Week Change: 2.2% Year-to-date Change: 635.3% | |
| HOLO Links: Profile News Message Board | |
| Charts:- Daily , Weekly | |
| Add HOLO to Watchlist: View: Get Complete HOLO Trend Analysis ➞ | |
 | THCH TH International Limited |
| Sector: Services & Goods | |
| SubSector: Restaurants | |
| MarketCap: 452 Millions | |
| Recent Price: 1.09 Smart Investing & Trading Score: 17 | |
| Day Percent Change: 1.40% Day Change: 0.02 | |
| Week Change: -4.39% Year-to-date Change: -37.4% | |
| THCH Links: Profile News Message Board | |
| Charts:- Daily , Weekly | |
| Add THCH to Watchlist: View: Get Complete THCH Trend Analysis ➞ | |
 | WIMI WiMi Hologram Cloud Inc. |
| Sector: Technology | |
| SubSector: Advertising Agencies | |
| MarketCap: 41837 Millions | |
| Recent Price: 0.95 Smart Investing & Trading Score: 30 | |
| Day Percent Change: 2.08% Day Change: 0.02 | |
| Week Change: -6.73% Year-to-date Change: 18.2% | |
| WIMI Links: Profile News Message Board | |
| Charts:- Daily , Weekly | |
| Add WIMI to Watchlist: View: Get Complete WIMI Trend Analysis ➞ | |
 | IH iHuman Inc. |
| Sector: Consumer Staples | |
| SubSector: Education & Training Services | |
| MarketCap: 12247 Millions | |
| Recent Price: 1.75 Smart Investing & Trading Score: 57 | |
| Day Percent Change: 1.16% Day Change: 0.02 | |
| Week Change: 0.57% Year-to-date Change: -42.6% | |
| IH Links: Profile News Message Board | |
| Charts:- Daily , Weekly | |
| Add IH to Watchlist: View: Get Complete IH Trend Analysis ➞ | |
 | KRKR 36Kr Holdings Inc. |
| Sector: Technology | |
| SubSector: Internet Information Providers | |
| MarketCap: 173.18 Millions | |
| Recent Price: 0.37 Smart Investing & Trading Score: 17 | |
| Day Percent Change: 5.37% Day Change: 0.02 | |
| Week Change: -0.54% Year-to-date Change: -34.1% | |
| KRKR Links: Profile News Message Board | |
| Charts:- Daily , Weekly | |
| Add KRKR to Watchlist: View: Get Complete KRKR Trend Analysis ➞ | |
 | AGMH AGM Group Holdings Inc. |
| Sector: Technology | |
| SubSector: Application Software | |
| MarketCap: 320.362 Millions | |
| Recent Price: 1.08 Smart Investing & Trading Score: 25 | |
| Day Percent Change: 1.89% Day Change: 0.02 | |
| Week Change: 1.89% Year-to-date Change: -40.3% | |
| AGMH Links: Profile News Message Board | |
| Charts:- Daily , Weekly | |
| Add AGMH to Watchlist: View: Get Complete AGMH Trend Analysis ➞ | |
 | CANG Cango Inc. |
| Sector: Technology | |
| SubSector: Internet Information Providers | |
| MarketCap: 947.48 Millions | |
| Recent Price: 1.48 Smart Investing & Trading Score: 37 | |
| Day Percent Change: 1.37% Day Change: 0.02 | |
| Week Change: 2.78% Year-to-date Change: 45.1% | |
| CANG Links: Profile News Message Board | |
| Charts:- Daily , Weekly | |
| Add CANG to Watchlist: View: Get Complete CANG Trend Analysis ➞ | |
 | BEST BEST Inc. |
| Sector: Consumer Staples | |
| SubSector: Packaging & Containers | |
| MarketCap: 1981.73 Millions | |
| Recent Price: 2.13 Smart Investing & Trading Score: 17 | |
| Day Percent Change: 0.95% Day Change: 0.02 | |
| Week Change: 0.95% Year-to-date Change: -16.5% | |
| BEST Links: Profile News Message Board | |
| Charts:- Daily , Weekly | |
| Add BEST to Watchlist: View: Get Complete BEST Trend Analysis ➞ | |
 | UTSI UTStarcom Holdings Corp. |
| Sector: Technology | |
| SubSector: Communication Equipment | |
| MarketCap: 76.6539 Millions | |
| Recent Price: 2.69 Smart Investing & Trading Score: 20 | |
| Day Percent Change: 0.37% Day Change: 0.01 | |
| Week Change: -2.18% Year-to-date Change: -21.8% | |
| UTSI Links: Profile News Message Board | |
| Charts:- Daily , Weekly | |
| Add UTSI to Watchlist: View: Get Complete UTSI Trend Analysis ➞ | |
 | SFWL Shengfeng Development Limited |
| Sector: Industrials | |
| SubSector: Integrated Freight & Logistics | |
| MarketCap: 747 Millions | |
| Recent Price: 1.74 Smart Investing & Trading Score: 85 | |
| Day Percent Change: 0.58% Day Change: 0.01 | |
| Week Change: 5.45% Year-to-date Change: -36.7% | |
| SFWL Links: Profile News Message Board | |
| Charts:- Daily , Weekly | |
| Add SFWL to Watchlist: View: Get Complete SFWL Trend Analysis ➞ | |
 | LKCO Luokung Technology Corp. |
| Sector: Technology | |
| SubSector: Application Software | |
| MarketCap: 84 Millions | |
| Recent Price: 0.49 Smart Investing & Trading Score: 7 | |
| Day Percent Change: 2.33% Day Change: 0.01 | |
| Week Change: 1.26% Year-to-date Change: -0.4% | |
| LKCO Links: Profile News Message Board | |
| Charts:- Daily , Weekly | |
| Add LKCO to Watchlist: View: Get Complete LKCO Trend Analysis ➞ | |
 | QD Qudian Inc. |
| Sector: Technology | |
| SubSector: Information Technology Services | |
| MarketCap: 544.968 Millions | |
| Recent Price: 2.41 Smart Investing & Trading Score: 22 | |
| Day Percent Change: 0.42% Day Change: 0.01 | |
| Week Change: -2.03% Year-to-date Change: 18.1% | |
| QD Links: Profile News Message Board | |
| Charts:- Daily , Weekly | |
| Add QD to Watchlist: View: Get Complete QD Trend Analysis ➞ | |
 | COE China Online Education Group |
| Sector: Services & Goods | |
| SubSector: Education & Training Services | |
| MarketCap: 643.406 Millions | |
| Recent Price: 7.01 Smart Investing & Trading Score: 73 | |
| Day Percent Change: 0.14% Day Change: 0.01 | |
| Week Change: 6.05% Year-to-date Change: -12.7% | |
| COE Links: Profile News Message Board | |
| Charts:- Daily , Weekly | |
| Add COE to Watchlist: View: Get Complete COE Trend Analysis ➞ | |
 | SY So-Young International Inc. |
| Sector: Technology | |
| SubSector: Healthcare Information Services | |
| MarketCap: 1000.55 Millions | |
| Recent Price: 1.29 Smart Investing & Trading Score: 73 | |
| Day Percent Change: 0.78% Day Change: 0.01 | |
| Week Change: 2.79% Year-to-date Change: 0.0% | |
| SY Links: Profile News Message Board | |
| Charts:- Daily , Weekly | |
| Add SY to Watchlist: View: Get Complete SY Trend Analysis ➞ | |
 | ZH Zhihu Inc. |
| Sector: Services & Goods | |
| SubSector: Internet Content & Information | |
| MarketCap: 741 Millions | |
| Recent Price: 0.66 Smart Investing & Trading Score: 29 | |
| Day Percent Change: 0.39% Day Change: 0.00 | |
| Week Change: 0.52% Year-to-date Change: -29.8% | |
| ZH Links: Profile News Message Board | |
| Charts:- Daily , Weekly | |
| Add ZH to Watchlist: View: Get Complete ZH Trend Analysis ➞ | |
 | YQ 17 Education & Technology Group Inc. |
| Sector: Consumer Staples | |
| SubSector: Education & Training Services | |
| MarketCap: 32347 Millions | |
| Recent Price: 2.62 Smart Investing & Trading Score: 22 | |
| Day Percent Change: 0.00% Day Change: 0.00 | |
| Week Change: -9.34% Year-to-date Change: 28.4% | |
| YQ Links: Profile News Message Board | |
| Charts:- Daily , Weekly | |
| Add YQ to Watchlist: View: Get Complete YQ Trend Analysis ➞ | |
 | EDTK Skillful Craftsman Education Technology Limited |
| Sector: Consumer Staples | |
| SubSector: Education & Training Services | |
| MarketCap: 32347 Millions | |
| Recent Price: 0.95 Smart Investing & Trading Score: 63 | |
| Day Percent Change: 0.00% Day Change: 0.00 | |
| Week Change: -0.48% Year-to-date Change: -25.0% | |
| EDTK Links: Profile News Message Board | |
| Charts:- Daily , Weekly | |
| Add EDTK to Watchlist: View: Get Complete EDTK Trend Analysis ➞ | |
 | CLEU China Liberal Education Holdings Limited |
| Sector: Consumer Staples | |
| SubSector: Education & Training Services | |
| MarketCap: 32347 Millions | |
| Recent Price: 1.05 Smart Investing & Trading Score: 25 | |
| Day Percent Change: 0.00% Day Change: 0.00 | |
| Week Change: -2.78% Year-to-date Change: 487.3% | |
| CLEU Links: Profile News Message Board | |
| Charts:- Daily , Weekly | |
| Add CLEU to Watchlist: View: Get Complete CLEU Trend Analysis ➞ | |
| For tabular summary view of above stock list: Summary View ➞ 0 - 25 , 25 - 50 , 50 - 75 , 75 - 100 , 100 - 125 , 125 - 150 | ||
| Click To Change The Sort Order: By Market Cap or Company Size Performance: Year-to-date, Week and Day | |
| Select Chart Type: | ||
|
Best Stocks Today 12Stocks.com |
© 2024 12Stocks.com Terms & Conditions Privacy Contact Us
All Information Provided Only For Education And Not To Be Used For Investing or Trading. See Terms & Conditions


One More Thing ... Get Best Stocks Delivered Daily!
Never Ever Miss A Move With Our Top Ten Stocks Lists
Find Best Stocks In Any Market - Bull or Bear Market
Take A Peek At Our Top Ten Stocks Lists: Daily, Weekly, Year-to-Date & Top Trends
Find Best Stocks In Any Market - Bull or Bear Market
Take A Peek At Our Top Ten Stocks Lists: Daily, Weekly, Year-to-Date & Top Trends
China Stocks With Best Up Trends [0-bearish to 100-bullish]: KE [100], JD.com [100], 21Vianet [100], MINISO [100], Smart Share[100], Dada Nexus[100], Noah [100], Baidu [100], Alibaba [100], Hesai [100], Niu [100]
Best China Stocks Year-to-Date:
U Power[2974.78%], DouYu [856.84%], MicroCloud Hologram[635.25%], China Liberal[487.25%], Yatsen Holding[475.45%], Zhongchao [388.91%], Uxin [176.75%], QuantaSing [101.23%], GigaCloud [89.46%], Yiren Digital[74.68%], Cheetah Mobile[74.56%] Best China Stocks This Week:
Smart Share[39.89%], NIO [24.5%], Huize Holding[22.7%], Regencell Bioscience[21.31%], 21Vianet [20.89%], XPeng [19.9%], Dingdong (Cayman)[17.86%], Li Auto[15.79%], Golden Heaven[15.1%], Viomi [14.43%], GDS [14.05%] Best China Stocks Daily:
Regencell Bioscience[23.15%], XPeng [15.76%], Bilibili [15.63%], Huize Holding[13.70%], KE [12.64%], Kingsoft Cloud[11.54%], JD.com [11.51%], Pinduoduo [10.48%], Boqii Holding[10.40%], Li Auto[10.04%], 21Vianet [9.77%]