
 Login Sign Up


| |||||
 |  | ||||

| 12Stocks.com Market Intelligence |
Best China Stocks
|
On this page, you will find the most comprehensive analysis of Chinese stocks and ETFs - from latest trends to performances to charts ➞. First, here are the year-to-date (YTD) performances of the most requested China stocks at 12Stocks.com (click stock for review):
| New Oriental 19% | ||
| Sohu.com 10% | ||
| NetEase -1% | ||
| Alibaba -11% | ||
| JD.com -12% | ||
| Vipshop -15% | ||
| JOYY -18% | ||
| Baidu -20% | ||
| Weibo -26% | ||
| In a hurry? China Stocks Lists: Performance Trends Table, Stock Charts
Sort China stocks: Daily, Weekly, Year-to-Date, Market Cap & Trends. Filter China stocks list by sector: Show all, Tech, Finance, Energy, Staples, Retail, Industrial, Materials, Utilities and HealthCare Filter China stocks list by size: All China Large Medium Small and MicroCap |
| April 19, 2024 - 12Stocks.com China Stocks Performances & Trends Daily | |||||||||
|
|  The overall Smart Investing & Trading Score is 73 (0-bearish to 100-bullish) which puts China index in short term neutral to bullish trend. The Smart Investing & Trading Score from previous trading session is 36 and hence an improvement of trend.
| ||||||||
| Here are the Smart Investing & Trading Scores of the most requested China stocks at 12Stocks.com (click stock name for detailed review): |


| 12Stocks.com: Top Performing China Index Stocks | ||||||||||||||||||||||||||||||||||||||||||||||||
 The top performing China Index stocks year to date are
Now, more recently, over last week, the top performing China Index stocks on the move are


|
||||||||||||||||||||||||||||||||||||||||||||||||
| 12Stocks.com: Investing in China Index with Stocks | |
|
The following table helps investors and traders sort through current performance and trends (as measured by Smart Investing & Trading Score) of various
stocks in the China Index. Quick View: Move mouse or cursor over stock symbol (ticker) to view short-term technical chart and over stock name to view long term chart. Click on  to add stock symbol to your watchlist and to add stock symbol to your watchlist and  to view watchlist. Click on any ticker or stock name for detailed market intelligence report for that stock. to view watchlist. Click on any ticker or stock name for detailed market intelligence report for that stock. |
12Stocks.com Performance of Stocks in China Index
| Ticker | Stock Name | Watchlist | Category | Recent Price | Smart Investing & Trading Score | Change % | Weekly Change% |
| ZCMD | Zhongchao |   | Health Care | 3.38 | 100 | 146.72% | 106.10% |
| RGC | Regencell Bioscience | | Health Care | 5.22 | 24 | 10.20% | 37.01% |
| KNDI | Kandi | | Consumer Staples | 2.63 | 74 | 9.58% | 25.84% |
| YSG | Yatsen Holding | | Services & Goods | 3.58 | 83 | -0.83% | 18.94% |
| THCH | TH | | Services & Goods | 1.30 | 74 | 25.00% | 18.18% |
| SECO | Secoo Holding | | Services & Goods | 0.40 | 42 | 9.32% | 11.83% |
| EM | Smart Share | | Services & Goods | 0.65 | 93 | 4.64% | 9.93% |
| TOUR | Tuniu | | Consumer Staples | 0.85 | 95 | 5.20% | 8.99% |
| GCT | GigaCloud | | Technology | 36.77 | 100 | 5.27% | 8.80% |
| EH | EHang | | Industrials | 18.29 | 73 | 5.66% | 8.29% |
| MOMO | Momo | | Technology | 5.68 | 42 | 2.90% | 7.17% |
| SDA | SunCar | | Services & Goods | 7.49 | 67 | 2.46% | 7.00% |
| QH | Quhuo | | Technology | 0.61 | 57 | 8.36% | 6.85% |
| YGMZ | MingZhu Logistics | | Industrials | 0.43 | 74 | 9.54% | 6.50% |
| DOYU | DouYu | | Technology | 8.03 | 90 | 1.77% | 6.36% |
| WB | | Technology | 8.06 | 55 | 3.73% | 5.64% | |
| HUIZ | Huize Holding | | Financials | 0.63 | 64 | 2.75% | 5.30% |
| UCAR | U Power | | Services & Goods | 5.33 | 83 | 8.11% | 4.51% |
| ZTO | ZTO Express | | Transports | 20.00 | 68 | 3.57% | 3.84% |
| LU | Lufax Holding | | Financials | 4.27 | 83 | 2.64% | 3.14% |
| CLEU | China Liberal | | Consumer Staples | 1.00 | 22 | 1.01% | 3.09% |
| SY | So-Young | | Technology | 1.20 | 88 | 2.56% | 2.56% |
| QSG | QuantaSing | | Consumer Staples | 3.44 | 35 | -3.23% | 2.53% |
| BEDU | Bright Scholar | | Services & Goods | 1.88 | 46 | -3.09% | 2.17% |
| IQ | iQIYI | | Technology | 4.20 | 81 | 0.96% | 1.94% |
| For chart view version of above stock list: Chart View ➞ 0 - 25 , 25 - 50 , 50 - 75 , 75 - 100 , 100 - 125 , 125 - 150 | ||
 | Click To Change The Sort Order: By Market Cap or Company Size Performance: Year-to-date, Week and Day |  |
|
Get the most comprehensive stock market coverage daily at 12Stocks.com ➞ Best Stocks Today ➞ Best Stocks Weekly ➞ Best Stocks Year-to-Date ➞ Best Stocks Trends ➞  Best Stocks Today 12Stocks.com Best Nasdaq Stocks ➞ Best S&P 500 Stocks ➞ Best Tech Stocks ➞ Best Biotech Stocks ➞ |
| Detailed Overview of China Stocks |
| China Technical Overview, Leaders & Laggards, Top China ETF Funds & Detailed China Stocks List, Charts, Trends & More |
| China: Technical Analysis, Trends & YTD Performance | |
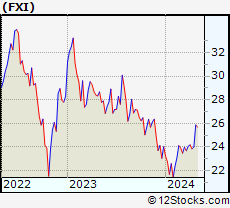
 FXI Weekly Chart |
|
| Long Term Trend: Very Good | |
| Medium Term Trend: Good | |
 FXI Daily Chart |
|
| Short Term Trend: Very Good | |
| Overall Trend Score: 73 | |
| YTD Performance: 0.21% | |
| **Trend Scores & Views Are Only For Educational Purposes And Not For Investing | |
| 12Stocks.com: Investing in China Index using Exchange Traded Funds | |
|
The following table shows list of key exchange traded funds (ETF) that
help investors play China stock market. For detailed view, check out our ETF Funds section of our website. Quick View: Move mouse or cursor over ETF symbol (ticker) to view short-term technical chart and over ETF name to view long term chart. Click on ticker or stock name for detailed view. Click on to add stock symbol to your watchlist and to view watchlist. |
12Stocks.com List of ETFs that track China Index
| Ticker | ETF Name | Watchlist | Recent Price | Smart Investing & Trading Score | Change % | Week % | Year-to-date % |
| FXI | China Large-Cap | | 24.08 | 73 | 1.82 | 1.01 | 0.21% |
| EWH | Hong Kong | | 14.74 | 17 | 0.61 | -2.77 | -15.14% |
| YINN | China Bull 3X | | 18.81 | 73 | 5.08 | 2.28 | -10.17% |
| YANG | China Bear 3X | | 11.58 | 25 | -5.47 | -2.61 | -9.53% |
| XPP | China 50 | | 12.99 | 66 | 3.16 | 1.64 | -5.49% |
| MCHI | China | | 39.54 | 73 | 1.28 | 0.66 | -2.95% |
| GXC | China | | 65.52 | 73 | 1.02 | 0.69 | -3.82% |
| CBON | ChinaAMC China Bond | | 21.92 | 55 | -0.15 | 0.26 | -0.83% |
| 12Stocks.com: Charts, Trends, Fundamental Data and Performances of China Stocks | |
|
We now take in-depth look at all China stocks including charts, multi-period performances and overall trends (as measured by Smart Investing & Trading Score). One can sort China stocks (click link to choose) by Daily, Weekly and by Year-to-Date performances. Also, one can sort by size of the company or by market capitalization. |
| Select Your Default Chart Type: | |||||
| |||||
| Click on stock symbol or name for detailed view. Click on to add stock symbol to your watchlist and to view watchlist. Quick View: Move mouse or cursor over "Daily" to quickly view daily technical stock chart and over "Weekly" to view weekly technical stock chart. | |||||

 | ZCMD Zhongchao Inc. |
| Sector: Health Care | |
| SubSector: Health Information Services | |
| MarketCap: 41487 Millions | |
| Recent Price: 3.38 Smart Investing & Trading Score: 100 | |
| Day Percent Change: 146.72% Day Change: 2.01 | |
| Week Change: 106.1% Year-to-date Change: 825.8% | |
| ZCMD Links: Profile News Message Board | |
| Charts:- Daily , Weekly | |
| Add ZCMD to Watchlist: View: Get Complete ZCMD Trend Analysis ➞ | |
 | RGC Regencell Bioscience Holdings Limited |
| Sector: Health Care | |
| SubSector: Drug Manufacturers - Specialty & Generic | |
| MarketCap: 284 Millions | |
| Recent Price: 5.22 Smart Investing & Trading Score: 24 | |
| Day Percent Change: 10.20% Day Change: 0.48 | |
| Week Change: 37.01% Year-to-date Change: -50.3% | |
| RGC Links: Profile News Message Board | |
| Charts:- Daily , Weekly | |
| Add RGC to Watchlist: View: Get Complete RGC Trend Analysis ➞ | |
 | KNDI Kandi Technologies Group, Inc. |
| Sector: Consumer Staples | |
| SubSector: Auto Manufacturers - Major | |
| MarketCap: 137.471 Millions | |
| Recent Price: 2.63 Smart Investing & Trading Score: 74 | |
| Day Percent Change: 9.58% Day Change: 0.23 | |
| Week Change: 25.84% Year-to-date Change: -6.1% | |
| KNDI Links: Profile News Message Board | |
| Charts:- Daily , Weekly | |
| Add KNDI to Watchlist: View: Get Complete KNDI Trend Analysis ➞ | |
 | YSG Yatsen Holding Limited |
| Sector: Services & Goods | |
| SubSector: Specialty Retail | |
| MarketCap: 11827 Millions | |
| Recent Price: 3.58 Smart Investing & Trading Score: 83 | |
| Day Percent Change: -0.83% Day Change: -0.03 | |
| Week Change: 18.94% Year-to-date Change: 389.3% | |
| YSG Links: Profile News Message Board | |
| Charts:- Daily , Weekly | |
| Add YSG to Watchlist: View: Get Complete YSG Trend Analysis ➞ | |
 | THCH TH International Limited |
| Sector: Services & Goods | |
| SubSector: Restaurants | |
| MarketCap: 452 Millions | |
| Recent Price: 1.30 Smart Investing & Trading Score: 74 | |
| Day Percent Change: 25.00% Day Change: 0.26 | |
| Week Change: 18.18% Year-to-date Change: -25.3% | |
| THCH Links: Profile News Message Board | |
| Charts:- Daily , Weekly | |
| Add THCH to Watchlist: View: Get Complete THCH Trend Analysis ➞ | |
 | SECO Secoo Holding Limited |
| Sector: Services & Goods | |
| SubSector: Specialty Retail, Other | |
| MarketCap: 209.144 Millions | |
| Recent Price: 0.40 Smart Investing & Trading Score: 42 | |
| Day Percent Change: 9.32% Day Change: 0.03 | |
| Week Change: 11.83% Year-to-date Change: -29.2% | |
| SECO Links: Profile News Message Board | |
| Charts:- Daily , Weekly | |
| Add SECO to Watchlist: View: Get Complete SECO Trend Analysis ➞ | |
 | EM Smart Share Global Limited |
| Sector: Services & Goods | |
| SubSector: Personal Services | |
| MarketCap: 238 Millions | |
| Recent Price: 0.65 Smart Investing & Trading Score: 93 | |
| Day Percent Change: 4.64% Day Change: 0.03 | |
| Week Change: 9.93% Year-to-date Change: 27.0% | |
| EM Links: Profile News Message Board | |
| Charts:- Daily , Weekly | |
| Add EM to Watchlist: View: Get Complete EM Trend Analysis ➞ | |
 | TOUR Tuniu Corporation |
| Sector: Consumer Staples | |
| SubSector: Recreational Goods, Other | |
| MarketCap: 124.459 Millions | |
| Recent Price: 0.85 Smart Investing & Trading Score: 95 | |
| Day Percent Change: 5.20% Day Change: 0.04 | |
| Week Change: 8.99% Year-to-date Change: 26.7% | |
| TOUR Links: Profile News Message Board | |
| Charts:- Daily , Weekly | |
| Add TOUR to Watchlist: View: Get Complete TOUR Trend Analysis ➞ | |
 | GCT GigaCloud Technology Inc. |
| Sector: Technology | |
| SubSector: Software - Infrastructure | |
| MarketCap: 240 Millions | |
| Recent Price: 36.77 Smart Investing & Trading Score: 100 | |
| Day Percent Change: 5.27% Day Change: 1.84 | |
| Week Change: 8.8% Year-to-date Change: 100.8% | |
| GCT Links: Profile News Message Board | |
| Charts:- Daily , Weekly | |
| Add GCT to Watchlist: View: Get Complete GCT Trend Analysis ➞ | |
 | EH EHang Holdings Limited |
| Sector: Industrials | |
| SubSector: Aerospace/Defense Products & Services | |
| MarketCap: 513.401 Millions | |
| Recent Price: 18.29 Smart Investing & Trading Score: 73 | |
| Day Percent Change: 5.66% Day Change: 0.98 | |
| Week Change: 8.29% Year-to-date Change: 8.9% | |
| EH Links: Profile News Message Board | |
| Charts:- Daily , Weekly | |
| Add EH to Watchlist: View: Get Complete EH Trend Analysis ➞ | |
 | MOMO Momo Inc. |
| Sector: Technology | |
| SubSector: Internet Software & Services | |
| MarketCap: 4796.71 Millions | |
| Recent Price: 5.68 Smart Investing & Trading Score: 42 | |
| Day Percent Change: 2.90% Day Change: 0.16 | |
| Week Change: 7.17% Year-to-date Change: -18.3% | |
| MOMO Links: Profile News Message Board | |
| Charts:- Daily , Weekly | |
| Add MOMO to Watchlist: View: Get Complete MOMO Trend Analysis ➞ | |
 | SDA SunCar Technology Group Inc. |
| Sector: Services & Goods | |
| SubSector: Auto & Truck Dealerships | |
| MarketCap: 2680 Millions | |
| Recent Price: 7.49 Smart Investing & Trading Score: 67 | |
| Day Percent Change: 2.46% Day Change: 0.18 | |
| Week Change: 7% Year-to-date Change: -3.6% | |
| SDA Links: Profile News Message Board | |
| Charts:- Daily , Weekly | |
| Add SDA to Watchlist: View: Get Complete SDA Trend Analysis ➞ | |
 | QH Quhuo Limited |
| Sector: Technology | |
| SubSector: Software Application | |
| MarketCap: 37787 Millions | |
| Recent Price: 0.61 Smart Investing & Trading Score: 57 | |
| Day Percent Change: 8.36% Day Change: 0.05 | |
| Week Change: 6.85% Year-to-date Change: -57.9% | |
| QH Links: Profile News Message Board | |
| Charts:- Daily , Weekly | |
| Add QH to Watchlist: View: Get Complete QH Trend Analysis ➞ | |
 | YGMZ MingZhu Logistics Holdings Limited |
| Sector: Industrials | |
| SubSector: Trucking | |
| MarketCap: 41627 Millions | |
| Recent Price: 0.43 Smart Investing & Trading Score: 74 | |
| Day Percent Change: 9.54% Day Change: 0.04 | |
| Week Change: 6.5% Year-to-date Change: -9.8% | |
| YGMZ Links: Profile News Message Board | |
| Charts:- Daily , Weekly | |
| Add YGMZ to Watchlist: View: Get Complete YGMZ Trend Analysis ➞ | |
 | DOYU DouYu International Holdings Limited |
| Sector: Technology | |
| SubSector: Internet Information Providers | |
| MarketCap: 2483 Millions | |
| Recent Price: 8.03 Smart Investing & Trading Score: 90 | |
| Day Percent Change: 1.77% Day Change: 0.14 | |
| Week Change: 6.36% Year-to-date Change: 745.3% | |
| DOYU Links: Profile News Message Board | |
| Charts:- Daily , Weekly | |
| Add DOYU to Watchlist: View: Get Complete DOYU Trend Analysis ➞ | |
 | WB Weibo Corporation |
| Sector: Technology | |
| SubSector: Internet Information Providers | |
| MarketCap: 8164.6 Millions | |
| Recent Price: 8.06 Smart Investing & Trading Score: 55 | |
| Day Percent Change: 3.73% Day Change: 0.29 | |
| Week Change: 5.64% Year-to-date Change: -26.4% | |
| WB Links: Profile News Message Board | |
| Charts:- Daily , Weekly | |
| Add WB to Watchlist: View: Get Complete WB Trend Analysis ➞ | |
 | HUIZ Huize Holding Limited |
| Sector: Financials | |
| SubSector: Insurance Brokers | |
| MarketCap: 37157 Millions | |
| Recent Price: 0.63 Smart Investing & Trading Score: 64 | |
| Day Percent Change: 2.75% Day Change: 0.02 | |
| Week Change: 5.3% Year-to-date Change: -29.8% | |
| HUIZ Links: Profile News Message Board | |
| Charts:- Daily , Weekly | |
| Add HUIZ to Watchlist: View: Get Complete HUIZ Trend Analysis ➞ | |
 | UCAR U Power Limited |
| Sector: Services & Goods | |
| SubSector: Auto & Truck Dealerships | |
| MarketCap: 372 Millions | |
| Recent Price: 5.33 Smart Investing & Trading Score: 83 | |
| Day Percent Change: 8.11% Day Change: 0.40 | |
| Week Change: 4.51% Year-to-date Change: 2,874.3% | |
| UCAR Links: Profile News Message Board | |
| Charts:- Daily , Weekly | |
| Add UCAR to Watchlist: View: Get Complete UCAR Trend Analysis ➞ | |
 | ZTO ZTO Express (Cayman) Inc. |
| Sector: Transports | |
| SubSector: Air Delivery & Freight Services | |
| MarketCap: 20507 Millions | |
| Recent Price: 20.00 Smart Investing & Trading Score: 68 | |
| Day Percent Change: 3.57% Day Change: 0.69 | |
| Week Change: 3.84% Year-to-date Change: -6.0% | |
| ZTO Links: Profile News Message Board | |
| Charts:- Daily , Weekly | |
| Add ZTO to Watchlist: View: Get Complete ZTO Trend Analysis ➞ | |
 | LU Lufax Holding Ltd |
| Sector: Financials | |
| SubSector: Credit Services | |
| MarketCap: 33457 Millions | |
| Recent Price: 4.27 Smart Investing & Trading Score: 83 | |
| Day Percent Change: 2.64% Day Change: 0.11 | |
| Week Change: 3.14% Year-to-date Change: 39.1% | |
| LU Links: Profile News Message Board | |
| Charts:- Daily , Weekly | |
| Add LU to Watchlist: View: Get Complete LU Trend Analysis ➞ | |
 | CLEU China Liberal Education Holdings Limited |
| Sector: Consumer Staples | |
| SubSector: Education & Training Services | |
| MarketCap: 32347 Millions | |
| Recent Price: 1.00 Smart Investing & Trading Score: 22 | |
| Day Percent Change: 1.01% Day Change: 0.01 | |
| Week Change: 3.09% Year-to-date Change: 459.3% | |
| CLEU Links: Profile News Message Board | |
| Charts:- Daily , Weekly | |
| Add CLEU to Watchlist: View: Get Complete CLEU Trend Analysis ➞ | |
 | SY So-Young International Inc. |
| Sector: Technology | |
| SubSector: Healthcare Information Services | |
| MarketCap: 1000.55 Millions | |
| Recent Price: 1.20 Smart Investing & Trading Score: 88 | |
| Day Percent Change: 2.56% Day Change: 0.03 | |
| Week Change: 2.56% Year-to-date Change: -7.0% | |
| SY Links: Profile News Message Board | |
| Charts:- Daily , Weekly | |
| Add SY to Watchlist: View: Get Complete SY Trend Analysis ➞ | |
 | QSG QuantaSing Group Limited |
| Sector: Consumer Staples | |
| SubSector: Education & Training Services | |
| MarketCap: 433 Millions | |
| Recent Price: 3.44 Smart Investing & Trading Score: 35 | |
| Day Percent Change: -3.23% Day Change: -0.12 | |
| Week Change: 2.53% Year-to-date Change: 112.7% | |
| QSG Links: Profile News Message Board | |
| Charts:- Daily , Weekly | |
| Add QSG to Watchlist: View: Get Complete QSG Trend Analysis ➞ | |
 | BEDU Bright Scholar Education Holdings Limited |
| Sector: Services & Goods | |
| SubSector: Education & Training Services | |
| MarketCap: 792.406 Millions | |
| Recent Price: 1.88 Smart Investing & Trading Score: 46 | |
| Day Percent Change: -3.09% Day Change: -0.06 | |
| Week Change: 2.17% Year-to-date Change: 50.4% | |
| BEDU Links: Profile News Message Board | |
| Charts:- Daily , Weekly | |
| Add BEDU to Watchlist: View: Get Complete BEDU Trend Analysis ➞ | |
 | IQ iQIYI, Inc. |
| Sector: Technology | |
| SubSector: Internet Information Providers | |
| MarketCap: 13591.5 Millions | |
| Recent Price: 4.20 Smart Investing & Trading Score: 81 | |
| Day Percent Change: 0.96% Day Change: 0.04 | |
| Week Change: 1.94% Year-to-date Change: -13.9% | |
| IQ Links: Profile News Message Board | |
| Charts:- Daily , Weekly | |
| Add IQ to Watchlist: View: Get Complete IQ Trend Analysis ➞ | |
| For tabular summary view of above stock list: Summary View ➞ 0 - 25 , 25 - 50 , 50 - 75 , 75 - 100 , 100 - 125 , 125 - 150 | ||
| Click To Change The Sort Order: By Market Cap or Company Size Performance: Year-to-date, Week and Day | |
| Select Chart Type: | ||
|
Best Stocks Today 12Stocks.com |
© 2024 12Stocks.com Terms & Conditions Privacy Contact Us
All Information Provided Only For Education And Not To Be Used For Investing or Trading. See Terms & Conditions


One More Thing ... Get Best Stocks Delivered Daily!
Never Ever Miss A Move With Our Top Ten Stocks Lists
Find Best Stocks In Any Market - Bull or Bear Market
Take A Peek At Our Top Ten Stocks Lists: Daily, Weekly, Year-to-Date & Top Trends
Find Best Stocks In Any Market - Bull or Bear Market
Take A Peek At Our Top Ten Stocks Lists: Daily, Weekly, Year-to-Date & Top Trends
China Stocks With Best Up Trends [0-bearish to 100-bullish]: Zhongchao [100], GigaCloud [100], Smart Share[93], DouYu [90], So-Young [88], GDS [88], JOYY [88], U Power[83], Tencent Music[83], Lufax Holding[83], Yatsen Holding[83]
Best China Stocks Year-to-Date:
U Power[2874.33%], Zhongchao [825.77%], DouYu [745.26%], MicroCloud Hologram[734.53%], China Liberal[459.28%], Yatsen Holding[389.34%], Uxin [136.8%], QuantaSing [112.65%], GigaCloud [100.82%], Yiren Digital[55.45%], Bright Scholar[50.4%] Best China Stocks This Week:
Zhongchao [106.1%], Regencell Bioscience[37.01%], Yatsen Holding[18.94%], TH [18.18%], Secoo Holding[11.83%], Smart Share[9.93%], GigaCloud [8.8%], EHang [8.29%], Momo [7.17%], SunCar [7%], Quhuo [6.85%] Best China Stocks Daily:
Zhongchao [146.72%], MicroCloud Hologram[30.04%], TH [25.00%], Golden Heaven[21.20%], Regencell Bioscience[10.20%], MingZhu Logistics[9.54%], Secoo Holding[9.32%], Cheetah Mobile[9.06%], Quhuo [8.36%], U Power[8.11%], 17 Education[7.05%]