
 Login Sign Up


| |||||
 |  | ||||

| 12Stocks.com Market Intelligence |
Best China Stocks
|
On this page, you will find the most comprehensive analysis of Chinese stocks and ETFs - from latest trends to performances to charts ➞. First, here are the year-to-date (YTD) performances of the most requested China stocks at 12Stocks.com (click stock for review):
| Sohu.com 19% | ||
| JD.com 13% | ||
| New Oriental 10% | ||
| NetEase 6% | ||
| Alibaba 4% | ||
| Baidu -6% | ||
| Vipshop -10% | ||
| JOYY -15% | ||
| Weibo -15% | ||
| In a hurry? China Stocks Lists: Performance Trends Table, Stock Charts
Sort China stocks: Daily, Weekly, Year-to-Date, Market Cap & Trends. Filter China stocks list by sector: Show all, Tech, Finance, Energy, Staples, Retail, Industrial, Materials, Utilities and HealthCare Filter China stocks list by size: All China Large Medium Small and MicroCap |
| May 2, 2024 - 12Stocks.com China Stocks Performances & Trends Daily | |||||||||
|
|  The overall Smart Investing & Trading Score is 100 (0-bearish to 100-bullish) which puts China index in short term bullish trend. The Smart Investing & Trading Score from previous trading session is 83 and hence an improvement of trend.
| ||||||||
| Here are the Smart Investing & Trading Scores of the most requested China stocks at 12Stocks.com (click stock name for detailed review): |

| 12Stocks.com: Top Performing China Index Stocks | ||||||||||||||||||||||||||||||||||||||||||||||||
 The top performing China Index stocks year to date are
Now, more recently, over last week, the top performing China Index stocks on the move are


|
||||||||||||||||||||||||||||||||||||||||||||||||
| 12Stocks.com: Investing in China Index with Stocks | |
|
The following table helps investors and traders sort through current performance and trends (as measured by Smart Investing & Trading Score) of various
stocks in the China Index. Quick View: Move mouse or cursor over stock symbol (ticker) to view short-term technical chart and over stock name to view long term chart. Click on  to add stock symbol to your watchlist and to add stock symbol to your watchlist and  to view watchlist. Click on any ticker or stock name for detailed market intelligence report for that stock. to view watchlist. Click on any ticker or stock name for detailed market intelligence report for that stock. |
12Stocks.com Performance of Stocks in China Index
| Ticker | Stock Name | Watchlist | Category | Recent Price | Smart Investing & Trading Score | Change % | YTD Change% |
| EDTK | Skillful Craftsman |   | Consumer Staples | 0.95 | 63 | 0.00% | -24.98% |
| YGMZ | MingZhu Logistics | | Industrials | 0.40 | 25 | 0.00% | -15.09% |
| UCL | uCloudlink | | Technology | 1.52 | 60 | 0.00% | -17.83% |
| QH | Quhuo | | Technology | 0.57 | 32 | 0.00% | -60.96% |
| BNR | Burning Rock | | Health Care | 0.75 | 8 | 0.00% | -22.50% |
| ATIF | ATIF | | Financials | 0.95 | 68 | 0.00% | -2.07% |
| MOGU | MOGU | | Services & Goods | 1.83 | 7 | 0.00% | -4.19% |
| KRKR | 36Kr | | Technology | 0.35 | 10 | -0.17% | -37.55% |
| UXIN | Uxin | | Technology | 1.95 | 64 | 0.00% | 178.17% |
| IMAB | I Mab | | Health Care | 1.76 | 15 | -0.28% | -7.37% |
| YJ | Yunji | | Services & Goods | 0.82 | 66 | 0.00% | 15.07% |
| DUO | Fangdd Network | | Financials | 0.39 | 10 | 0.00% | -42.05% |
| MSC | Studio City | | Services & Goods | 7.58 | 41 | -0.02% | 16.98% |
| SVA | Sinovac Biotech | | Health Care | 0.00 | 20 | -100.00% | -100.00% |
| EBON | Ebang | | Technology | 7.80 | 49 | -3.70% | -48.94% |
| SRL | Scully Royalty | | Financials | 6.21 | 15 | -3.50% | 1.72% |
| LANV | Lanvin | | Services & Goods | 1.66 | 57 | -8.79% | -45.75% |
| HKD | AMTD Digital | | Technology | 3.48 | 69 | -4.40% | -15.74% |
| SDA | SunCar | | Services & Goods | 7.59 | 68 | -1.88% | -2.38% |
| GHG | GreenTree Hospitality | | Services & Goods | 3.06 | 93 | -4.38% | -18.62% |
| KNDI | Kandi | | Consumer Staples | 2.42 | 42 | -3.97% | -13.57% |
| STG | Sunlands | | Services & Goods | 7.90 | 32 | -1.13% | -22.32% |
| CMCM | Cheetah Mobile | | Technology | 3.98 | 58 | -1.97% | 74.56% |
| CCM | Concord Medical | | Health Care | 0.70 | 90 | -8.29% | -36.36% |
| COE | China Online | | Services & Goods | 6.96 | 73 | -0.57% | -13.34% |
| For chart view version of above stock list: Chart View ➞ 0 - 25 , 25 - 50 , 50 - 75 , 75 - 100 , 100 - 125 , 125 - 150 | ||
 | Click To Change The Sort Order: By Market Cap or Company Size Performance: Year-to-date, Week and Day |  |
|
Get the most comprehensive stock market coverage daily at 12Stocks.com ➞ Best Stocks Today ➞ Best Stocks Weekly ➞ Best Stocks Year-to-Date ➞ Best Stocks Trends ➞  Best Stocks Today 12Stocks.com Best Nasdaq Stocks ➞ Best S&P 500 Stocks ➞ Best Tech Stocks ➞ Best Biotech Stocks ➞ |
| Detailed Overview of China Stocks |
| China Technical Overview, Leaders & Laggards, Top China ETF Funds & Detailed China Stocks List, Charts, Trends & More |
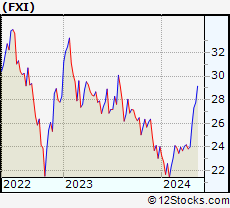
| China: Technical Analysis, Trends & YTD Performance | |
 FXI Weekly Chart |
|
| Long Term Trend: Very Good | |
| Medium Term Trend: Very Good | |
 FXI Daily Chart |
|
| Short Term Trend: Very Good | |
| Overall Trend Score: 100 | |
| YTD Performance: 12.98% | |
| **Trend Scores & Views Are Only For Educational Purposes And Not For Investing | |
| 12Stocks.com: Investing in China Index using Exchange Traded Funds | |
|
The following table shows list of key exchange traded funds (ETF) that
help investors play China stock market. For detailed view, check out our ETF Funds section of our website. Quick View: Move mouse or cursor over ETF symbol (ticker) to view short-term technical chart and over ETF name to view long term chart. Click on ticker or stock name for detailed view. Click on to add stock symbol to your watchlist and to view watchlist. |
12Stocks.com List of ETFs that track China Index
| Ticker | ETF Name | Watchlist | Recent Price | Smart Investing & Trading Score | Change % | Week % | Year-to-date % |
| FXI | China Large-Cap | | 27.15 | 100 | 5.72 | 4.95 | 12.98% |
| EWH | Hong Kong | | 16.79 | 100 | 4.09 | 5.07 | -3.34% |
| YINN | China Bull 3X | | 26.39 | 100 | 16.46 | 13.7 | 26.03% |
| YANG | China Bear 3X | | 7.95 | 0 | -16.40 | -14.88 | -37.89% |
| XPP | China 50 | | 16.38 | 100 | 10.71 | 8.98 | 19.17% |
| MCHI | China | | 44.47 | 100 | 5.45 | 5.01 | 9.16% |
| GXC | China | | 72.73 | 100 | 5.09 | 4.74 | 6.77% |
| CBON | ChinaAMC China Bond | | 21.98 | 65 | 0.41 | 0.64 | -0.54% |
| 12Stocks.com: Charts, Trends, Fundamental Data and Performances of China Stocks | |
|
We now take in-depth look at all China stocks including charts, multi-period performances and overall trends (as measured by Smart Investing & Trading Score). One can sort China stocks (click link to choose) by Daily, Weekly and by Year-to-Date performances. Also, one can sort by size of the company or by market capitalization. |
| Select Your Default Chart Type: | |||||
| |||||
| Click on stock symbol or name for detailed view. Click on to add stock symbol to your watchlist and to view watchlist. Quick View: Move mouse or cursor over "Daily" to quickly view daily technical stock chart and over "Weekly" to view weekly technical stock chart. | |||||

 | EDTK Skillful Craftsman Education Technology Limited |
| Sector: Consumer Staples | |
| SubSector: Education & Training Services | |
| MarketCap: 32347 Millions | |
| Recent Price: 0.95 Smart Investing & Trading Score: 63 | |
| Day Percent Change: 0.00% Day Change: 0.00 | |
| Week Change: -0.48% Year-to-date Change: -25.0% | |
| EDTK Links: Profile News Message Board | |
| Charts:- Daily , Weekly | |
| Add EDTK to Watchlist: View: Get Complete EDTK Trend Analysis ➞ | |
 | YGMZ MingZhu Logistics Holdings Limited |
| Sector: Industrials | |
| SubSector: Trucking | |
| MarketCap: 41627 Millions | |
| Recent Price: 0.40 Smart Investing & Trading Score: 25 | |
| Day Percent Change: 0.00% Day Change: 0.00 | |
| Week Change: -5.8% Year-to-date Change: -15.1% | |
| YGMZ Links: Profile News Message Board | |
| Charts:- Daily , Weekly | |
| Add YGMZ to Watchlist: View: Get Complete YGMZ Trend Analysis ➞ | |
 | UCL uCloudlink Group Inc. |
| Sector: Technology | |
| SubSector: Telecom Services | |
| MarketCap: 35837 Millions | |
| Recent Price: 1.52 Smart Investing & Trading Score: 60 | |
| Day Percent Change: 0.00% Day Change: 0.00 | |
| Week Change: 10.96% Year-to-date Change: -17.8% | |
| UCL Links: Profile News Message Board | |
| Charts:- Daily , Weekly | |
| Add UCL to Watchlist: View: Get Complete UCL Trend Analysis ➞ | |
 | QH Quhuo Limited |
| Sector: Technology | |
| SubSector: Software Application | |
| MarketCap: 37787 Millions | |
| Recent Price: 0.57 Smart Investing & Trading Score: 32 | |
| Day Percent Change: 0.00% Day Change: 0.00 | |
| Week Change: 3.64% Year-to-date Change: -61.0% | |
| QH Links: Profile News Message Board | |
| Charts:- Daily , Weekly | |
| Add QH to Watchlist: View: Get Complete QH Trend Analysis ➞ | |
 | BNR Burning Rock Biotech Limited |
| Sector: Health Care | |
| SubSector: Diagnostics & Research | |
| MarketCap: 27887 Millions | |
| Recent Price: 0.75 Smart Investing & Trading Score: 8 | |
| Day Percent Change: 0.00% Day Change: 0.00 | |
| Week Change: -12.02% Year-to-date Change: -22.5% | |
| BNR Links: Profile News Message Board | |
| Charts:- Daily , Weekly | |
| Add BNR to Watchlist: View: Get Complete BNR Trend Analysis ➞ | |
 | ATIF ATIF Holdings Limited |
| Sector: Financials | |
| SubSector: Asset Management | |
| MarketCap: 68.5203 Millions | |
| Recent Price: 0.95 Smart Investing & Trading Score: 68 | |
| Day Percent Change: 0.00% Day Change: 0.00 | |
| Week Change: 1.11% Year-to-date Change: -2.1% | |
| ATIF Links: Profile News Message Board | |
| Charts:- Daily , Weekly | |
| Add ATIF to Watchlist: View: Get Complete ATIF Trend Analysis ➞ | |
 | MOGU MOGU Inc. |
| Sector: Services & Goods | |
| SubSector: Specialty Retail, Other | |
| MarketCap: 168.844 Millions | |
| Recent Price: 1.83 Smart Investing & Trading Score: 7 | |
| Day Percent Change: 0.00% Day Change: 0.00 | |
| Week Change: -1.08% Year-to-date Change: -4.2% | |
| MOGU Links: Profile News Message Board | |
| Charts:- Daily , Weekly | |
| Add MOGU to Watchlist: View: Get Complete MOGU Trend Analysis ➞ | |
 | KRKR 36Kr Holdings Inc. |
| Sector: Technology | |
| SubSector: Internet Information Providers | |
| MarketCap: 173.18 Millions | |
| Recent Price: 0.35 Smart Investing & Trading Score: 10 | |
| Day Percent Change: -0.17% Day Change: 0.00 | |
| Week Change: -5.77% Year-to-date Change: -37.6% | |
| KRKR Links: Profile News Message Board | |
| Charts:- Daily , Weekly | |
| Add KRKR to Watchlist: View: Get Complete KRKR Trend Analysis ➞ | |
 | UXIN Uxin Limited |
| Sector: Technology | |
| SubSector: Internet Information Providers | |
| MarketCap: 414.58 Millions | |
| Recent Price: 1.95 Smart Investing & Trading Score: 64 | |
| Day Percent Change: 0.00% Day Change: 0.00 | |
| Week Change: 7.14% Year-to-date Change: 178.2% | |
| UXIN Links: Profile News Message Board | |
| Charts:- Daily , Weekly | |
| Add UXIN to Watchlist: View: Get Complete UXIN Trend Analysis ➞ | |
 | IMAB I Mab |
| Sector: Health Care | |
| SubSector: Biotechnology | |
| MarketCap: 26187 Millions | |
| Recent Price: 1.76 Smart Investing & Trading Score: 15 | |
| Day Percent Change: -0.28% Day Change: 0.00 | |
| Week Change: -2.22% Year-to-date Change: -7.4% | |
| IMAB Links: Profile News Message Board | |
| Charts:- Daily , Weekly | |
| Add IMAB to Watchlist: View: Get Complete IMAB Trend Analysis ➞ | |
 | YJ Yunji Inc. |
| Sector: Services & Goods | |
| SubSector: Specialty Retail, Other | |
| MarketCap: 770.644 Millions | |
| Recent Price: 0.82 Smart Investing & Trading Score: 66 | |
| Day Percent Change: 0.00% Day Change: 0.00 | |
| Week Change: 5.48% Year-to-date Change: 15.1% | |
| YJ Links: Profile News Message Board | |
| Charts:- Daily , Weekly | |
| Add YJ to Watchlist: View: Get Complete YJ Trend Analysis ➞ | |
 | DUO Fangdd Network Group Ltd. |
| Sector: Financials | |
| SubSector: Property Management | |
| MarketCap: 783.142 Millions | |
| Recent Price: 0.39 Smart Investing & Trading Score: 10 | |
| Day Percent Change: 0.00% Day Change: 0.00 | |
| Week Change: -2.4% Year-to-date Change: -42.1% | |
| DUO Links: Profile News Message Board | |
| Charts:- Daily , Weekly | |
| Add DUO to Watchlist: View: Get Complete DUO Trend Analysis ➞ | |
 | MSC Studio City International Holdings Limited |
| Sector: Services & Goods | |
| SubSector: Resorts & Casinos | |
| MarketCap: 1420.54 Millions | |
| Recent Price: 7.58 Smart Investing & Trading Score: 41 | |
| Day Percent Change: -0.02% Day Change: 0.00 | |
| Week Change: 6.54% Year-to-date Change: 17.0% | |
| MSC Links: Profile News Message Board | |
| Charts:- Daily , Weekly | |
| Add MSC to Watchlist: View: Get Complete MSC Trend Analysis ➞ | |
 | SVA Sinovac Biotech Ltd. |
| Sector: Health Care | |
| SubSector: Biotechnology | |
| MarketCap: 336.88 Millions | |
| Recent Price: 0.00 Smart Investing & Trading Score: 20 | |
| Day Percent Change: -100.00% Day Change: -6.47 | |
| Week Change: -100% Year-to-date Change: -100.0% | |
| SVA Links: Profile News Message Board | |
| Charts:- Daily , Weekly | |
| Add SVA to Watchlist: View: Get Complete SVA Trend Analysis ➞ | |
 | EBON Ebang International Holdings Inc. |
| Sector: Technology | |
| SubSector: Computer Hardware | |
| MarketCap: 33787 Millions | |
| Recent Price: 7.80 Smart Investing & Trading Score: 49 | |
| Day Percent Change: -3.70% Day Change: -0.30 | |
| Week Change: -0.06% Year-to-date Change: -48.9% | |
| EBON Links: Profile News Message Board | |
| Charts:- Daily , Weekly | |
| Add EBON to Watchlist: View: Get Complete EBON Trend Analysis ➞ | |
 | SRL Scully Royalty Ltd. |
| Sector: Financials | |
| SubSector: Asset Management | |
| MarketCap: 88.3203 Millions | |
| Recent Price: 6.21 Smart Investing & Trading Score: 15 | |
| Day Percent Change: -3.50% Day Change: -0.22 | |
| Week Change: -8.35% Year-to-date Change: 1.7% | |
| SRL Links: Profile News Message Board | |
| Charts:- Daily , Weekly | |
| Add SRL to Watchlist: View: Get Complete SRL Trend Analysis ➞ | |
 | LANV Lanvin Group Holdings Limited |
| Sector: Services & Goods | |
| SubSector: Luxury Goods | |
| MarketCap: 712 Millions | |
| Recent Price: 1.66 Smart Investing & Trading Score: 57 | |
| Day Percent Change: -8.79% Day Change: -0.16 | |
| Week Change: 5.06% Year-to-date Change: -45.8% | |
| LANV Links: Profile News Message Board | |
| Charts:- Daily , Weekly | |
| Add LANV to Watchlist: View: Get Complete LANV Trend Analysis ➞ | |
 | HKD AMTD Digital Inc. |
| Sector: Technology | |
| SubSector: Software - Application | |
| MarketCap: 1200 Millions | |
| Recent Price: 3.48 Smart Investing & Trading Score: 69 | |
| Day Percent Change: -4.40% Day Change: -0.16 | |
| Week Change: 7.41% Year-to-date Change: -15.7% | |
| HKD Links: Profile News Message Board | |
| Charts:- Daily , Weekly | |
| Add HKD to Watchlist: View: Get Complete HKD Trend Analysis ➞ | |
 | SDA SunCar Technology Group Inc. |
| Sector: Services & Goods | |
| SubSector: Auto & Truck Dealerships | |
| MarketCap: 2680 Millions | |
| Recent Price: 7.59 Smart Investing & Trading Score: 68 | |
| Day Percent Change: -1.88% Day Change: -0.15 | |
| Week Change: 4.48% Year-to-date Change: -2.4% | |
| SDA Links: Profile News Message Board | |
| Charts:- Daily , Weekly | |
| Add SDA to Watchlist: View: Get Complete SDA Trend Analysis ➞ | |
 | GHG GreenTree Hospitality Group Ltd. |
| Sector: Services & Goods | |
| SubSector: Lodging | |
| MarketCap: 1195.36 Millions | |
| Recent Price: 3.06 Smart Investing & Trading Score: 93 | |
| Day Percent Change: -4.38% Day Change: -0.14 | |
| Week Change: -1.29% Year-to-date Change: -18.6% | |
| GHG Links: Profile News Message Board | |
| Charts:- Daily , Weekly | |
| Add GHG to Watchlist: View: Get Complete GHG Trend Analysis ➞ | |
 | KNDI Kandi Technologies Group, Inc. |
| Sector: Consumer Staples | |
| SubSector: Auto Manufacturers - Major | |
| MarketCap: 137.471 Millions | |
| Recent Price: 2.42 Smart Investing & Trading Score: 42 | |
| Day Percent Change: -3.97% Day Change: -0.10 | |
| Week Change: -7.28% Year-to-date Change: -13.6% | |
| KNDI Links: Profile News Message Board | |
| Charts:- Daily , Weekly | |
| Add KNDI to Watchlist: View: Get Complete KNDI Trend Analysis ➞ | |
 | STG Sunlands Technology Group |
| Sector: Services & Goods | |
| SubSector: Education & Training Services | |
| MarketCap: 295.706 Millions | |
| Recent Price: 7.90 Smart Investing & Trading Score: 32 | |
| Day Percent Change: -1.13% Day Change: -0.09 | |
| Week Change: -0.69% Year-to-date Change: -22.3% | |
| STG Links: Profile News Message Board | |
| Charts:- Daily , Weekly | |
| Add STG to Watchlist: View: Get Complete STG Trend Analysis ➞ | |
 | CMCM Cheetah Mobile Inc. |
| Sector: Technology | |
| SubSector: Application Software | |
| MarketCap: 343.362 Millions | |
| Recent Price: 3.98 Smart Investing & Trading Score: 58 | |
| Day Percent Change: -1.97% Day Change: -0.08 | |
| Week Change: -6.57% Year-to-date Change: 74.6% | |
| CMCM Links: Profile News Message Board | |
| Charts:- Daily , Weekly | |
| Add CMCM to Watchlist: View: Get Complete CMCM Trend Analysis ➞ | |
 | CCM Concord Medical Services Holdings Limited |
| Sector: Health Care | |
| SubSector: Hospitals | |
| MarketCap: 138.646 Millions | |
| Recent Price: 0.70 Smart Investing & Trading Score: 90 | |
| Day Percent Change: -8.29% Day Change: -0.06 | |
| Week Change: 18.6% Year-to-date Change: -36.4% | |
| CCM Links: Profile News Message Board | |
| Charts:- Daily , Weekly | |
| Add CCM to Watchlist: View: Get Complete CCM Trend Analysis ➞ | |
 | COE China Online Education Group |
| Sector: Services & Goods | |
| SubSector: Education & Training Services | |
| MarketCap: 643.406 Millions | |
| Recent Price: 6.96 Smart Investing & Trading Score: 73 | |
| Day Percent Change: -0.57% Day Change: -0.04 | |
| Week Change: 5.3% Year-to-date Change: -13.3% | |
| COE Links: Profile News Message Board | |
| Charts:- Daily , Weekly | |
| Add COE to Watchlist: View: Get Complete COE Trend Analysis ➞ | |
| For tabular summary view of above stock list: Summary View ➞ 0 - 25 , 25 - 50 , 50 - 75 , 75 - 100 , 100 - 125 , 125 - 150 | ||
| Click To Change The Sort Order: By Market Cap or Company Size Performance: Year-to-date, Week and Day | |
| Select Chart Type: | ||
|
Best Stocks Today 12Stocks.com |
© 2024 12Stocks.com Terms & Conditions Privacy Contact Us
All Information Provided Only For Education And Not To Be Used For Investing or Trading. See Terms & Conditions


One More Thing ... Get Best Stocks Delivered Daily!
Never Ever Miss A Move With Our Top Ten Stocks Lists
Find Best Stocks In Any Market - Bull or Bear Market
Take A Peek At Our Top Ten Stocks Lists: Daily, Weekly, Year-to-Date & Top Trends
Find Best Stocks In Any Market - Bull or Bear Market
Take A Peek At Our Top Ten Stocks Lists: Daily, Weekly, Year-to-Date & Top Trends
China Stocks With Best Up Trends [0-bearish to 100-bullish]: KE [100], JD.com [100], 21Vianet [100], MINISO [100], Smart Share[100], Noah [100], Baidu [100], Alibaba [100], Hesai [100], Niu [100], Full Truck[100]
Best China Stocks Year-to-Date:
U Power[2974.78%], DouYu [852.63%], MicroCloud Hologram[635.25%], China Liberal[487.25%], Yatsen Holding[475.45%], Zhongchao [388.91%], Uxin [178.17%], QuantaSing [101.23%], GigaCloud [89.46%], Yiren Digital[74.68%], Cheetah Mobile[74.56%] Best China Stocks This Week:
Smart Share[39.89%], NIO [24.5%], Huize Holding[22.6%], 21Vianet [21.2%], XPeng [19.9%], Regencell Bioscience[19.44%], Viomi [17.87%], Dingdong (Cayman)[17.86%], Li Auto[15.79%], Golden Heaven[15.1%], GDS [14.11%] Best China Stocks Daily:
Regencell Bioscience[21.25%], XPeng [15.76%], Bilibili [15.63%], Huize Holding[13.61%], KE [12.64%], JD.com [11.62%], Kingsoft Cloud[11.54%], Pinduoduo [10.51%], Boqii Holding[10.40%], 21Vianet [10.06%], Li Auto[10.04%]