
 Login Sign Up


| |||||
 |  | ||||

| 12Stocks.com Market Intelligence |
Best China Stocks
|
On this page, you will find the most comprehensive analysis of Chinese stocks and ETFs - from latest trends to performances to charts ➞. First, here are the year-to-date (YTD) performances of the most requested China stocks at 12Stocks.com (click stock for review):
| Sohu.com 13% | ||
| NetEase 1% | ||
| New Oriental 0% | ||
| JD.com -2% | ||
| Alibaba -5% | ||
| Vipshop -10% | ||
| JOYY -16% | ||
| Baidu -17% | ||
| Weibo -24% | ||
| In a hurry? China Stocks Lists: Performance Trends Table, Stock Charts
Sort China stocks: Daily, Weekly, Year-to-Date, Market Cap & Trends. Filter China stocks list by sector: Show all, Tech, Finance, Energy, Staples, Retail, Industrial, Materials, Utilities and HealthCare Filter China stocks list by size: All China Large Medium Small and MicroCap |
| April 24, 2024 - 12Stocks.com China Stocks Performances & Trends Daily | |||||||||
|
|  The overall Smart Investing & Trading Score is 100 (0-bearish to 100-bullish) which puts China index in short term bullish trend. The Smart Investing & Trading Score from previous trading session is 74 and an improvement of trend continues.
| ||||||||
| Here are the Smart Investing & Trading Scores of the most requested China stocks at 12Stocks.com (click stock name for detailed review): |


| 12Stocks.com: Top Performing China Index Stocks | ||||||||||||||||||||||||||||||||||||||||||||||||
 The top performing China Index stocks year to date are
Now, more recently, over last week, the top performing China Index stocks on the move are


|
||||||||||||||||||||||||||||||||||||||||||||||||
| 12Stocks.com: Investing in China Index with Stocks | |
|
The following table helps investors and traders sort through current performance and trends (as measured by Smart Investing & Trading Score) of various
stocks in the China Index. Quick View: Move mouse or cursor over stock symbol (ticker) to view short-term technical chart and over stock name to view long term chart. Click on  to add stock symbol to your watchlist and to add stock symbol to your watchlist and  to view watchlist. Click on any ticker or stock name for detailed market intelligence report for that stock. to view watchlist. Click on any ticker or stock name for detailed market intelligence report for that stock. |
12Stocks.com Performance of Stocks in China Index
| Ticker | Stock Name | Watchlist | Category | Recent Price | Smart Investing & Trading Score | Change % | YTD Change% |
| WIMI | WiMi Hologram |   | Technology | 0.84 | 70 | 16.49 | 4.97% |
| ICG | Intchains | | Technology | 8.80 | 38 | 7.71 | -28.46% |
| YSG | Yatsen Holding | | Services & Goods | 4.23 | 95 | 7.63 | 478.18% |
| HKD | AMTD Digital | | Technology | 3.27 | 52 | 4.81 | -20.82% |
| YQ | 17 Education | | Consumer Staples | 2.46 | 36 | 4.68 | 20.59% |
| BGNE | BeiGene | | Health Care | 145.33 | 42 | 4.56 | -19.42% |
| YGMZ | MingZhu Logistics | | Industrials | 0.42 | 25 | 4.18 | -10.26% |
| IH | iHuman | | Consumer Staples | 1.77 | 20 | 4.12 | -41.97% |
| GDS | GDS | | Technology | 7.04 | 80 | 4.06 | -22.75% |
| LU | Lufax Holding | | Financials | 4.53 | 83 | 3.78 | 47.39% |
| BZUN | Baozun | | Services & Goods | 2.63 | 95 | 3.14 | -4.01% |
| ZTO | ZTO Express | | Transports | 20.82 | 75 | 2.87 | -2.16% |
| JD | JD.com | | Technology | 28.32 | 100 | 2.78 | -1.99% |
| WB | | Technology | 8.35 | 65 | 2.71 | -23.74% | |
| YRD | Yiren Digital | | Financials | 5.15 | 78 | 2.59 | 65.06% |
| ATAT | Atour Lifestyle | | Services & Goods | 18.18 | 51 | 2.36 | 3.77% |
| YMM | Full Truck | | Technology | 8.34 | 100 | 2.14 | 19.16% |
| VNET | 21Vianet | | Technology | 1.51 | 15 | 2.03 | -47.39% |
| BABA | Alibaba | | Services & Goods | 73.91 | 82 | 1.93 | -4.64% |
| DADA | Dada Nexus | | Services & Goods | 1.90 | 25 | 1.88 | -42.92% |
| DDL | Dingdong (Cayman) | | Consumer Staples | 1.24 | 47 | 1.64 | -18.42% |
| MNSO | MINISO | | Services & Goods | 22.39 | 100 | 1.57 | 9.73% |
| DQ | Daqo New | | Technology | 23.37 | 68 | 1.56 | -12.14% |
| VIPS | Vipshop | | Services & Goods | 16.02 | 45 | 1.46 | -9.80% |
| MOMO | Momo | | Technology | 5.80 | 42 | 1.40 | -16.55% |
| For chart view version of above stock list: Chart View ➞ 0 - 25 , 25 - 50 , 50 - 75 , 75 - 100 | ||
 | Click To Change The Sort Order: By Market Cap or Company Size Performance: Year-to-date, Week and Day |  |
|
Get the most comprehensive stock market coverage daily at 12Stocks.com ➞ Best Stocks Today ➞ Best Stocks Weekly ➞ Best Stocks Year-to-Date ➞ Best Stocks Trends ➞  Best Stocks Today 12Stocks.com Best Nasdaq Stocks ➞ Best S&P 500 Stocks ➞ Best Tech Stocks ➞ Best Biotech Stocks ➞ |
| Detailed Overview of China Stocks |
| China Technical Overview, Leaders & Laggards, Top China ETF Funds & Detailed China Stocks List, Charts, Trends & More |
| China: Technical Analysis, Trends & YTD Performance | |
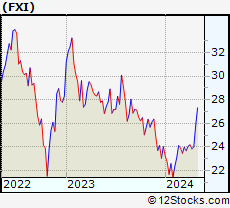
 FXI Weekly Chart |
|
| Long Term Trend: Very Good | |
| Medium Term Trend: Very Good | |
 FXI Daily Chart |
|
| Short Term Trend: Very Good | |
| Overall Trend Score: 100 | |
| YTD Performance: 4.83% | |
| **Trend Scores & Views Are Only For Educational Purposes And Not For Investing | |
| 12Stocks.com: Investing in China Index using Exchange Traded Funds | |
|
The following table shows list of key exchange traded funds (ETF) that
help investors play China stock market. For detailed view, check out our ETF Funds section of our website. Quick View: Move mouse or cursor over ETF symbol (ticker) to view short-term technical chart and over ETF name to view long term chart. Click on ticker or stock name for detailed view. Click on to add stock symbol to your watchlist and to view watchlist. |
12Stocks.com List of ETFs that track China Index
| Ticker | ETF Name | Watchlist | Recent Price | Smart Investing & Trading Score | Change % | Week % | Year-to-date % |
| FXI | China Large-Cap | | 25.19 | 100 | 1.57 | 4.91 | 4.83% |
| EWH | Hong Kong | | 15.47 | 59 | 1.41 | 5.2 | -10.97% |
| YINN | China Bull 3X | | 21.47 | 100 | 4.73 | 14.38 | 2.53% |
| YANG | China Bear 3X | | 10.11 | 0 | -4.62 | -13.37 | -21.02% |
| XPP | China 50 | | 14.25 | 100 | 3.26 | 9.89 | 3.67% |
| MCHI | China | | 41.22 | 100 | 1.24 | 4.58 | 1.17% |
| 12Stocks.com: Charts, Trends, Fundamental Data and Performances of China Stocks | |
|
We now take in-depth look at all China stocks including charts, multi-period performances and overall trends (as measured by Smart Investing & Trading Score). One can sort China stocks (click link to choose) by Daily, Weekly and by Year-to-Date performances. Also, one can sort by size of the company or by market capitalization. |
| Select Your Default Chart Type: | |||||
| |||||
| Click on stock symbol or name for detailed view. Click on to add stock symbol to your watchlist and to view watchlist. Quick View: Move mouse or cursor over "Daily" to quickly view daily technical stock chart and over "Weekly" to view weekly technical stock chart. | |||||

 | WIMI WiMi Hologram Cloud Inc. |
| Sector: Technology | |
| SubSector: Advertising Agencies | |
| MarketCap: 41837 Millions | |
| Recent Price: 0.84 Smart Investing & Trading Score: 70 | |
| Day Percent Change: 16.49% Day Change: 0.12 | |
| Week Change: 21.13% Year-to-date Change: 5.0% | |
| WIMI Links: Profile News Message Board | |
| Charts:- Daily , Weekly | |
| Add WIMI to Watchlist: View: Get Complete WIMI Trend Analysis ➞ | |
 | ICG Intchains Group Limited |
| Sector: Technology | |
| SubSector: Semiconductors | |
| MarketCap: 450 Millions | |
| Recent Price: 8.80 Smart Investing & Trading Score: 38 | |
| Day Percent Change: 7.71% Day Change: 0.63 | |
| Week Change: 6.02% Year-to-date Change: -28.5% | |
| ICG Links: Profile News Message Board | |
| Charts:- Daily , Weekly | |
| Add ICG to Watchlist: View: Get Complete ICG Trend Analysis ➞ | |
 | YSG Yatsen Holding Limited |
| Sector: Services & Goods | |
| SubSector: Specialty Retail | |
| MarketCap: 11827 Millions | |
| Recent Price: 4.23 Smart Investing & Trading Score: 95 | |
| Day Percent Change: 7.63% Day Change: 0.30 | |
| Week Change: 17.01% Year-to-date Change: 478.2% | |
| YSG Links: Profile News Message Board | |
| Charts:- Daily , Weekly | |
| Add YSG to Watchlist: View: Get Complete YSG Trend Analysis ➞ | |
 | HKD AMTD Digital Inc. |
| Sector: Technology | |
| SubSector: Software - Application | |
| MarketCap: 1200 Millions | |
| Recent Price: 3.27 Smart Investing & Trading Score: 52 | |
| Day Percent Change: 4.81% Day Change: 0.15 | |
| Week Change: 6.17% Year-to-date Change: -20.8% | |
| HKD Links: Profile News Message Board | |
| Charts:- Daily , Weekly | |
| Add HKD to Watchlist: View: Get Complete HKD Trend Analysis ➞ | |
 | YQ 17 Education & Technology Group Inc. |
| Sector: Consumer Staples | |
| SubSector: Education & Training Services | |
| MarketCap: 32347 Millions | |
| Recent Price: 2.46 Smart Investing & Trading Score: 36 | |
| Day Percent Change: 4.68% Day Change: 0.11 | |
| Week Change: -0.2% Year-to-date Change: 20.6% | |
| YQ Links: Profile News Message Board | |
| Charts:- Daily , Weekly | |
| Add YQ to Watchlist: View: Get Complete YQ Trend Analysis ➞ | |
 | BGNE BeiGene, Ltd. |
| Sector: Health Care | |
| SubSector: Biotechnology | |
| MarketCap: 10838.5 Millions | |
| Recent Price: 145.33 Smart Investing & Trading Score: 42 | |
| Day Percent Change: 4.56% Day Change: 6.34 | |
| Week Change: 12.21% Year-to-date Change: -19.4% | |
| BGNE Links: Profile News Message Board | |
| Charts:- Daily , Weekly | |
| Add BGNE to Watchlist: View: Get Complete BGNE Trend Analysis ➞ | |
 | YGMZ MingZhu Logistics Holdings Limited |
| Sector: Industrials | |
| SubSector: Trucking | |
| MarketCap: 41627 Millions | |
| Recent Price: 0.42 Smart Investing & Trading Score: 25 | |
| Day Percent Change: 4.18% Day Change: 0.02 | |
| Week Change: -9.77% Year-to-date Change: -10.3% | |
| YGMZ Links: Profile News Message Board | |
| Charts:- Daily , Weekly | |
| Add YGMZ to Watchlist: View: Get Complete YGMZ Trend Analysis ➞ | |
 | IH iHuman Inc. |
| Sector: Consumer Staples | |
| SubSector: Education & Training Services | |
| MarketCap: 12247 Millions | |
| Recent Price: 1.77 Smart Investing & Trading Score: 20 | |
| Day Percent Change: 4.12% Day Change: 0.07 | |
| Week Change: 2.19% Year-to-date Change: -42.0% | |
| IH Links: Profile News Message Board | |
| Charts:- Daily , Weekly | |
| Add IH to Watchlist: View: Get Complete IH Trend Analysis ➞ | |
 | GDS GDS Holdings Limited |
| Sector: Technology | |
| SubSector: Data Storage Devices | |
| MarketCap: 8597.99 Millions | |
| Recent Price: 7.04 Smart Investing & Trading Score: 80 | |
| Day Percent Change: 4.06% Day Change: 0.28 | |
| Week Change: 11.47% Year-to-date Change: -22.8% | |
| GDS Links: Profile News Message Board | |
| Charts:- Daily , Weekly | |
| Add GDS to Watchlist: View: Get Complete GDS Trend Analysis ➞ | |
 | LU Lufax Holding Ltd |
| Sector: Financials | |
| SubSector: Credit Services | |
| MarketCap: 33457 Millions | |
| Recent Price: 4.53 Smart Investing & Trading Score: 83 | |
| Day Percent Change: 3.78% Day Change: 0.17 | |
| Week Change: 4.02% Year-to-date Change: 47.4% | |
| LU Links: Profile News Message Board | |
| Charts:- Daily , Weekly | |
| Add LU to Watchlist: View: Get Complete LU Trend Analysis ➞ | |
 | BZUN Baozun Inc. |
| Sector: Services & Goods | |
| SubSector: Catalog & Mail Order Houses | |
| MarketCap: 1668.92 Millions | |
| Recent Price: 2.63 Smart Investing & Trading Score: 95 | |
| Day Percent Change: 3.14% Day Change: 0.08 | |
| Week Change: 13.36% Year-to-date Change: -4.0% | |
| BZUN Links: Profile News Message Board | |
| Charts:- Daily , Weekly | |
| Add BZUN to Watchlist: View: Get Complete BZUN Trend Analysis ➞ | |
 | ZTO ZTO Express (Cayman) Inc. |
| Sector: Transports | |
| SubSector: Air Delivery & Freight Services | |
| MarketCap: 20507 Millions | |
| Recent Price: 20.82 Smart Investing & Trading Score: 75 | |
| Day Percent Change: 2.87% Day Change: 0.58 | |
| Week Change: 4.41% Year-to-date Change: -2.2% | |
| ZTO Links: Profile News Message Board | |
| Charts:- Daily , Weekly | |
| Add ZTO to Watchlist: View: Get Complete ZTO Trend Analysis ➞ | |
 | JD JD.com, Inc. |
| Sector: Technology | |
| SubSector: Internet Information Providers | |
| MarketCap: 59907.3 Millions | |
| Recent Price: 28.32 Smart Investing & Trading Score: 100 | |
| Day Percent Change: 2.78% Day Change: 0.77 | |
| Week Change: 11% Year-to-date Change: -2.0% | |
| JD Links: Profile News Message Board | |
| Charts:- Daily , Weekly | |
| Add JD to Watchlist: View: Get Complete JD Trend Analysis ➞ | |
 | WB Weibo Corporation |
| Sector: Technology | |
| SubSector: Internet Information Providers | |
| MarketCap: 8164.6 Millions | |
| Recent Price: 8.35 Smart Investing & Trading Score: 65 | |
| Day Percent Change: 2.71% Day Change: 0.22 | |
| Week Change: 5.7% Year-to-date Change: -23.7% | |
| WB Links: Profile News Message Board | |
| Charts:- Daily , Weekly | |
| Add WB to Watchlist: View: Get Complete WB Trend Analysis ➞ | |
 | YRD Yiren Digital Ltd. |
| Sector: Financials | |
| SubSector: Credit Services | |
| MarketCap: 330.208 Millions | |
| Recent Price: 5.15 Smart Investing & Trading Score: 78 | |
| Day Percent Change: 2.59% Day Change: 0.13 | |
| Week Change: 6.63% Year-to-date Change: 65.1% | |
| YRD Links: Profile News Message Board | |
| Charts:- Daily , Weekly | |
| Add YRD to Watchlist: View: Get Complete YRD Trend Analysis ➞ | |
 | ATAT Atour Lifestyle Holdings Limited |
| Sector: Services & Goods | |
| SubSector: Lodging | |
| MarketCap: 2120 Millions | |
| Recent Price: 18.18 Smart Investing & Trading Score: 51 | |
| Day Percent Change: 2.36% Day Change: 0.42 | |
| Week Change: 5.45% Year-to-date Change: 3.8% | |
| ATAT Links: Profile News Message Board | |
| Charts:- Daily , Weekly | |
| Add ATAT to Watchlist: View: Get Complete ATAT Trend Analysis ➞ | |
 | YMM Full Truck Alliance Co. Ltd. |
| Sector: Technology | |
| SubSector: Software - Application | |
| MarketCap: 6960 Millions | |
| Recent Price: 8.34 Smart Investing & Trading Score: 100 | |
| Day Percent Change: 2.14% Day Change: 0.18 | |
| Week Change: 7.27% Year-to-date Change: 19.2% | |
| YMM Links: Profile News Message Board | |
| Charts:- Daily , Weekly | |
| Add YMM to Watchlist: View: Get Complete YMM Trend Analysis ➞ | |
 | VNET 21Vianet Group, Inc. |
| Sector: Technology | |
| SubSector: Information Technology Services | |
| MarketCap: 1846.98 Millions | |
| Recent Price: 1.51 Smart Investing & Trading Score: 15 | |
| Day Percent Change: 2.03% Day Change: 0.03 | |
| Week Change: 1.34% Year-to-date Change: -47.4% | |
| VNET Links: Profile News Message Board | |
| Charts:- Daily , Weekly | |
| Add VNET to Watchlist: View: Get Complete VNET Trend Analysis ➞ | |
 | BABA Alibaba Group Holding Limited |
| Sector: Services & Goods | |
| SubSector: Specialty Retail, Other | |
| MarketCap: 522666 Millions | |
| Recent Price: 73.91 Smart Investing & Trading Score: 82 | |
| Day Percent Change: 1.93% Day Change: 1.40 | |
| Week Change: 7.01% Year-to-date Change: -4.6% | |
| BABA Links: Profile News Message Board | |
| Charts:- Daily , Weekly | |
| Add BABA to Watchlist: View: Get Complete BABA Trend Analysis ➞ | |
 | DADA Dada Nexus Limited |
| Sector: Services & Goods | |
| SubSector: Internet Retail | |
| MarketCap: 98527 Millions | |
| Recent Price: 1.90 Smart Investing & Trading Score: 25 | |
| Day Percent Change: 1.88% Day Change: 0.03 | |
| Week Change: 0.53% Year-to-date Change: -42.9% | |
| DADA Links: Profile News Message Board | |
| Charts:- Daily , Weekly | |
| Add DADA to Watchlist: View: Get Complete DADA Trend Analysis ➞ | |
 | DDL Dingdong (Cayman) Limited |
| Sector: Consumer Staples | |
| SubSector: Grocery Stores | |
| MarketCap: 708 Millions | |
| Recent Price: 1.24 Smart Investing & Trading Score: 47 | |
| Day Percent Change: 1.64% Day Change: 0.02 | |
| Week Change: 7.83% Year-to-date Change: -18.4% | |
| DDL Links: Profile News Message Board | |
| Charts:- Daily , Weekly | |
| Add DDL to Watchlist: View: Get Complete DDL Trend Analysis ➞ | |
 | MNSO MINISO Group Holding Limited |
| Sector: Services & Goods | |
| SubSector: Specialty Retail | |
| MarketCap: 69427 Millions | |
| Recent Price: 22.39 Smart Investing & Trading Score: 100 | |
| Day Percent Change: 1.57% Day Change: 0.35 | |
| Week Change: 9.17% Year-to-date Change: 9.7% | |
| MNSO Links: Profile News Message Board | |
| Charts:- Daily , Weekly | |
| Add MNSO to Watchlist: View: Get Complete MNSO Trend Analysis ➞ | |
 | DQ Daqo New Energy Corp. |
| Sector: Technology | |
| SubSector: Semiconductor Equipment & Materials | |
| MarketCap: 660.918 Millions | |
| Recent Price: 23.37 Smart Investing & Trading Score: 68 | |
| Day Percent Change: 1.56% Day Change: 0.36 | |
| Week Change: 5.7% Year-to-date Change: -12.1% | |
| DQ Links: Profile News Message Board | |
| Charts:- Daily , Weekly | |
| Add DQ to Watchlist: View: Get Complete DQ Trend Analysis ➞ | |
 | VIPS Vipshop Holdings Limited |
| Sector: Services & Goods | |
| SubSector: Catalog & Mail Order Houses | |
| MarketCap: 10496.2 Millions | |
| Recent Price: 16.02 Smart Investing & Trading Score: 45 | |
| Day Percent Change: 1.46% Day Change: 0.23 | |
| Week Change: 5.67% Year-to-date Change: -9.8% | |
| VIPS Links: Profile News Message Board | |
| Charts:- Daily , Weekly | |
| Add VIPS to Watchlist: View: Get Complete VIPS Trend Analysis ➞ | |
 | MOMO Momo Inc. |
| Sector: Technology | |
| SubSector: Internet Software & Services | |
| MarketCap: 4796.71 Millions | |
| Recent Price: 5.80 Smart Investing & Trading Score: 42 | |
| Day Percent Change: 1.40% Day Change: 0.08 | |
| Week Change: 3.76% Year-to-date Change: -16.6% | |
| MOMO Links: Profile News Message Board | |
| Charts:- Daily , Weekly | |
| Add MOMO to Watchlist: View: Get Complete MOMO Trend Analysis ➞ | |
| For tabular summary view of above stock list: Summary View ➞ 0 - 25 , 25 - 50 , 50 - 75 , 75 - 100 | ||
| Click To Change The Sort Order: By Market Cap or Company Size Performance: Year-to-date, Week and Day | |
| Select Chart Type: | ||
|
Best Stocks Today 12Stocks.com |
© 2024 12Stocks.com Terms & Conditions Privacy Contact Us
All Information Provided Only For Education And Not To Be Used For Investing or Trading. See Terms & Conditions


One More Thing ... Get Best Stocks Delivered Daily!
Never Ever Miss A Move With Our Top Ten Stocks Lists
Find Best Stocks In Any Market - Bull or Bear Market
Take A Peek At Our Top Ten Stocks Lists: Daily, Weekly, Year-to-Date & Top Trends
Find Best Stocks In Any Market - Bull or Bear Market
Take A Peek At Our Top Ten Stocks Lists: Daily, Weekly, Year-to-Date & Top Trends
China Stocks With Best Up Trends [0-bearish to 100-bullish]: JD.com [100], Full Truck[100], MINISO [100], Yatsen Holding[95], Baozun [95], Xunlei [90], TAL Education[90], New Oriental[90], Cheetah Mobile[88], Yum China[85], Lufax Holding[83]
Best China Stocks Year-to-Date:
U Power[2785.04%], MicroCloud Hologram[616.55%], China Liberal[498.43%], Yatsen Holding[478.18%], Zhongchao [347.82%], QuantaSing [104.32%], GigaCloud [100.44%], Cheetah Mobile[78.07%], Yiren Digital[65.06%], Lufax Holding[47.39%], Smart Share[21.55%] Best China Stocks This Week:
WiMi Hologram[21.13%], Yatsen Holding[17.01%], Cheetah Mobile[14.69%], Baozun [13.36%], BeiGene [12.21%], GDS [11.47%], JD.com [11%], Tuya [10.19%], MINISO [9.17%], KE [8.42%], Hywin [8.3%] Best China Stocks Daily:
WiMi Hologram[16.49%], Intchains [7.71%], Yatsen Holding[7.63%], AMTD Digital[4.81%], 17 Education[4.68%], BeiGene [4.56%], MingZhu Logistics[4.18%], iHuman [4.12%], GDS [4.06%], Lufax Holding[3.78%], Baozun [3.14%]