
 Login Sign Up


| |||||
 |  | ||||

| 12Stocks.com Market Intelligence |
Best China Stocks
|
On this page, you will find the most comprehensive analysis of Chinese stocks and ETFs - from latest trends to performances to charts ➞. First, here are the year-to-date (YTD) performances of the most requested China stocks at 12Stocks.com (click stock for review):
| Sohu.com 19% | ||
| JD.com 13% | ||
| New Oriental 10% | ||
| NetEase 6% | ||
| Alibaba 4% | ||
| Baidu -6% | ||
| Vipshop -10% | ||
| JOYY -15% | ||
| Weibo -15% | ||
| In a hurry? China Stocks Lists: Performance Trends Table, Stock Charts
Sort China stocks: Daily, Weekly, Year-to-Date, Market Cap & Trends. Filter China stocks list by sector: Show all, Tech, Finance, Energy, Staples, Retail, Industrial, Materials, Utilities and HealthCare Filter China stocks list by size: All China Large Medium Small and MicroCap |
| May 2, 2024 - 12Stocks.com China Stocks Performances & Trends Daily | |||||||||
|
|  The overall Smart Investing & Trading Score is 100 (0-bearish to 100-bullish) which puts China index in short term bullish trend. The Smart Investing & Trading Score from previous trading session is 83 and hence an improvement of trend.
| ||||||||
| Here are the Smart Investing & Trading Scores of the most requested China stocks at 12Stocks.com (click stock name for detailed review): |

| 12Stocks.com: Top Performing China Index Stocks | ||||||||||||||||||||||||||||||||||||||||||||||||
 The top performing China Index stocks year to date are
Now, more recently, over last week, the top performing China Index stocks on the move are


|
||||||||||||||||||||||||||||||||||||||||||||||||
| 12Stocks.com: Investing in China Index with Stocks | |
|
The following table helps investors and traders sort through current performance and trends (as measured by Smart Investing & Trading Score) of various
stocks in the China Index. Quick View: Move mouse or cursor over stock symbol (ticker) to view short-term technical chart and over stock name to view long term chart. Click on  to add stock symbol to your watchlist and to add stock symbol to your watchlist and  to view watchlist. Click on any ticker or stock name for detailed market intelligence report for that stock. to view watchlist. Click on any ticker or stock name for detailed market intelligence report for that stock. |
12Stocks.com Performance of Stocks in China Index
| Ticker | Stock Name | Watchlist | Category | Recent Price | Smart Investing & Trading Score | Change % | YTD Change% |
| DADA | Dada Nexus |   | Services & Goods | 2.18 | 93 | 7.92% | -34.34% |
| FINV | FinVolution | | Financials | 5.03 | 49 | 3.29% | 2.65% |
| HUYA | HUYA | | Services & Goods | 4.75 | 63 | 3.49% | 29.78% |
| QSG | QuantaSing | | Consumer Staples | 3.26 | 27 | 4.82% | 101.23% |
| ZCMD | Zhongchao | | Health Care | 1.78 | 22 | 8.18% | 388.91% |
| JG | Aurora Mobile | | Technology | 3.09 | 61 | 4.75% | 8.35% |
| JFIN | Jiayin | | Technology | 6.39 | 43 | 2.08% | 23.36% |
| FANH | Fanhua | | Financials | 3.41 | 42 | 3.96% | -48.72% |
| HOLI | Hollysys Automation | | Industrials | 23.64 | 17 | 0.51% | -10.28% |
| OCFT | OneConnect Financial | | Technology | 2.16 | 64 | 5.88% | -31.43% |
| LX | LexinFintech | | Financials | 1.79 | 29 | 6.55% | -2.72% |
| AIXI | Xiao-I | | Technology | 1.33 | 42 | 8.57% | -40.89% |
| APM | Aptorum | | Health Care | 5.60 | 63 | 1.82% | 128.70% |
| NIU | Niu | | Consumer Staples | 2.38 | 100 | 4.61% | 8.90% |
| HUIZ | Huize Holding | | Financials | 0.75 | 90 | 13.61% | -16.22% |
| DDL | Dingdong (Cayman) | | Consumer Staples | 1.49 | 90 | 5.32% | -2.30% |
| IQ | iQIYI | | Technology | 5.09 | 75 | 1.70% | 4.20% |
| EM | Smart Share | | Services & Goods | 0.87 | 100 | 8.63% | 68.74% |
| XNET | Xunlei | | Technology | 1.63 | 78 | 4.84% | 0.31% |
| XIN | Xinyuan Real | | Financials | 2.68 | 0 | 2.10% | -1.47% |
| YSG | Yatsen Holding | | Services & Goods | 4.21 | 56 | 1.45% | 475.45% |
| AGMH | AGM | | Technology | 1.12 | 32 | 5.66% | -38.12% |
| RERE | ATRenew | | Services & Goods | 2.12 | 100 | 2.17% | 11.90% |
| RLX | RLX | | Consumer Staples | 1.96 | 44 | 2.62% | -1.01% |
| CNF | CNFinance | | Financials | 1.85 | 57 | 2.78% | -16.67% |
| For chart view version of above stock list: Chart View ➞ 0 - 25 , 25 - 50 , 50 - 75 , 75 - 100 , 100 - 125 , 125 - 150 | ||
 | Click To Change The Sort Order: By Market Cap or Company Size Performance: Year-to-date, Week and Day |  |
|
Get the most comprehensive stock market coverage daily at 12Stocks.com ➞ Best Stocks Today ➞ Best Stocks Weekly ➞ Best Stocks Year-to-Date ➞ Best Stocks Trends ➞  Best Stocks Today 12Stocks.com Best Nasdaq Stocks ➞ Best S&P 500 Stocks ➞ Best Tech Stocks ➞ Best Biotech Stocks ➞ |
| Detailed Overview of China Stocks |
| China Technical Overview, Leaders & Laggards, Top China ETF Funds & Detailed China Stocks List, Charts, Trends & More |
| China: Technical Analysis, Trends & YTD Performance | |
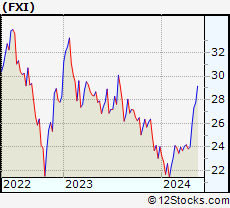
 FXI Weekly Chart |
|
| Long Term Trend: Very Good | |
| Medium Term Trend: Very Good | |
 FXI Daily Chart |
|
| Short Term Trend: Very Good | |
| Overall Trend Score: 100 | |
| YTD Performance: 12.98% | |
| **Trend Scores & Views Are Only For Educational Purposes And Not For Investing | |
| 12Stocks.com: Investing in China Index using Exchange Traded Funds | |
|
The following table shows list of key exchange traded funds (ETF) that
help investors play China stock market. For detailed view, check out our ETF Funds section of our website. Quick View: Move mouse or cursor over ETF symbol (ticker) to view short-term technical chart and over ETF name to view long term chart. Click on ticker or stock name for detailed view. Click on to add stock symbol to your watchlist and to view watchlist. |
12Stocks.com List of ETFs that track China Index
| Ticker | ETF Name | Watchlist | Recent Price | Smart Investing & Trading Score | Change % | Week % | Year-to-date % |
| FXI | China Large-Cap | | 27.15 | 100 | 5.72 | 4.95 | 12.98% |
| EWH | Hong Kong | | 16.79 | 100 | 4.09 | 5.07 | -3.34% |
| YINN | China Bull 3X | | 26.39 | 100 | 16.46 | 13.7 | 26.03% |
| YANG | China Bear 3X | | 7.95 | 0 | -16.40 | -14.88 | -37.89% |
| XPP | China 50 | | 16.38 | 100 | 10.71 | 8.98 | 19.17% |
| MCHI | China | | 44.47 | 100 | 5.45 | 5.01 | 9.16% |
| GXC | China | | 72.73 | 100 | 5.09 | 4.74 | 6.77% |
| CBON | ChinaAMC China Bond | | 21.98 | 65 | 0.41 | 0.64 | -0.54% |
| 12Stocks.com: Charts, Trends, Fundamental Data and Performances of China Stocks | |
|
We now take in-depth look at all China stocks including charts, multi-period performances and overall trends (as measured by Smart Investing & Trading Score). One can sort China stocks (click link to choose) by Daily, Weekly and by Year-to-Date performances. Also, one can sort by size of the company or by market capitalization. |
| Select Your Default Chart Type: | |||||
| |||||
| Click on stock symbol or name for detailed view. Click on to add stock symbol to your watchlist and to view watchlist. Quick View: Move mouse or cursor over "Daily" to quickly view daily technical stock chart and over "Weekly" to view weekly technical stock chart. | |||||

 | DADA Dada Nexus Limited |
| Sector: Services & Goods | |
| SubSector: Internet Retail | |
| MarketCap: 98527 Millions | |
| Recent Price: 2.18 Smart Investing & Trading Score: 93 | |
| Day Percent Change: 7.92% Day Change: 0.16 | |
| Week Change: 8.46% Year-to-date Change: -34.3% | |
| DADA Links: Profile News Message Board | |
| Charts:- Daily , Weekly | |
| Add DADA to Watchlist: View: Get Complete DADA Trend Analysis ➞ | |
 | FINV FinVolution Group |
| Sector: Financials | |
| SubSector: Credit Services | |
| MarketCap: 476.208 Millions | |
| Recent Price: 5.03 Smart Investing & Trading Score: 49 | |
| Day Percent Change: 3.29% Day Change: 0.16 | |
| Week Change: 2.86% Year-to-date Change: 2.7% | |
| FINV Links: Profile News Message Board | |
| Charts:- Daily , Weekly | |
| Add FINV to Watchlist: View: Get Complete FINV Trend Analysis ➞ | |
 | HUYA HUYA Inc. |
| Sector: Services & Goods | |
| SubSector: Entertainment - Diversified | |
| MarketCap: 3358.17 Millions | |
| Recent Price: 4.75 Smart Investing & Trading Score: 63 | |
| Day Percent Change: 3.49% Day Change: 0.16 | |
| Week Change: 8.45% Year-to-date Change: 29.8% | |
| HUYA Links: Profile News Message Board | |
| Charts:- Daily , Weekly | |
| Add HUYA to Watchlist: View: Get Complete HUYA Trend Analysis ➞ | |
 | QSG QuantaSing Group Limited |
| Sector: Consumer Staples | |
| SubSector: Education & Training Services | |
| MarketCap: 433 Millions | |
| Recent Price: 3.26 Smart Investing & Trading Score: 27 | |
| Day Percent Change: 4.82% Day Change: 0.15 | |
| Week Change: -4.96% Year-to-date Change: 101.2% | |
| QSG Links: Profile News Message Board | |
| Charts:- Daily , Weekly | |
| Add QSG to Watchlist: View: Get Complete QSG Trend Analysis ➞ | |
 | ZCMD Zhongchao Inc. |
| Sector: Health Care | |
| SubSector: Health Information Services | |
| MarketCap: 41487 Millions | |
| Recent Price: 1.78 Smart Investing & Trading Score: 22 | |
| Day Percent Change: 8.18% Day Change: 0.14 | |
| Week Change: 5.62% Year-to-date Change: 388.9% | |
| ZCMD Links: Profile News Message Board | |
| Charts:- Daily , Weekly | |
| Add ZCMD to Watchlist: View: Get Complete ZCMD Trend Analysis ➞ | |
 | JG Aurora Mobile Limited |
| Sector: Technology | |
| SubSector: Application Software | |
| MarketCap: 268.762 Millions | |
| Recent Price: 3.09 Smart Investing & Trading Score: 61 | |
| Day Percent Change: 4.75% Day Change: 0.14 | |
| Week Change: 2.66% Year-to-date Change: 8.4% | |
| JG Links: Profile News Message Board | |
| Charts:- Daily , Weekly | |
| Add JG to Watchlist: View: Get Complete JG Trend Analysis ➞ | |
 | JFIN Jiayin Group Inc. |
| Sector: Technology | |
| SubSector: Internet Information Providers | |
| MarketCap: 131.48 Millions | |
| Recent Price: 6.39 Smart Investing & Trading Score: 43 | |
| Day Percent Change: 2.08% Day Change: 0.13 | |
| Week Change: -3.77% Year-to-date Change: 23.4% | |
| JFIN Links: Profile News Message Board | |
| Charts:- Daily , Weekly | |
| Add JFIN to Watchlist: View: Get Complete JFIN Trend Analysis ➞ | |
 | FANH Fanhua Inc. |
| Sector: Financials | |
| SubSector: Insurance Brokers | |
| MarketCap: 1436.67 Millions | |
| Recent Price: 3.41 Smart Investing & Trading Score: 42 | |
| Day Percent Change: 3.96% Day Change: 0.13 | |
| Week Change: -0.29% Year-to-date Change: -48.7% | |
| FANH Links: Profile News Message Board | |
| Charts:- Daily , Weekly | |
| Add FANH to Watchlist: View: Get Complete FANH Trend Analysis ➞ | |
 | HOLI Hollysys Automation Technologies Ltd. |
| Sector: Industrials | |
| SubSector: Industrial Electrical Equipment | |
| MarketCap: 668.379 Millions | |
| Recent Price: 23.64 Smart Investing & Trading Score: 17 | |
| Day Percent Change: 0.51% Day Change: 0.12 | |
| Week Change: -3.71% Year-to-date Change: -10.3% | |
| HOLI Links: Profile News Message Board | |
| Charts:- Daily , Weekly | |
| Add HOLI to Watchlist: View: Get Complete HOLI Trend Analysis ➞ | |
 | OCFT OneConnect Financial Technology Co., Ltd. |
| Sector: Technology | |
| SubSector: Software Application | |
| MarketCap: 80387 Millions | |
| Recent Price: 2.16 Smart Investing & Trading Score: 64 | |
| Day Percent Change: 5.88% Day Change: 0.12 | |
| Week Change: 8% Year-to-date Change: -31.4% | |
| OCFT Links: Profile News Message Board | |
| Charts:- Daily , Weekly | |
| Add OCFT to Watchlist: View: Get Complete OCFT Trend Analysis ➞ | |
 | LX LexinFintech Holdings Ltd. |
| Sector: Financials | |
| SubSector: Credit Services | |
| MarketCap: 1674.18 Millions | |
| Recent Price: 1.79 Smart Investing & Trading Score: 29 | |
| Day Percent Change: 6.55% Day Change: 0.11 | |
| Week Change: 4.68% Year-to-date Change: -2.7% | |
| LX Links: Profile News Message Board | |
| Charts:- Daily , Weekly | |
| Add LX to Watchlist: View: Get Complete LX Trend Analysis ➞ | |
 | AIXI Xiao-I Corporation |
| Sector: Technology | |
| SubSector: Software - Application | |
| MarketCap: 431 Millions | |
| Recent Price: 1.33 Smart Investing & Trading Score: 42 | |
| Day Percent Change: 8.57% Day Change: 0.10 | |
| Week Change: 3.91% Year-to-date Change: -40.9% | |
| AIXI Links: Profile News Message Board | |
| Charts:- Daily , Weekly | |
| Add AIXI to Watchlist: View: Get Complete AIXI Trend Analysis ➞ | |
 | APM Aptorum Group Limited |
| Sector: Health Care | |
| SubSector: Biotechnology | |
| MarketCap: 88.7785 Millions | |
| Recent Price: 5.60 Smart Investing & Trading Score: 63 | |
| Day Percent Change: 1.82% Day Change: 0.10 | |
| Week Change: 6.06% Year-to-date Change: 128.7% | |
| APM Links: Profile News Message Board | |
| Charts:- Daily , Weekly | |
| Add APM to Watchlist: View: Get Complete APM Trend Analysis ➞ | |
 | NIU Niu Technologies |
| Sector: Consumer Staples | |
| SubSector: Auto Manufacturers - Major | |
| MarketCap: 543.271 Millions | |
| Recent Price: 2.38 Smart Investing & Trading Score: 100 | |
| Day Percent Change: 4.61% Day Change: 0.10 | |
| Week Change: 5.53% Year-to-date Change: 8.9% | |
| NIU Links: Profile News Message Board | |
| Charts:- Daily , Weekly | |
| Add NIU to Watchlist: View: Get Complete NIU Trend Analysis ➞ | |
 | HUIZ Huize Holding Limited |
| Sector: Financials | |
| SubSector: Insurance Brokers | |
| MarketCap: 37157 Millions | |
| Recent Price: 0.75 Smart Investing & Trading Score: 90 | |
| Day Percent Change: 13.61% Day Change: 0.09 | |
| Week Change: 22.6% Year-to-date Change: -16.2% | |
| HUIZ Links: Profile News Message Board | |
| Charts:- Daily , Weekly | |
| Add HUIZ to Watchlist: View: Get Complete HUIZ Trend Analysis ➞ | |
 | DDL Dingdong (Cayman) Limited |
| Sector: Consumer Staples | |
| SubSector: Grocery Stores | |
| MarketCap: 708 Millions | |
| Recent Price: 1.49 Smart Investing & Trading Score: 90 | |
| Day Percent Change: 5.32% Day Change: 0.08 | |
| Week Change: 17.86% Year-to-date Change: -2.3% | |
| DDL Links: Profile News Message Board | |
| Charts:- Daily , Weekly | |
| Add DDL to Watchlist: View: Get Complete DDL Trend Analysis ➞ | |
 | IQ iQIYI, Inc. |
| Sector: Technology | |
| SubSector: Internet Information Providers | |
| MarketCap: 13591.5 Millions | |
| Recent Price: 5.09 Smart Investing & Trading Score: 75 | |
| Day Percent Change: 1.70% Day Change: 0.08 | |
| Week Change: 1.9% Year-to-date Change: 4.2% | |
| IQ Links: Profile News Message Board | |
| Charts:- Daily , Weekly | |
| Add IQ to Watchlist: View: Get Complete IQ Trend Analysis ➞ | |
 | EM Smart Share Global Limited |
| Sector: Services & Goods | |
| SubSector: Personal Services | |
| MarketCap: 238 Millions | |
| Recent Price: 0.87 Smart Investing & Trading Score: 100 | |
| Day Percent Change: 8.63% Day Change: 0.07 | |
| Week Change: 39.89% Year-to-date Change: 68.7% | |
| EM Links: Profile News Message Board | |
| Charts:- Daily , Weekly | |
| Add EM to Watchlist: View: Get Complete EM Trend Analysis ➞ | |
 | XNET Xunlei Limited |
| Sector: Technology | |
| SubSector: Application Software | |
| MarketCap: 203.662 Millions | |
| Recent Price: 1.63 Smart Investing & Trading Score: 78 | |
| Day Percent Change: 4.84% Day Change: 0.07 | |
| Week Change: 3.83% Year-to-date Change: 0.3% | |
| XNET Links: Profile News Message Board | |
| Charts:- Daily , Weekly | |
| Add XNET to Watchlist: View: Get Complete XNET Trend Analysis ➞ | |
 | XIN Xinyuan Real Estate Co., Ltd. |
| Sector: Financials | |
| SubSector: Real Estate Development | |
| MarketCap: 136.119 Millions | |
| Recent Price: 2.68 Smart Investing & Trading Score: 0 | |
| Day Percent Change: 2.10% Day Change: 0.06 | |
| Week Change: -1.47% Year-to-date Change: -1.5% | |
| XIN Links: Profile News Message Board | |
| Charts:- Daily , Weekly | |
| Add XIN to Watchlist: View: Get Complete XIN Trend Analysis ➞ | |
 | YSG Yatsen Holding Limited |
| Sector: Services & Goods | |
| SubSector: Specialty Retail | |
| MarketCap: 11827 Millions | |
| Recent Price: 4.21 Smart Investing & Trading Score: 56 | |
| Day Percent Change: 1.45% Day Change: 0.06 | |
| Week Change: -13.02% Year-to-date Change: 475.5% | |
| YSG Links: Profile News Message Board | |
| Charts:- Daily , Weekly | |
| Add YSG to Watchlist: View: Get Complete YSG Trend Analysis ➞ | |
 | AGMH AGM Group Holdings Inc. |
| Sector: Technology | |
| SubSector: Application Software | |
| MarketCap: 320.362 Millions | |
| Recent Price: 1.12 Smart Investing & Trading Score: 32 | |
| Day Percent Change: 5.66% Day Change: 0.06 | |
| Week Change: 5.66% Year-to-date Change: -38.1% | |
| AGMH Links: Profile News Message Board | |
| Charts:- Daily , Weekly | |
| Add AGMH to Watchlist: View: Get Complete AGMH Trend Analysis ➞ | |
 | RERE ATRenew Inc. |
| Sector: Services & Goods | |
| SubSector: Internet Retail | |
| MarketCap: 672 Millions | |
| Recent Price: 2.12 Smart Investing & Trading Score: 100 | |
| Day Percent Change: 2.17% Day Change: 0.05 | |
| Week Change: 6.82% Year-to-date Change: 11.9% | |
| RERE Links: Profile News Message Board | |
| Charts:- Daily , Weekly | |
| Add RERE to Watchlist: View: Get Complete RERE Trend Analysis ➞ | |
 | RLX RLX Technology Inc. |
| Sector: Consumer Staples | |
| SubSector: Tobacco | |
| MarketCap: 2800 Millions | |
| Recent Price: 1.96 Smart Investing & Trading Score: 44 | |
| Day Percent Change: 2.62% Day Change: 0.05 | |
| Week Change: 2.62% Year-to-date Change: -1.0% | |
| RLX Links: Profile News Message Board | |
| Charts:- Daily , Weekly | |
| Add RLX to Watchlist: View: Get Complete RLX Trend Analysis ➞ | |
 | CNF CNFinance Holdings Limited |
| Sector: Financials | |
| SubSector: Credit Services | |
| MarketCap: 277.408 Millions | |
| Recent Price: 1.85 Smart Investing & Trading Score: 57 | |
| Day Percent Change: 2.78% Day Change: 0.05 | |
| Week Change: -1.07% Year-to-date Change: -16.7% | |
| CNF Links: Profile News Message Board | |
| Charts:- Daily , Weekly | |
| Add CNF to Watchlist: View: Get Complete CNF Trend Analysis ➞ | |
| For tabular summary view of above stock list: Summary View ➞ 0 - 25 , 25 - 50 , 50 - 75 , 75 - 100 , 100 - 125 , 125 - 150 | ||
| Click To Change The Sort Order: By Market Cap or Company Size Performance: Year-to-date, Week and Day | |
| Select Chart Type: | ||
|
Best Stocks Today 12Stocks.com |
© 2024 12Stocks.com Terms & Conditions Privacy Contact Us
All Information Provided Only For Education And Not To Be Used For Investing or Trading. See Terms & Conditions


One More Thing ... Get Best Stocks Delivered Daily!
Never Ever Miss A Move With Our Top Ten Stocks Lists
Find Best Stocks In Any Market - Bull or Bear Market
Take A Peek At Our Top Ten Stocks Lists: Daily, Weekly, Year-to-Date & Top Trends
Find Best Stocks In Any Market - Bull or Bear Market
Take A Peek At Our Top Ten Stocks Lists: Daily, Weekly, Year-to-Date & Top Trends
China Stocks With Best Up Trends [0-bearish to 100-bullish]: KE [100], JD.com [100], 21Vianet [100], MINISO [100], Smart Share[100], Noah [100], Baidu [100], Alibaba [100], Hesai [100], Niu [100], Full Truck[100]
Best China Stocks Year-to-Date:
U Power[2974.78%], DouYu [852.63%], MicroCloud Hologram[635.25%], China Liberal[487.25%], Yatsen Holding[475.45%], Zhongchao [388.91%], Uxin [178.17%], QuantaSing [101.23%], GigaCloud [89.46%], Yiren Digital[74.68%], Cheetah Mobile[74.56%] Best China Stocks This Week:
Smart Share[39.89%], NIO [24.5%], Huize Holding[22.6%], 21Vianet [21.2%], XPeng [19.9%], Regencell Bioscience[19.44%], Viomi [17.87%], Dingdong (Cayman)[17.86%], Li Auto[15.79%], Golden Heaven[15.1%], GDS [14.11%] Best China Stocks Daily:
Regencell Bioscience[21.25%], XPeng [15.76%], Bilibili [15.63%], Huize Holding[13.61%], KE [12.64%], JD.com [11.62%], Kingsoft Cloud[11.54%], Pinduoduo [10.51%], Boqii Holding[10.40%], 21Vianet [10.06%], Li Auto[10.04%]