
 Login Sign Up


| |||||
 |  | ||||

| 12Stocks.com Market Intelligence |
Best China Stocks
|
On this page, you will find the most comprehensive analysis of Chinese stocks and ETFs - from latest trends to performances to charts ➞. First, here are the year-to-date (YTD) performances of the most requested China stocks at 12Stocks.com (click stock for review):
| Sohu.com 20% | ||
| New Oriental 15% | ||
| JD.com 13% | ||
| NetEase 9% | ||
| Alibaba 5% | ||
| Baidu -5% | ||
| Vipshop -9% | ||
| Weibo -9% | ||
| JOYY -15% | ||
| In a hurry? China Stocks Lists: Performance Trends Table, Stock Charts
Sort China stocks: Daily, Weekly, Year-to-Date, Market Cap & Trends. Filter China stocks list by sector: Show all, Tech, Finance, Energy, Staples, Retail, Industrial, Materials, Utilities and HealthCare Filter China stocks list by size: All China Large Medium Small and MicroCap |
| May 7, 2024 - 12Stocks.com China Stocks Performances & Trends Daily | |||||||||
|
|  The overall Smart Investing & Trading Score is 95 (0-bearish to 100-bullish) which puts China index in short term bullish trend. The Smart Investing & Trading Score from previous trading session is 100 and hence a deterioration of trend.
| ||||||||
| Here are the Smart Investing & Trading Scores of the most requested China stocks at 12Stocks.com (click stock name for detailed review): |


| 12Stocks.com: Top Performing China Index Stocks | ||||||||||||||||||||||||||||||||||||||||||||||||
 The top performing China Index stocks year to date are
Now, more recently, over last week, the top performing China Index stocks on the move are


|
||||||||||||||||||||||||||||||||||||||||||||||||
| 12Stocks.com: Investing in China Index with Stocks | |
|
The following table helps investors and traders sort through current performance and trends (as measured by Smart Investing & Trading Score) of various
stocks in the China Index. Quick View: Move mouse or cursor over stock symbol (ticker) to view short-term technical chart and over stock name to view long term chart. Click on  to add stock symbol to your watchlist and to add stock symbol to your watchlist and  to view watchlist. Click on any ticker or stock name for detailed market intelligence report for that stock. to view watchlist. Click on any ticker or stock name for detailed market intelligence report for that stock. |
12Stocks.com Performance of Stocks in China Index
| Ticker | Stock Name | Watchlist | Category | Recent Price | Smart Investing & Trading Score | Change % | YTD Change% |
| YI | 111 |   | Services & Goods | 1.16 | 74 | 0.87% | -25.16% |
| OCFT | OneConnect Financial | | Technology | 2.36 | 74 | -2.40% | -25.02% |
| YSG | Yatsen Holding | | Services & Goods | 4.37 | 73 | 0.69% | 497.32% |
| SDA | SunCar | | Services & Goods | 7.83 | 71 | -5.66% | 0.77% |
| YMM | Full Truck | | Technology | 8.76 | 71 | -1.24% | 25.23% |
| ZLAB | Zai Lab | | Health Care | 16.91 | 69 | 4.06% | -38.13% |
| DAO | Youdao | | Technology | 3.69 | 69 | 2.79% | -6.35% |
| NIO | NIO | | Consumer Staples | 5.69 | 69 | 2.15% | -37.27% |
| TUYA | Tuya | | Technology | 1.84 | 69 | 0.82% | -20.04% |
| BGNE | BeiGene | | Health Care | 162.48 | 69 | 0.14% | -9.91% |
| ATIF | ATIF | | Financials | 0.98 | 69 | 0.00% | 1.36% |
| GDS | GDS | | Technology | 8.43 | 68 | -3.55% | -7.57% |
| ICG | Intchains | | Technology | 8.36 | 67 | 4.57% | -32.07% |
| VIOT | Viomi | | Technology | 0.69 | 65 | 2.38% | -31.05% |
| SY | So-Young | | Technology | 1.29 | 65 | 0.00% | 0.00% |
| EBON | Ebang | | Technology | 8.44 | 64 | 5.63% | -44.75% |
| LI | Li Auto | | Services & Goods | 29.02 | 64 | 3.70% | -22.48% |
| IH | iHuman | | Consumer Staples | 1.78 | 64 | 2.30% | -41.64% |
| LX | LexinFintech | | Financials | 1.84 | 64 | 1.10% | 0.00% |
| VIPS | Vipshop | | Services & Goods | 16.17 | 64 | -1.70% | -8.95% |
| NTES | NetEase | | Technology | 101.86 | 64 | -1.13% | 9.34% |
| TAL | TAL Education | | Services & Goods | 13.14 | 64 | -0.30% | 4.04% |
| JKS | JinkoSolar Holding | | Technology | 25.71 | 62 | -1.80% | -30.40% |
| XPEV | XPeng | | Services & Goods | 9.02 | 62 | -0.44% | -38.18% |
| CCM | Concord Medical | | Health Care | 0.58 | 61 | -7.94% | -47.27% |
| For chart view version of above stock list: Chart View ➞ 0 - 25 , 25 - 50 , 50 - 75 , 75 - 100 , 100 - 125 , 125 - 150 | ||
 | Click To Change The Sort Order: By Market Cap or Company Size Performance: Year-to-date, Week and Day |  |
|
Get the most comprehensive stock market coverage daily at 12Stocks.com ➞ Best Stocks Today ➞ Best Stocks Weekly ➞ Best Stocks Year-to-Date ➞ Best Stocks Trends ➞  Best Stocks Today 12Stocks.com Best Nasdaq Stocks ➞ Best S&P 500 Stocks ➞ Best Tech Stocks ➞ Best Biotech Stocks ➞ |
| Detailed Overview of China Stocks |
| China Technical Overview, Leaders & Laggards, Top China ETF Funds & Detailed China Stocks List, Charts, Trends & More |
| China: Technical Analysis, Trends & YTD Performance | |
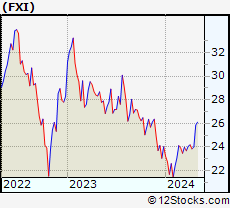
 FXI Weekly Chart |
|
| Long Term Trend: Very Good | |
| Medium Term Trend: Very Good | |
 FXI Daily Chart |
|
| Short Term Trend: Very Good | |
| Overall Trend Score: 95 | |
| YTD Performance: 13.65% | |
| **Trend Scores & Views Are Only For Educational Purposes And Not For Investing | |
| 12Stocks.com: Investing in China Index using Exchange Traded Funds | |
|
The following table shows list of key exchange traded funds (ETF) that
help investors play China stock market. For detailed view, check out our ETF Funds section of our website. Quick View: Move mouse or cursor over ETF symbol (ticker) to view short-term technical chart and over ETF name to view long term chart. Click on ticker or stock name for detailed view. Click on to add stock symbol to your watchlist and to view watchlist. |
12Stocks.com List of ETFs that track China Index
| Ticker | ETF Name | Watchlist | Recent Price | Smart Investing & Trading Score | Change % | Week % | Year-to-date % |
| FXI | China Large-Cap | | 27.31 | 95 | -0.07 | -0.07 | 13.65% |
| EWH | Hong Kong | | 17.00 | 95 | 0.59 | 0.59 | -2.13% |
| YINN | China Bull 3X | | 26.90 | 95 | -0.55 | -0.55 | 28.46% |
| YANG | China Bear 3X | | 7.77 | 10 | 0.52 | 0.52 | -39.3% |
| XPP | China 50 | | 16.61 | 95 | -0.24 | -0.24 | 20.84% |
| MCHI | China | | 44.73 | 95 | -0.09 | -0.09 | 9.79% |
| GXC | China | | 73.07 | 95 | 0.01 | 0.01 | 7.27% |
| CBON | ChinaAMC China Bond | | 21.99 | 47 | -0.07 | -0.07 | -0.5% |
| 12Stocks.com: Charts, Trends, Fundamental Data and Performances of China Stocks | |
|
We now take in-depth look at all China stocks including charts, multi-period performances and overall trends (as measured by Smart Investing & Trading Score). One can sort China stocks (click link to choose) by Daily, Weekly and by Year-to-Date performances. Also, one can sort by size of the company or by market capitalization. |
| Select Your Default Chart Type: | |||||
| |||||
| Click on stock symbol or name for detailed view. Click on to add stock symbol to your watchlist and to view watchlist. Quick View: Move mouse or cursor over "Daily" to quickly view daily technical stock chart and over "Weekly" to view weekly technical stock chart. | |||||

 | YI 111, Inc. |
| Sector: Services & Goods | |
| SubSector: Drug Stores | |
| MarketCap: 520.351 Millions | |
| Recent Price: 1.16 Smart Investing & Trading Score: 74 | |
| Day Percent Change: 0.87% Day Change: 0.01 | |
| Week Change: 0.87% Year-to-date Change: -25.2% | |
| YI Links: Profile News Message Board | |
| Charts:- Daily , Weekly | |
| Add YI to Watchlist: View: Get Complete YI Trend Analysis ➞ | |
 | OCFT OneConnect Financial Technology Co., Ltd. |
| Sector: Technology | |
| SubSector: Software Application | |
| MarketCap: 80387 Millions | |
| Recent Price: 2.36 Smart Investing & Trading Score: 74 | |
| Day Percent Change: -2.40% Day Change: -0.06 | |
| Week Change: -2.4% Year-to-date Change: -25.0% | |
| OCFT Links: Profile News Message Board | |
| Charts:- Daily , Weekly | |
| Add OCFT to Watchlist: View: Get Complete OCFT Trend Analysis ➞ | |
 | YSG Yatsen Holding Limited |
| Sector: Services & Goods | |
| SubSector: Specialty Retail | |
| MarketCap: 11827 Millions | |
| Recent Price: 4.37 Smart Investing & Trading Score: 73 | |
| Day Percent Change: 0.69% Day Change: 0.03 | |
| Week Change: 0.69% Year-to-date Change: 497.3% | |
| YSG Links: Profile News Message Board | |
| Charts:- Daily , Weekly | |
| Add YSG to Watchlist: View: Get Complete YSG Trend Analysis ➞ | |
 | SDA SunCar Technology Group Inc. |
| Sector: Services & Goods | |
| SubSector: Auto & Truck Dealerships | |
| MarketCap: 2680 Millions | |
| Recent Price: 7.83 Smart Investing & Trading Score: 71 | |
| Day Percent Change: -5.66% Day Change: -0.47 | |
| Week Change: -5.66% Year-to-date Change: 0.8% | |
| SDA Links: Profile News Message Board | |
| Charts:- Daily , Weekly | |
| Add SDA to Watchlist: View: Get Complete SDA Trend Analysis ➞ | |
 | YMM Full Truck Alliance Co. Ltd. |
| Sector: Technology | |
| SubSector: Software - Application | |
| MarketCap: 6960 Millions | |
| Recent Price: 8.76 Smart Investing & Trading Score: 71 | |
| Day Percent Change: -1.24% Day Change: -0.11 | |
| Week Change: -1.24% Year-to-date Change: 25.2% | |
| YMM Links: Profile News Message Board | |
| Charts:- Daily , Weekly | |
| Add YMM to Watchlist: View: Get Complete YMM Trend Analysis ➞ | |
 | ZLAB Zai Lab Limited |
| Sector: Health Care | |
| SubSector: Biotechnology | |
| MarketCap: 3970.35 Millions | |
| Recent Price: 16.91 Smart Investing & Trading Score: 69 | |
| Day Percent Change: 4.06% Day Change: 0.66 | |
| Week Change: 4.06% Year-to-date Change: -38.1% | |
| ZLAB Links: Profile News Message Board | |
| Charts:- Daily , Weekly | |
| Add ZLAB to Watchlist: View: Get Complete ZLAB Trend Analysis ➞ | |
 | DAO Youdao, Inc. |
| Sector: Technology | |
| SubSector: Internet Information Providers | |
| MarketCap: 2073.2 Millions | |
| Recent Price: 3.69 Smart Investing & Trading Score: 69 | |
| Day Percent Change: 2.79% Day Change: 0.10 | |
| Week Change: 2.79% Year-to-date Change: -6.4% | |
| DAO Links: Profile News Message Board | |
| Charts:- Daily , Weekly | |
| Add DAO to Watchlist: View: Get Complete DAO Trend Analysis ➞ | |
 | NIO NIO Limited |
| Sector: Consumer Staples | |
| SubSector: Auto Manufacturers - Major | |
| MarketCap: 2679.71 Millions | |
| Recent Price: 5.69 Smart Investing & Trading Score: 69 | |
| Day Percent Change: 2.15% Day Change: 0.12 | |
| Week Change: 2.15% Year-to-date Change: -37.3% | |
| NIO Links: Profile News Message Board | |
| Charts:- Daily , Weekly | |
| Add NIO to Watchlist: View: Get Complete NIO Trend Analysis ➞ | |
 | TUYA Tuya Inc. |
| Sector: Technology | |
| SubSector: Software - Infrastructure | |
| MarketCap: 1050 Millions | |
| Recent Price: 1.84 Smart Investing & Trading Score: 69 | |
| Day Percent Change: 0.82% Day Change: 0.01 | |
| Week Change: 0.82% Year-to-date Change: -20.0% | |
| TUYA Links: Profile News Message Board | |
| Charts:- Daily , Weekly | |
| Add TUYA to Watchlist: View: Get Complete TUYA Trend Analysis ➞ | |
 | BGNE BeiGene, Ltd. |
| Sector: Health Care | |
| SubSector: Biotechnology | |
| MarketCap: 10838.5 Millions | |
| Recent Price: 162.48 Smart Investing & Trading Score: 69 | |
| Day Percent Change: 0.14% Day Change: 0.23 | |
| Week Change: 0.14% Year-to-date Change: -9.9% | |
| BGNE Links: Profile News Message Board | |
| Charts:- Daily , Weekly | |
| Add BGNE to Watchlist: View: Get Complete BGNE Trend Analysis ➞ | |
 | ATIF ATIF Holdings Limited |
| Sector: Financials | |
| SubSector: Asset Management | |
| MarketCap: 68.5203 Millions | |
| Recent Price: 0.98 Smart Investing & Trading Score: 69 | |
| Day Percent Change: 0.00% Day Change: 0.00 | |
| Week Change: 0% Year-to-date Change: 1.4% | |
| ATIF Links: Profile News Message Board | |
| Charts:- Daily , Weekly | |
| Add ATIF to Watchlist: View: Get Complete ATIF Trend Analysis ➞ | |
 | GDS GDS Holdings Limited |
| Sector: Technology | |
| SubSector: Data Storage Devices | |
| MarketCap: 8597.99 Millions | |
| Recent Price: 8.43 Smart Investing & Trading Score: 68 | |
| Day Percent Change: -3.55% Day Change: -0.31 | |
| Week Change: -3.55% Year-to-date Change: -7.6% | |
| GDS Links: Profile News Message Board | |
| Charts:- Daily , Weekly | |
| Add GDS to Watchlist: View: Get Complete GDS Trend Analysis ➞ | |
 | ICG Intchains Group Limited |
| Sector: Technology | |
| SubSector: Semiconductors | |
| MarketCap: 450 Millions | |
| Recent Price: 8.36 Smart Investing & Trading Score: 67 | |
| Day Percent Change: 4.57% Day Change: 0.37 | |
| Week Change: 4.57% Year-to-date Change: -32.1% | |
| ICG Links: Profile News Message Board | |
| Charts:- Daily , Weekly | |
| Add ICG to Watchlist: View: Get Complete ICG Trend Analysis ➞ | |
 | VIOT Viomi Technology Co., Ltd |
| Sector: Technology | |
| SubSector: Electronic Equipment | |
| MarketCap: 357.2 Millions | |
| Recent Price: 0.69 Smart Investing & Trading Score: 65 | |
| Day Percent Change: 2.38% Day Change: 0.02 | |
| Week Change: 2.38% Year-to-date Change: -31.1% | |
| VIOT Links: Profile News Message Board | |
| Charts:- Daily , Weekly | |
| Add VIOT to Watchlist: View: Get Complete VIOT Trend Analysis ➞ | |
 | SY So-Young International Inc. |
| Sector: Technology | |
| SubSector: Healthcare Information Services | |
| MarketCap: 1000.55 Millions | |
| Recent Price: 1.29 Smart Investing & Trading Score: 65 | |
| Day Percent Change: 0.00% Day Change: 0.00 | |
| Week Change: 0% Year-to-date Change: 0.0% | |
| SY Links: Profile News Message Board | |
| Charts:- Daily , Weekly | |
| Add SY to Watchlist: View: Get Complete SY Trend Analysis ➞ | |
 | EBON Ebang International Holdings Inc. |
| Sector: Technology | |
| SubSector: Computer Hardware | |
| MarketCap: 33787 Millions | |
| Recent Price: 8.44 Smart Investing & Trading Score: 64 | |
| Day Percent Change: 5.63% Day Change: 0.45 | |
| Week Change: 5.63% Year-to-date Change: -44.8% | |
| EBON Links: Profile News Message Board | |
| Charts:- Daily , Weekly | |
| Add EBON to Watchlist: View: Get Complete EBON Trend Analysis ➞ | |
 | LI Li Auto Inc. |
| Sector: Services & Goods | |
| SubSector: Auto Manufacturers | |
| MarketCap: 29167 Millions | |
| Recent Price: 29.02 Smart Investing & Trading Score: 64 | |
| Day Percent Change: 3.70% Day Change: 1.04 | |
| Week Change: 3.7% Year-to-date Change: -22.5% | |
| LI Links: Profile News Message Board | |
| Charts:- Daily , Weekly | |
| Add LI to Watchlist: View: Get Complete LI Trend Analysis ➞ | |
 | IH iHuman Inc. |
| Sector: Consumer Staples | |
| SubSector: Education & Training Services | |
| MarketCap: 12247 Millions | |
| Recent Price: 1.78 Smart Investing & Trading Score: 64 | |
| Day Percent Change: 2.30% Day Change: 0.04 | |
| Week Change: 2.3% Year-to-date Change: -41.6% | |
| IH Links: Profile News Message Board | |
| Charts:- Daily , Weekly | |
| Add IH to Watchlist: View: Get Complete IH Trend Analysis ➞ | |
 | LX LexinFintech Holdings Ltd. |
| Sector: Financials | |
| SubSector: Credit Services | |
| MarketCap: 1674.18 Millions | |
| Recent Price: 1.84 Smart Investing & Trading Score: 64 | |
| Day Percent Change: 1.10% Day Change: 0.02 | |
| Week Change: 1.1% Year-to-date Change: 0.0% | |
| LX Links: Profile News Message Board | |
| Charts:- Daily , Weekly | |
| Add LX to Watchlist: View: Get Complete LX Trend Analysis ➞ | |
 | VIPS Vipshop Holdings Limited |
| Sector: Services & Goods | |
| SubSector: Catalog & Mail Order Houses | |
| MarketCap: 10496.2 Millions | |
| Recent Price: 16.17 Smart Investing & Trading Score: 64 | |
| Day Percent Change: -1.70% Day Change: -0.28 | |
| Week Change: -1.7% Year-to-date Change: -9.0% | |
| VIPS Links: Profile News Message Board | |
| Charts:- Daily , Weekly | |
| Add VIPS to Watchlist: View: Get Complete VIPS Trend Analysis ➞ | |
 | NTES NetEase, Inc. |
| Sector: Technology | |
| SubSector: Internet Software & Services | |
| MarketCap: 40105.1 Millions | |
| Recent Price: 101.86 Smart Investing & Trading Score: 64 | |
| Day Percent Change: -1.13% Day Change: -1.16 | |
| Week Change: -1.13% Year-to-date Change: 9.3% | |
| NTES Links: Profile News Message Board | |
| Charts:- Daily , Weekly | |
| Add NTES to Watchlist: View: Get Complete NTES Trend Analysis ➞ | |
 | TAL TAL Education Group |
| Sector: Services & Goods | |
| SubSector: Education & Training Services | |
| MarketCap: 30103.1 Millions | |
| Recent Price: 13.14 Smart Investing & Trading Score: 64 | |
| Day Percent Change: -0.30% Day Change: -0.04 | |
| Week Change: -0.3% Year-to-date Change: 4.0% | |
| TAL Links: Profile News Message Board | |
| Charts:- Daily , Weekly | |
| Add TAL to Watchlist: View: Get Complete TAL Trend Analysis ➞ | |
 | JKS JinkoSolar Holding Co., Ltd. |
| Sector: Technology | |
| SubSector: Semiconductor - Specialized | |
| MarketCap: 629.36 Millions | |
| Recent Price: 25.71 Smart Investing & Trading Score: 62 | |
| Day Percent Change: -1.80% Day Change: -0.47 | |
| Week Change: -1.8% Year-to-date Change: -30.4% | |
| JKS Links: Profile News Message Board | |
| Charts:- Daily , Weekly | |
| Add JKS to Watchlist: View: Get Complete JKS Trend Analysis ➞ | |
 | XPEV XPeng Inc. |
| Sector: Services & Goods | |
| SubSector: Auto Manufacturers | |
| MarketCap: 32917 Millions | |
| Recent Price: 9.02 Smart Investing & Trading Score: 62 | |
| Day Percent Change: -0.44% Day Change: -0.04 | |
| Week Change: -0.44% Year-to-date Change: -38.2% | |
| XPEV Links: Profile News Message Board | |
| Charts:- Daily , Weekly | |
| Add XPEV to Watchlist: View: Get Complete XPEV Trend Analysis ➞ | |
 | CCM Concord Medical Services Holdings Limited |
| Sector: Health Care | |
| SubSector: Hospitals | |
| MarketCap: 138.646 Millions | |
| Recent Price: 0.58 Smart Investing & Trading Score: 61 | |
| Day Percent Change: -7.94% Day Change: -0.05 | |
| Week Change: -7.94% Year-to-date Change: -47.3% | |
| CCM Links: Profile News Message Board | |
| Charts:- Daily , Weekly | |
| Add CCM to Watchlist: View: Get Complete CCM Trend Analysis ➞ | |
| For tabular summary view of above stock list: Summary View ➞ 0 - 25 , 25 - 50 , 50 - 75 , 75 - 100 , 100 - 125 , 125 - 150 | ||
| Click To Change The Sort Order: By Market Cap or Company Size Performance: Year-to-date, Week and Day | |
| Select Chart Type: | ||
|
Best Stocks Today 12Stocks.com |
© 2024 12Stocks.com Terms & Conditions Privacy Contact Us
All Information Provided Only For Education And Not To Be Used For Investing or Trading. See Terms & Conditions


One More Thing ... Get Best Stocks Delivered Daily!
Never Ever Miss A Move With Our Top Ten Stocks Lists
Find Best Stocks In Any Market - Bull or Bear Market
Take A Peek At Our Top Ten Stocks Lists: Daily, Weekly, Year-to-Date & Top Trends
Find Best Stocks In Any Market - Bull or Bear Market
Take A Peek At Our Top Ten Stocks Lists: Daily, Weekly, Year-to-Date & Top Trends
China Stocks With Best Up Trends [0-bearish to 100-bullish]: GigaCloud [100], ATRenew [100], Smart Share[100], GreenTree Hospitality[100], Hutchison China[100], Noah [100], Weibo [100], Shengfeng Development[100], Tencent Music[100], Autohome [100], Alibaba [100]
Best China Stocks Year-to-Date:
U Power[3209.15%], DouYu [910.53%], MicroCloud Hologram[498.56%], Yatsen Holding[497.32%], China Liberal[481.66%], Zhongchao [338.24%], Uxin [188.16%], GigaCloud [124.6%], QuantaSing [94.44%], Smart Share[80.58%], Cheetah Mobile[80.26%] Best China Stocks This Week:
GigaCloud [13.95%], EHang [7.59%], ATRenew [7.42%], Smart Share[6.9%], Agora [6.58%], DouYu [5.84%], Ebang [5.63%], TH [4.95%], 17 Education[4.95%], Intchains [4.57%], Waterdrop [4.35%] Best China Stocks Daily:
GigaCloud [13.95%], EHang [7.59%], ATRenew [7.42%], Smart Share[6.90%], Agora [6.58%], DouYu [5.84%], Ebang [5.63%], TH [4.95%], 17 Education[4.95%], Intchains [4.57%], Waterdrop [4.35%]