
 Login Sign Up


| |||||
 |  | ||||

| 12Stocks.com Market Intelligence |
Best Biotech Stocks
|
|
| Quick Read: Best Biotech Stocks List By Performances & Trends: Daily, Weekly, Year-to-Date, Market Cap (Size) & Technical Trends | |||
| Best Biotech Stocks Views: Quick Browse View, Summary & Slide Show View | |||
| 12Stocks.com Biotech Stocks Performances & Trends Daily | |||||||||
|
|  The overall market intelligence score is 69 (0-bearish to 100-bullish) which puts Biotech sector in short term neutral to bullish trend. The market intelligence score from previous trading session is 50 and hence an improvement of trend.
| ||||||||
Here are the market intelligence trend scores of the most requested Biotech stocks at 12Stocks.com (click stock name for detailed review):
|


| 12Stocks.com: Investing in Biotech sector with Stocks | |
|
The following table helps investors and traders sort through current performance and trends (as measured by market intelligence score) of various
stocks in the Biotech sector. Quick View: Move mouse or cursor over stock symbol (ticker) to view short-term Technical chart and over stock name to view long term chart. Click on  to add stock symbol to your watchlist and to add stock symbol to your watchlist and  to view watchlist. Click on any ticker or stock name for detailed market intelligence report for that stock. to view watchlist. Click on any ticker or stock name for detailed market intelligence report for that stock. |
12Stocks.com Performance of Stocks in Biotech Sector
| Ticker | Stock Name | Watchlist | Category | Recent Price | Market Intelligence Score | Change % | YTD Change% |
| INSM | Insmed |   | Biotechnology | 25.55 | 49 | -0.43% | -17.55% |
| REPL | Replimune | | Biotechnology | 6.95 | 54 | 5.95% | -17.56% |
| PHVS | Pharvaris N.V | | Biotechnology | 23.31 | 51 | -3.52% | -17.71% |
| FENC | Fennec | | Biotechnology | 9.23 | 25 | 1.54% | -17.74% |
| RCUS | Arcus | | Biotechnology | 15.70 | 49 | 1.29% | -17.80% |
| VOR | Vor Biopharma | | Biotechnology | 1.82 | 37 | 4.00% | -18.02% |
| SRRK | Scholar Rock | | Biotechnology | 15.35 | 64 | 1.66% | -18.35% |
| TERN | Terns | | Biotechnology | 5.39 | 64 | 4.86% | -18.46% |
| GOSS | Gossamer Bio | | Biotechnology | 0.74 | 42 | -4.06% | -18.90% |
| MTNB | Matinas BioPharma | | Biotechnology | 0.17 | 28 | -4.58% | -19.10% |
| KRON | Kronos Bio | | Biotechnology | 1.01 | 29 | -1.94% | -19.20% |
| CUE | Cue Biopharma | | Biotechnology | 2.13 | 95 | 13.30% | -19.32% |
| NBTX | Nanobiotix S.A | | Biotechnology | 5.98 | 29 | 1.10% | -19.41% |
| ATHA | Athira Pharma | | Biotechnology | 1.97 | 18 | 0.26% | -19.47% |
| TRDA | Entrada | | Biotechnology | 13.16 | 77 | 1.70% | -19.80% |
| GILD | Gilead | | Biotechnology | 64.78 | 18 | -0.84% | -20.03% |
| ARWR | Arrowhead | | Biotechnology | 24.44 | 49 | 1.28% | -20.13% |
| DNLI | Denali | | Biotechnology | 17.14 | 59 | 1.96% | -20.13% |
| ARVN | Arvinas | | Biotechnology | 32.82 | 32 | 1.20% | -20.26% |
| ALNY | Alnylam | | Biotechnology | 152.33 | 100 | 1.34% | -20.42% |
| VIGL | Vigil Neuroscience | | Biotechnology | 2.72 | 42 | 4.82% | -20.70% |
| APLS | Apellis | | Biotechnology | 47.46 | 42 | -0.06% | -20.72% |
| DRTS | Alpha Tau | | Biotechnology | 2.35 | 0 | -3.29% | -21.40% |
| RCKT | Rocket | | Biotechnology | 23.47 | 42 | 3.07% | -21.69% |
| CYTK | Cytokinetics | | Biotechnology | 65.27 | 32 | 1.45% | -21.82% |
| To view more stocks, click on Next / Previous arrows or select different range: 0 - 25 , 25 - 50 , 50 - 75 , 75 - 100 , 100 - 125 , 125 - 150 , 150 - 175 , 175 - 200 , 200 - 225 , 225 - 250 , 250 - 275 , 275 - 300 , 300 - 325 , 325 - 350 , 350 - 375 , 375 - 400 | ||
 | Click To Change The Sort Order: By Market Cap or Company Size Performance: Year-to-date, Week and Day |  |
|
Get the most comprehensive stock market coverage daily at 12Stocks.com ➞ Best Stocks Today ➞ Best Stocks Weekly ➞ Best Stocks Year-to-Date ➞ Best Stocks Trends ➞  Best Stocks Today 12Stocks.com Best Nasdaq Stocks ➞ Best S&P 500 Stocks ➞ Best Tech Stocks ➞ Best Biotech Stocks ➞ |
| Detailed Overview of Biotech Stocks |
| Biotech Technical Overview, Leaders & Laggards, Top Biotech ETF Funds & Detailed Biotech Stocks List, Charts, Trends & More |
| Biotech Sector: Technical Analysis, Trends & YTD Performance | |
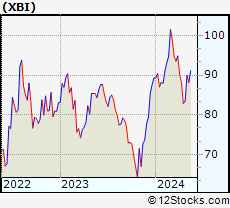
| Biotech sector, as represented by XBI, an exchange-traded fund [ETF] that holds basket of Biotech stocks (e.g, Amgen, Celgene) is up by 0.77% and is currently underperforming the overall market by -6.11% year-to-date. Below is a quick view of Technical charts and trends: | |
 XBI Weekly Chart |
|
| Long Term Trend: Not Good | |
| Medium Term Trend: Very Good | |
 XBI Daily Chart |
|
| Short Term Trend: Very Good | |
| Overall Trend Score: 69 | |
| YTD Performance: 0.77% | |
| **Trend Scores & Views Are Only For Educational Purposes And Not For Investing | |
| 12Stocks.com: Top Performing Biotech Sector Stocks | ||||||||||||||||||||||||||||||||||||||||||||||||
 The top performing Biotech sector stocks year to date are
Now, more recently, over last week, the top performing Biotech sector stocks on the move are


|
||||||||||||||||||||||||||||||||||||||||||||||||
| 12Stocks.com: Investing in Biotech Sector using Exchange Traded Funds | |
|
The following table shows list of key exchange traded funds (ETF) that
help investors track Biotech Index. For detailed view, check out our ETF Funds section of our website. Quick View: Move mouse or cursor over ETF symbol (ticker) to view short-term Technical chart and over ETF name to view long term chart. Click on ticker or stock name for detailed view. Click on to add stock symbol to your watchlist and to view watchlist. |
12Stocks.com List of ETFs that track Biotech Index
| Ticker | ETF Name | Watchlist | Recent Price | Market Intelligence Score | Change % | Week % | Year-to-date % |
| LABD | Biotech Bear 3X | | 8.28 | 36 | -5.48 | -21.29 | -14.55% |
| XBI | Biotech | | 89.98 | 69 | 1.86 | 7.77 | 0.77% |
| LABU | Biotech Bull 3X | | 108.99 | 64 | 5.83 | 24.55 | -10.64% |
| IBB | Biotechnology | | 132.96 | 69 | 1.77 | 5.12 | -2.13% |
| IYH | Healthcare | | 59.26 | 57 | 0.24 | 1.11 | 3.51% |
| IHF | Healthcare Providers | | 51.69 | 30 | 0.08 | -0.44 | -1.56% |
| BIB | Biotechnology | | 55.63 | 74 | 3.40 | 12.02 | -2.49% |
| IXJ | Global Healthcare | | 89.66 | 52 | 0.31 | 0.61 | 3.39% |
| CURE | Healthcare Bull 3X | | 106.89 | 57 | 1.02 | 1.51 | 5.06% |
| PBE | Biotech & Genome | | 64.11 | 74 | 0.85 | 6.18 | -2.63% |
| FBT | First NYSE | | 148.20 | 57 | 0.79 | 3.17 | -6.24% |
| PTH | DWA Healthcare Momentum | | 42.05 | 62 | 0.74 | 5.41 | 7.43% |
| BIS | Short Biotech | | 17.99 | 36 | -3.59 | -11.03 | -0.44% |
| BBC | Bio Biotechnology Clinical | | 27.89 | 69 | 2.05 | 9.24 | 14.06% |
| BBH | Biotech | | 164.15 | 100 | 2.27 | 5.46 | -0.7% |
| BTEC | Principal Healthcare Innovators | | 36.97 | 69 | 2.74 | 7.94 | 1.76% |
| BBP | Bio Biotechnology Products | | 55.49 | 64 | 2.10 | 7.78 | -4.48% |
| 12Stocks.com: Charts, Trends, Fundamental Data and Performances of Biotech Stocks | |
|
We now take in-depth look at all Biotech stocks including charts, multi-period performances and overall trends (as measured by market intelligence score). One can sort Biotech stocks (click link to choose) by Daily, Weekly and by Year-to-Date performances. Also, one can sort by size of the company or by market capitalization. |
| Select Your Default Chart Type: | |||||
| |||||
| Click on stock symbol or name for detailed view. Click on to add stock symbol to your watchlist and to view watchlist. Quick View: Move mouse or cursor over "Daily" to quickly view daily Technical stock chart and over "Weekly" to view weekly Technical stock chart. | |||||

 | INSM Insmed Incorporated |
| Sector: Health Care | |
| SubSector: Biotechnology | |
| MarketCap: 1452.45 Millions | |
| Recent Price: 25.55 Market Intelligence Score: 49 | |
| Day Percent Change: -0.43% Day Change: -0.11 | |
| Week Change: 3.02% Year-to-date Change: -17.6% | |
| INSM Links: Profile News Message Board | |
| Charts:- Daily , Weekly | |
| Add INSM to Watchlist: View: Get Complete INSM Trend Analysis ➞ | |
 | REPL Replimune Group, Inc. |
| Sector: Health Care | |
| SubSector: Biotechnology | |
| MarketCap: 367.885 Millions | |
| Recent Price: 6.95 Market Intelligence Score: 54 | |
| Day Percent Change: 5.95% Day Change: 0.39 | |
| Week Change: 8.26% Year-to-date Change: -17.6% | |
| REPL Links: Profile News Message Board | |
| Charts:- Daily , Weekly | |
| Add REPL to Watchlist: View: Get Complete REPL Trend Analysis ➞ | |
 | PHVS Pharvaris N.V. |
| Sector: Health Care | |
| SubSector: Biotechnology | |
| MarketCap: 475 Millions | |
| Recent Price: 23.31 Market Intelligence Score: 51 | |
| Day Percent Change: -3.52% Day Change: -0.85 | |
| Week Change: -0.17% Year-to-date Change: -17.7% | |
| PHVS Links: Profile News Message Board | |
| Charts:- Daily , Weekly | |
| Add PHVS to Watchlist: View: Get Complete PHVS Trend Analysis ➞ | |
 | FENC Fennec Pharmaceuticals Inc. |
| Sector: Health Care | |
| SubSector: Biotechnology | |
| MarketCap: 126.785 Millions | |
| Recent Price: 9.23 Market Intelligence Score: 25 | |
| Day Percent Change: 1.54% Day Change: 0.14 | |
| Week Change: 0.22% Year-to-date Change: -17.7% | |
| FENC Links: Profile News Message Board | |
| Charts:- Daily , Weekly | |
| Add FENC to Watchlist: View: Get Complete FENC Trend Analysis ➞ | |
 | RCUS Arcus Biosciences, Inc. |
| Sector: Health Care | |
| SubSector: Biotechnology | |
| MarketCap: 539.285 Millions | |
| Recent Price: 15.70 Market Intelligence Score: 49 | |
| Day Percent Change: 1.29% Day Change: 0.20 | |
| Week Change: 0.96% Year-to-date Change: -17.8% | |
| RCUS Links: Profile News Message Board | |
| Charts:- Daily , Weekly | |
| Add RCUS to Watchlist: View: Get Complete RCUS Trend Analysis ➞ | |
 | VOR Vor Biopharma Inc. |
| Sector: Health Care | |
| SubSector: Biotechnology | |
| MarketCap: 224 Millions | |
| Recent Price: 1.82 Market Intelligence Score: 37 | |
| Day Percent Change: 4.00% Day Change: 0.07 | |
| Week Change: 7.69% Year-to-date Change: -18.0% | |
| VOR Links: Profile News Message Board | |
| Charts:- Daily , Weekly | |
| Add VOR to Watchlist: View: Get Complete VOR Trend Analysis ➞ | |
 | SRRK Scholar Rock Holding Corporation |
| Sector: Health Care | |
| SubSector: Biotechnology | |
| MarketCap: 441.385 Millions | |
| Recent Price: 15.35 Market Intelligence Score: 64 | |
| Day Percent Change: 1.66% Day Change: 0.25 | |
| Week Change: 5.64% Year-to-date Change: -18.4% | |
| SRRK Links: Profile News Message Board | |
| Charts:- Daily , Weekly | |
| Add SRRK to Watchlist: View: Get Complete SRRK Trend Analysis ➞ | |
 | TERN Terns Pharmaceuticals, Inc. |
| Sector: Health Care | |
| SubSector: Biotechnology | |
| MarketCap: 611 Millions | |
| Recent Price: 5.39 Market Intelligence Score: 64 | |
| Day Percent Change: 4.86% Day Change: 0.25 | |
| Week Change: 9.78% Year-to-date Change: -18.5% | |
| TERN Links: Profile News Message Board | |
| Charts:- Daily , Weekly | |
| Add TERN to Watchlist: View: Get Complete TERN Trend Analysis ➞ | |
 | GOSS Gossamer Bio, Inc. |
| Sector: Health Care | |
| SubSector: Biotechnology | |
| MarketCap: 653.285 Millions | |
| Recent Price: 0.74 Market Intelligence Score: 42 | |
| Day Percent Change: -4.06% Day Change: -0.03 | |
| Week Change: 10.78% Year-to-date Change: -18.9% | |
| GOSS Links: Profile News Message Board | |
| Charts:- Daily , Weekly | |
| Add GOSS to Watchlist: View: Get Complete GOSS Trend Analysis ➞ | |
 | MTNB Matinas BioPharma Holdings, Inc. |
| Sector: Health Care | |
| SubSector: Biotechnology | |
| MarketCap: 147.085 Millions | |
| Recent Price: 0.17 Market Intelligence Score: 28 | |
| Day Percent Change: -4.58% Day Change: -0.01 | |
| Week Change: -2.24% Year-to-date Change: -19.1% | |
| MTNB Links: Profile News Message Board | |
| Charts:- Daily , Weekly | |
| Add MTNB to Watchlist: View: Get Complete MTNB Trend Analysis ➞ | |
 | KRON Kronos Bio, Inc. |
| Sector: Health Care | |
| SubSector: Biotechnology | |
| MarketCap: 17287 Millions | |
| Recent Price: 1.01 Market Intelligence Score: 29 | |
| Day Percent Change: -1.94% Day Change: -0.02 | |
| Week Change: 1% Year-to-date Change: -19.2% | |
| KRON Links: Profile News Message Board | |
| Charts:- Daily , Weekly | |
| Add KRON to Watchlist: View: Get Complete KRON Trend Analysis ➞ | |
 | CUE Cue Biopharma, Inc. |
| Sector: Health Care | |
| SubSector: Biotechnology | |
| MarketCap: 352.785 Millions | |
| Recent Price: 2.13 Market Intelligence Score: 95 | |
| Day Percent Change: 13.30% Day Change: 0.25 | |
| Week Change: 56.04% Year-to-date Change: -19.3% | |
| CUE Links: Profile News Message Board | |
| Charts:- Daily , Weekly | |
| Add CUE to Watchlist: View: Get Complete CUE Trend Analysis ➞ | |
 | NBTX Nanobiotix S.A. |
| Sector: Health Care | |
| SubSector: Biotechnology | |
| MarketCap: 177 Millions | |
| Recent Price: 5.98 Market Intelligence Score: 29 | |
| Day Percent Change: 1.10% Day Change: 0.07 | |
| Week Change: 4.18% Year-to-date Change: -19.4% | |
| NBTX Links: Profile News Message Board | |
| Charts:- Daily , Weekly | |
| Add NBTX to Watchlist: View: Get Complete NBTX Trend Analysis ➞ | |
 | ATHA Athira Pharma, Inc. |
| Sector: Health Care | |
| SubSector: Biotechnology | |
| MarketCap: 92487 Millions | |
| Recent Price: 1.97 Market Intelligence Score: 18 | |
| Day Percent Change: 0.26% Day Change: 0.01 | |
| Week Change: 2.34% Year-to-date Change: -19.5% | |
| ATHA Links: Profile News Message Board | |
| Charts:- Daily , Weekly | |
| Add ATHA to Watchlist: View: Get Complete ATHA Trend Analysis ➞ | |
 | TRDA Entrada Therapeutics, Inc. |
| Sector: Health Care | |
| SubSector: Biotechnology | |
| MarketCap: 481 Millions | |
| Recent Price: 13.16 Market Intelligence Score: 77 | |
| Day Percent Change: 1.70% Day Change: 0.22 | |
| Week Change: 5.7% Year-to-date Change: -19.8% | |
| TRDA Links: Profile News Message Board | |
| Charts:- Daily , Weekly | |
| Add TRDA to Watchlist: View: Get Complete TRDA Trend Analysis ➞ | |
 | GILD Gilead Sciences, Inc. |
| Sector: Health Care | |
| SubSector: Biotechnology | |
| MarketCap: 99485.6 Millions | |
| Recent Price: 64.78 Market Intelligence Score: 18 | |
| Day Percent Change: -0.84% Day Change: -0.55 | |
| Week Change: -0.98% Year-to-date Change: -20.0% | |
| GILD Links: Profile News Message Board | |
| Charts:- Daily , Weekly | |
| Add GILD to Watchlist: View: Get Complete GILD Trend Analysis ➞ | |
 | ARWR Arrowhead Pharmaceuticals, Inc. |
| Sector: Health Care | |
| SubSector: Biotechnology | |
| MarketCap: 3226.15 Millions | |
| Recent Price: 24.44 Market Intelligence Score: 49 | |
| Day Percent Change: 1.28% Day Change: 0.31 | |
| Week Change: 10.49% Year-to-date Change: -20.1% | |
| ARWR Links: Profile News Message Board | |
| Charts:- Daily , Weekly | |
| Add ARWR to Watchlist: View: Get Complete ARWR Trend Analysis ➞ | |
 | DNLI Denali Therapeutics Inc. |
| Sector: Health Care | |
| SubSector: Biotechnology | |
| MarketCap: 2020.05 Millions | |
| Recent Price: 17.14 Market Intelligence Score: 59 | |
| Day Percent Change: 1.96% Day Change: 0.33 | |
| Week Change: 11.08% Year-to-date Change: -20.1% | |
| DNLI Links: Profile News Message Board | |
| Charts:- Daily , Weekly | |
| Add DNLI to Watchlist: View: Get Complete DNLI Trend Analysis ➞ | |
 | ARVN Arvinas, Inc. |
| Sector: Health Care | |
| SubSector: Biotechnology | |
| MarketCap: 3469.85 Millions | |
| Recent Price: 32.82 Market Intelligence Score: 32 | |
| Day Percent Change: 1.20% Day Change: 0.39 | |
| Week Change: 1.39% Year-to-date Change: -20.3% | |
| ARVN Links: Profile News Message Board | |
| Charts:- Daily , Weekly | |
| Add ARVN to Watchlist: View: Get Complete ARVN Trend Analysis ➞ | |
 | ALNY Alnylam Pharmaceuticals, Inc. |
| Sector: Health Care | |
| SubSector: Biotechnology | |
| MarketCap: 12793.2 Millions | |
| Recent Price: 152.33 Market Intelligence Score: 100 | |
| Day Percent Change: 1.34% Day Change: 2.02 | |
| Week Change: 6.29% Year-to-date Change: -20.4% | |
| ALNY Links: Profile News Message Board | |
| Charts:- Daily , Weekly | |
| Add ALNY to Watchlist: View: Get Complete ALNY Trend Analysis ➞ | |
 | VIGL Vigil Neuroscience, Inc. |
| Sector: Health Care | |
| SubSector: Biotechnology | |
| MarketCap: 339 Millions | |
| Recent Price: 2.72 Market Intelligence Score: 42 | |
| Day Percent Change: 4.82% Day Change: 0.13 | |
| Week Change: 0.37% Year-to-date Change: -20.7% | |
| VIGL Links: Profile News Message Board | |
| Charts:- Daily , Weekly | |
| Add VIGL to Watchlist: View: Get Complete VIGL Trend Analysis ➞ | |
 | APLS Apellis Pharmaceuticals, Inc. |
| Sector: Health Care | |
| SubSector: Biotechnology | |
| MarketCap: 2030.95 Millions | |
| Recent Price: 47.46 Market Intelligence Score: 42 | |
| Day Percent Change: -0.06% Day Change: -0.03 | |
| Week Change: -4.81% Year-to-date Change: -20.7% | |
| APLS Links: Profile News Message Board | |
| Charts:- Daily , Weekly | |
| Add APLS to Watchlist: View: Get Complete APLS Trend Analysis ➞ | |
 | DRTS Alpha Tau Medical Ltd. |
| Sector: Health Care | |
| SubSector: Biotechnology | |
| MarketCap: 300 Millions | |
| Recent Price: 2.35 Market Intelligence Score: 0 | |
| Day Percent Change: -3.29% Day Change: -0.08 | |
| Week Change: -2.08% Year-to-date Change: -21.4% | |
| DRTS Links: Profile News Message Board | |
| Charts:- Daily , Weekly | |
| Add DRTS to Watchlist: View: Get Complete DRTS Trend Analysis ➞ | |
 | RCKT Rocket Pharmaceuticals, Inc. |
| Sector: Health Care | |
| SubSector: Biotechnology | |
| MarketCap: 899.585 Millions | |
| Recent Price: 23.47 Market Intelligence Score: 42 | |
| Day Percent Change: 3.07% Day Change: 0.70 | |
| Week Change: 6.78% Year-to-date Change: -21.7% | |
| RCKT Links: Profile News Message Board | |
| Charts:- Daily , Weekly | |
| Add RCKT to Watchlist: View: Get Complete RCKT Trend Analysis ➞ | |
 | CYTK Cytokinetics, Incorporated |
| Sector: Health Care | |
| SubSector: Biotechnology | |
| MarketCap: 654.285 Millions | |
| Recent Price: 65.27 Market Intelligence Score: 32 | |
| Day Percent Change: 1.45% Day Change: 0.93 | |
| Week Change: -0.11% Year-to-date Change: -21.8% | |
| CYTK Links: Profile News Message Board | |
| Charts:- Daily , Weekly | |
| Add CYTK to Watchlist: View: Get Complete CYTK Trend Analysis ➞ | |
| To view more stocks, click on Next / Previous arrows or select different range: 0 - 25 , 25 - 50 , 50 - 75 , 75 - 100 , 100 - 125 , 125 - 150 , 150 - 175 , 175 - 200 , 200 - 225 , 225 - 250 , 250 - 275 , 275 - 300 , 300 - 325 , 325 - 350 , 350 - 375 , 375 - 400 | ||
| Click To Change The Sort Order: By Market Cap or Company Size Performance: Year-to-date, Week and Day | |
| Select Chart Type: | ||
|
Best Stocks Today 12Stocks.com |
© 2024 12Stocks.com Terms & Conditions Privacy Contact Us
All Information Provided Only For Education And Not To Be Used For Investing or Trading. See Terms & Conditions


One More Thing ... Get Best Stocks Delivered Daily!
Never Ever Miss A Move With Our Top Ten Stocks Lists
Find Best Stocks In Any Market - Bull or Bear Market
Take A Peek At Our Top Ten Stocks Lists: Daily, Weekly, Year-to-Date & Top Trends
Find Best Stocks In Any Market - Bull or Bear Market
Take A Peek At Our Top Ten Stocks Lists: Daily, Weekly, Year-to-Date & Top Trends
Biotech Stocks With Best Up Trends [0-bearish to 100-bullish]: Emergent Bio[100], Amgen [100], Quantum-Si [100], Janux [100], SIGA Technologies[100], Verrica [100], Genmab A/S[100], Black Diamond[100], PMV [100], Wave Life[100], Voyager [100]
Best Biotech Stocks Year-to-Date:
Pieris [5987.91%], Avenue [2868.94%], Precision [2782.19%], Inovio [2272.55%], Assembly [1503.46%], Agenus [1478.69%], Adverum nologies[1285.49%], NuCana [1252.27%], Affimed N.V[767.2%], Mesoblast [581.82%], Corbus [541.89%] Best Biotech Stocks This Week:
CytomX [178.62%], Emergent Bio[102.6%], Deciphera [73.24%], Cue Biopharma[56.04%], Codexis [47.37%], Abeona [41.1%], Seres [40.61%], Ardelyx [35.83%], Poseida [35.21%], CureVac N.V[33.91%], Janux [31.95%] Best Biotech Stocks Daily:
Ardelyx [28.42%], Emergent Bio[17.88%], Codexis [17.37%], Vaxxinity [17.27%], Cue Biopharma[13.30%], Vir nology[13.18%], Lantern Pharma[13.11%], Abeona [13.02%], CureVac N.V[12.64%], Ginkgo Bioworks[12.33%], Rani [12.13%]