
 Login Sign Up


| |||||
 |  | ||||

| 12Stocks.com Market Intelligence |
Best Biotech Stocks
|
|
| Quick Read: Best Biotech Stocks List By Performances & Trends: Daily, Weekly, Year-to-Date, Market Cap (Size) & Technical Trends | |||
| Best Biotech Stocks Views: Quick Browse View, Summary & Slide Show View | |||
| 12Stocks.com Biotech Stocks Performances & Trends Daily | |||||||||
|
|  The overall market intelligence score is 32 (0-bearish to 100-bullish) which puts Biotech sector in short term bearish to neutral trend. The market intelligence score from previous trading session is 10 and hence an improvement of trend.
| ||||||||
Here are the market intelligence trend scores of the most requested Biotech stocks at 12Stocks.com (click stock name for detailed review):
|


| 12Stocks.com: Investing in Biotech sector with Stocks | |
|
The following table helps investors and traders sort through current performance and trends (as measured by market intelligence score) of various
stocks in the Biotech sector. Quick View: Move mouse or cursor over stock symbol (ticker) to view short-term Technical chart and over stock name to view long term chart. Click on  to add stock symbol to your watchlist and to add stock symbol to your watchlist and  to view watchlist. Click on any ticker or stock name for detailed market intelligence report for that stock. to view watchlist. Click on any ticker or stock name for detailed market intelligence report for that stock. |
12Stocks.com Performance of Stocks in Biotech Sector
| Ticker | Stock Name | Watchlist | Category | Recent Price | Market Intelligence Score | Change % | YTD Change% |
| VNDA | Vanda |   | Biotechnology | 4.63 | 56 | -3.54% | 9.72% |
| KOD | Kodiak | | Biotechnology | 3.33 | 10 | -2.63% | 9.54% |
| MRNA | Moderna | | Biotechnology | 107.89 | 75 | 3.28% | 8.49% |
| CTMX | CytomX | | Biotechnology | 1.68 | 43 | 0.60% | 8.39% |
| OCS | Oculis Holding | | Biotechnology | 11.98 | 64 | 0.25% | 7.92% |
| ABUS | Arbutus Biopharma | | Biotechnology | 2.69 | 43 | 1.70% | 7.60% |
| TSVT | 2seventy bio | | Biotechnology | 4.63 | 27 | -0.43% | 7.05% |
| UTHR | United | | Biotechnology | 234.47 | 74 | 0.18% | 6.63% |
| NBIX | Neurocrine | | Biotechnology | 140.09 | 82 | 4.81% | 6.32% |
| PRQR | ProQR | | Biotechnology | 2.09 | 44 | 3.72% | 5.56% |
| HALO | Halozyme | | Biotechnology | 38.97 | 75 | 0.67% | 5.44% |
| LXRX | Lexicon | | Biotechnology | 1.61 | 35 | -5.85% | 5.23% |
| ALLO | Allogene | | Biotechnology | 3.37 | 15 | -0.88% | 4.98% |
| LCTX | Lineage Cell | | Biotechnology | 1.14 | 68 | 0.00% | 4.59% |
| PGEN | Precigen | | Biotechnology | 1.40 | 37 | 1.45% | 4.48% |
| ALXO | ALX Oncology | | Biotechnology | 15.50 | 74 | 8.92% | 4.17% |
| VBIV | VBI Vaccines | | Biotechnology | 0.61 | 17 | 0.91% | 3.57% |
| INZY | Inozyme Pharma | | Biotechnology | 4.40 | 10 | 0.23% | 3.41% |
| RPHM | Reneo | | Biotechnology | 1.68 | 46 | -0.89% | 3.40% |
| ITCI | Intra-Cellular Therapies | | Biotechnology | 74.01 | 95 | -0.71% | 3.34% |
| REGN | Regeneron | | Biotechnology | 907.32 | 32 | 0.80% | 3.31% |
| ARDX | Ardelyx | | Biotechnology | 6.39 | 25 | -1.84% | 3.06% |
| AVTE | Aerovate | | Biotechnology | 23.23 | 68 | 4.80% | 2.95% |
| CDMO | Avid Bioservices | | Biotechnology | 6.68 | 42 | 4.21% | 2.77% |
| MIST | Milestone | | Biotechnology | 1.70 | 53 | 4.29% | 1.80% |
| To view more stocks, click on Next / Previous arrows or select different range: 0 - 25 , 25 - 50 , 50 - 75 , 75 - 100 , 100 - 125 , 125 - 150 , 150 - 175 , 175 - 200 , 200 - 225 , 225 - 250 , 250 - 275 , 275 - 300 , 300 - 325 , 325 - 350 , 350 - 375 , 375 - 400 | ||
 | Click To Change The Sort Order: By Market Cap or Company Size Performance: Year-to-date, Week and Day |  |
|
Get the most comprehensive stock market coverage daily at 12Stocks.com ➞ Best Stocks Today ➞ Best Stocks Weekly ➞ Best Stocks Year-to-Date ➞ Best Stocks Trends ➞  Best Stocks Today 12Stocks.com Best Nasdaq Stocks ➞ Best S&P 500 Stocks ➞ Best Tech Stocks ➞ Best Biotech Stocks ➞ |
| Detailed Overview of Biotech Stocks |
| Biotech Technical Overview, Leaders & Laggards, Top Biotech ETF Funds & Detailed Biotech Stocks List, Charts, Trends & More |
| Biotech Sector: Technical Analysis, Trends & YTD Performance | |
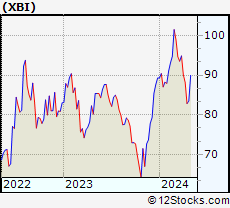
| Biotech sector, as represented by XBI, an exchange-traded fund [ETF] that holds basket of Biotech stocks (e.g, Amgen, Celgene) is down by -5.15% and is currently underperforming the overall market by -10.79% year-to-date. Below is a quick view of Technical charts and trends: | |
 XBI Weekly Chart |
|
| Long Term Trend: Not Good | |
| Medium Term Trend: Not Good | |
 XBI Daily Chart |
|
| Short Term Trend: Very Good | |
| Overall Trend Score: 32 | |
| YTD Performance: -5.15% | |
| **Trend Scores & Views Are Only For Educational Purposes And Not For Investing | |
| 12Stocks.com: Top Performing Biotech Sector Stocks | ||||||||||||||||||||||||||||||||||||||||||||||||
 The top performing Biotech sector stocks year to date are
Now, more recently, over last week, the top performing Biotech sector stocks on the move are


|
||||||||||||||||||||||||||||||||||||||||||||||||
| 12Stocks.com: Investing in Biotech Sector using Exchange Traded Funds | |
|
The following table shows list of key exchange traded funds (ETF) that
help investors track Biotech Index. For detailed view, check out our ETF Funds section of our website. Quick View: Move mouse or cursor over ETF symbol (ticker) to view short-term Technical chart and over ETF name to view long term chart. Click on ticker or stock name for detailed view. Click on to add stock symbol to your watchlist and to view watchlist. |
12Stocks.com List of ETFs that track Biotech Index
| Ticker | ETF Name | Watchlist | Recent Price | Market Intelligence Score | Change % | Week % | Year-to-date % |
| LABD | Biotech Bear 3X | | 10.07 | 42 | -6.33 | -6.76 | 3.92% |
| XBI | Biotech | | 84.69 | 32 | 2.28 | 2.25 | -5.15% |
| LABU | Biotech Bull 3X | | 91.98 | 32 | 6.42 | 6.89 | -24.59% |
| IBB | Biotechnology | | 128.02 | 42 | 1.51 | 2.65 | -5.76% |
| PBE | Biotech & Genome | | 61.14 | 49 | 0.82 | 2.16 | -7.14% |
| IXJ | Global Healthcare | | 89.62 | 75 | 1.37 | 2.13 | 3.34% |
| IYH | Healthcare | | 59.21 | 65 | 1.33 | 1.81 | 3.43% |
| IHF | Healthcare Providers | | 52.32 | 90 | 0.47 | 0.21 | -0.36% |
| CURE | Healthcare Bull 3X | | 108.12 | 39 | 3.52 | 4.64 | 6.27% |
| BIB | Biotechnology | | 50.33 | 39 | 2.51 | 4.42 | -11.78% |
| FBT | First NYSE | | 145.32 | 42 | 1.68 | 2.57 | -8.05% |
| BBH | Biotech | | 157.29 | 42 | 1.77 | 3.24 | -4.85% |
| BIS | Short Biotech | | 19.94 | 63 | -2.59 | -4.57 | 10.35% |
| PTH | DWA Healthcare Momentum | | 40.17 | 20 | 2.11 | 1.62 | 2.63% |
| BBP | Bio Biotechnology Products | | 52.39 | 32 | 1.87 | 3.89 | -9.81% |
| BTEC | Principal Healthcare Innovators | | 34.81 | 17 | 3.10 | 2.79 | -4.2% |
| BBC | Bio Biotechnology Clinical | | 25.67 | 51 | 3.26 | 3.89 | 4.98% |
| 12Stocks.com: Charts, Trends, Fundamental Data and Performances of Biotech Stocks | |
|
We now take in-depth look at all Biotech stocks including charts, multi-period performances and overall trends (as measured by market intelligence score). One can sort Biotech stocks (click link to choose) by Daily, Weekly and by Year-to-Date performances. Also, one can sort by size of the company or by market capitalization. |
| Select Your Default Chart Type: | |||||
| |||||
| Click on stock symbol or name for detailed view. Click on to add stock symbol to your watchlist and to view watchlist. Quick View: Move mouse or cursor over "Daily" to quickly view daily Technical stock chart and over "Weekly" to view weekly Technical stock chart. | |||||

 | VNDA Vanda Pharmaceuticals Inc. |
| Sector: Health Care | |
| SubSector: Biotechnology | |
| MarketCap: 464.585 Millions | |
| Recent Price: 4.63 Market Intelligence Score: 56 | |
| Day Percent Change: -3.54% Day Change: -0.17 | |
| Week Change: -9.39% Year-to-date Change: 9.7% | |
| VNDA Links: Profile News Message Board | |
| Charts:- Daily , Weekly | |
| Add VNDA to Watchlist: View: Get Complete VNDA Trend Analysis ➞ | |
 | KOD Kodiak Sciences Inc. |
| Sector: Health Care | |
| SubSector: Biotechnology | |
| MarketCap: 2132.15 Millions | |
| Recent Price: 3.33 Market Intelligence Score: 10 | |
| Day Percent Change: -2.63% Day Change: -0.09 | |
| Week Change: -0.89% Year-to-date Change: 9.5% | |
| KOD Links: Profile News Message Board | |
| Charts:- Daily , Weekly | |
| Add KOD to Watchlist: View: Get Complete KOD Trend Analysis ➞ | |
 | MRNA Moderna, Inc. |
| Sector: Health Care | |
| SubSector: Biotechnology | |
| MarketCap: 11006.4 Millions | |
| Recent Price: 107.89 Market Intelligence Score: 75 | |
| Day Percent Change: 3.28% Day Change: 3.43 | |
| Week Change: 6.36% Year-to-date Change: 8.5% | |
| MRNA Links: Profile News Message Board | |
| Charts:- Daily , Weekly | |
| Add MRNA to Watchlist: View: Get Complete MRNA Trend Analysis ➞ | |
 | CTMX CytomX Therapeutics, Inc. |
| Sector: Health Care | |
| SubSector: Biotechnology | |
| MarketCap: 264.885 Millions | |
| Recent Price: 1.68 Market Intelligence Score: 43 | |
| Day Percent Change: 0.60% Day Change: 0.01 | |
| Week Change: 0.6% Year-to-date Change: 8.4% | |
| CTMX Links: Profile News Message Board | |
| Charts:- Daily , Weekly | |
| Add CTMX to Watchlist: View: Get Complete CTMX Trend Analysis ➞ | |
 | OCS Oculis Holding AG |
| Sector: Health Care | |
| SubSector: Biotechnology | |
| MarketCap: 460 Millions | |
| Recent Price: 11.98 Market Intelligence Score: 64 | |
| Day Percent Change: 0.25% Day Change: 0.03 | |
| Week Change: 1.7% Year-to-date Change: 7.9% | |
| OCS Links: Profile News Message Board | |
| Charts:- Daily , Weekly | |
| Add OCS to Watchlist: View: Get Complete OCS Trend Analysis ➞ | |
 | ABUS Arbutus Biopharma Corporation |
| Sector: Health Care | |
| SubSector: Biotechnology | |
| MarketCap: 110.885 Millions | |
| Recent Price: 2.69 Market Intelligence Score: 43 | |
| Day Percent Change: 1.70% Day Change: 0.04 | |
| Week Change: -1.1% Year-to-date Change: 7.6% | |
| ABUS Links: Profile News Message Board | |
| Charts:- Daily , Weekly | |
| Add ABUS to Watchlist: View: Get Complete ABUS Trend Analysis ➞ | |
 | TSVT 2seventy bio, Inc. |
| Sector: Health Care | |
| SubSector: Biotechnology | |
| MarketCap: 504 Millions | |
| Recent Price: 4.63 Market Intelligence Score: 27 | |
| Day Percent Change: -0.43% Day Change: -0.02 | |
| Week Change: 2.43% Year-to-date Change: 7.1% | |
| TSVT Links: Profile News Message Board | |
| Charts:- Daily , Weekly | |
| Add TSVT to Watchlist: View: Get Complete TSVT Trend Analysis ➞ | |
 | UTHR United Therapeutics Corporation |
| Sector: Health Care | |
| SubSector: Biotechnology | |
| MarketCap: 3980.75 Millions | |
| Recent Price: 234.47 Market Intelligence Score: 74 | |
| Day Percent Change: 0.18% Day Change: 0.41 | |
| Week Change: -1.45% Year-to-date Change: 6.6% | |
| UTHR Links: Profile News Message Board | |
| Charts:- Daily , Weekly | |
| Add UTHR to Watchlist: View: Get Complete UTHR Trend Analysis ➞ | |
 | NBIX Neurocrine Biosciences, Inc. |
| Sector: Health Care | |
| SubSector: Biotechnology | |
| MarketCap: 7897.85 Millions | |
| Recent Price: 140.09 Market Intelligence Score: 82 | |
| Day Percent Change: 4.81% Day Change: 6.43 | |
| Week Change: 6.13% Year-to-date Change: 6.3% | |
| NBIX Links: Profile News Message Board | |
| Charts:- Daily , Weekly | |
| Add NBIX to Watchlist: View: Get Complete NBIX Trend Analysis ➞ | |
 | PRQR ProQR Therapeutics N.V. |
| Sector: Health Care | |
| SubSector: Biotechnology | |
| MarketCap: 324.385 Millions | |
| Recent Price: 2.09 Market Intelligence Score: 44 | |
| Day Percent Change: 3.72% Day Change: 0.07 | |
| Week Change: 5.03% Year-to-date Change: 5.6% | |
| PRQR Links: Profile News Message Board | |
| Charts:- Daily , Weekly | |
| Add PRQR to Watchlist: View: Get Complete PRQR Trend Analysis ➞ | |
 | HALO Halozyme Therapeutics, Inc. |
| Sector: Health Care | |
| SubSector: Biotechnology | |
| MarketCap: 2383.75 Millions | |
| Recent Price: 38.97 Market Intelligence Score: 75 | |
| Day Percent Change: 0.67% Day Change: 0.26 | |
| Week Change: 0.85% Year-to-date Change: 5.4% | |
| HALO Links: Profile News Message Board | |
| Charts:- Daily , Weekly | |
| Add HALO to Watchlist: View: Get Complete HALO Trend Analysis ➞ | |
 | LXRX Lexicon Pharmaceuticals, Inc. |
| Sector: Health Care | |
| SubSector: Biotechnology | |
| MarketCap: 251.185 Millions | |
| Recent Price: 1.61 Market Intelligence Score: 35 | |
| Day Percent Change: -5.85% Day Change: -0.10 | |
| Week Change: -2.42% Year-to-date Change: 5.2% | |
| LXRX Links: Profile News Message Board | |
| Charts:- Daily , Weekly | |
| Add LXRX to Watchlist: View: Get Complete LXRX Trend Analysis ➞ | |
 | ALLO Allogene Therapeutics, Inc. |
| Sector: Health Care | |
| SubSector: Biotechnology | |
| MarketCap: 2858.65 Millions | |
| Recent Price: 3.37 Market Intelligence Score: 15 | |
| Day Percent Change: -0.88% Day Change: -0.03 | |
| Week Change: -3.16% Year-to-date Change: 5.0% | |
| ALLO Links: Profile News Message Board | |
| Charts:- Daily , Weekly | |
| Add ALLO to Watchlist: View: Get Complete ALLO Trend Analysis ➞ | |
 | LCTX Lineage Cell Therapeutics, Inc. |
| Sector: Health Care | |
| SubSector: Biotechnology | |
| MarketCap: 141.285 Millions | |
| Recent Price: 1.14 Market Intelligence Score: 68 | |
| Day Percent Change: 0.00% Day Change: 0.00 | |
| Week Change: -0.87% Year-to-date Change: 4.6% | |
| LCTX Links: Profile News Message Board | |
| Charts:- Daily , Weekly | |
| Add LCTX to Watchlist: View: Get Complete LCTX Trend Analysis ➞ | |
 | PGEN Precigen, Inc. |
| Sector: Health Care | |
| SubSector: Biotechnology | |
| MarketCap: 564.785 Millions | |
| Recent Price: 1.40 Market Intelligence Score: 37 | |
| Day Percent Change: 1.45% Day Change: 0.02 | |
| Week Change: 5.26% Year-to-date Change: 4.5% | |
| PGEN Links: Profile News Message Board | |
| Charts:- Daily , Weekly | |
| Add PGEN to Watchlist: View: Get Complete PGEN Trend Analysis ➞ | |
 | ALXO ALX Oncology Holdings Inc. |
| Sector: Health Care | |
| SubSector: Biotechnology | |
| MarketCap: 41787 Millions | |
| Recent Price: 15.50 Market Intelligence Score: 74 | |
| Day Percent Change: 8.92% Day Change: 1.27 | |
| Week Change: -2.88% Year-to-date Change: 4.2% | |
| ALXO Links: Profile News Message Board | |
| Charts:- Daily , Weekly | |
| Add ALXO to Watchlist: View: Get Complete ALXO Trend Analysis ➞ | |
 | VBIV VBI Vaccines Inc. |
| Sector: Health Care | |
| SubSector: Biotechnology | |
| MarketCap: 139.785 Millions | |
| Recent Price: 0.61 Market Intelligence Score: 17 | |
| Day Percent Change: 0.91% Day Change: 0.01 | |
| Week Change: -3.98% Year-to-date Change: 3.6% | |
| VBIV Links: Profile News Message Board | |
| Charts:- Daily , Weekly | |
| Add VBIV to Watchlist: View: Get Complete VBIV Trend Analysis ➞ | |
 | INZY Inozyme Pharma, Inc. |
| Sector: Health Care | |
| SubSector: Biotechnology | |
| MarketCap: 53487 Millions | |
| Recent Price: 4.40 Market Intelligence Score: 10 | |
| Day Percent Change: 0.23% Day Change: 0.01 | |
| Week Change: -1.9% Year-to-date Change: 3.4% | |
| INZY Links: Profile News Message Board | |
| Charts:- Daily , Weekly | |
| Add INZY to Watchlist: View: Get Complete INZY Trend Analysis ➞ | |
 | RPHM Reneo Pharmaceuticals, Inc. |
| Sector: Health Care | |
| SubSector: Biotechnology | |
| MarketCap: 233 Millions | |
| Recent Price: 1.68 Market Intelligence Score: 46 | |
| Day Percent Change: -0.89% Day Change: -0.01 | |
| Week Change: -3.74% Year-to-date Change: 3.4% | |
| RPHM Links: Profile News Message Board | |
| Charts:- Daily , Weekly | |
| Add RPHM to Watchlist: View: Get Complete RPHM Trend Analysis ➞ | |
 | ITCI Intra-Cellular Therapies, Inc. |
| Sector: Health Care | |
| SubSector: Biotechnology | |
| MarketCap: 991.885 Millions | |
| Recent Price: 74.01 Market Intelligence Score: 95 | |
| Day Percent Change: -0.71% Day Change: -0.53 | |
| Week Change: 2.27% Year-to-date Change: 3.3% | |
| ITCI Links: Profile News Message Board | |
| Charts:- Daily , Weekly | |
| Add ITCI to Watchlist: View: Get Complete ITCI Trend Analysis ➞ | |
 | REGN Regeneron Pharmaceuticals, Inc. |
| Sector: Health Care | |
| SubSector: Biotechnology | |
| MarketCap: 51903.7 Millions | |
| Recent Price: 907.32 Market Intelligence Score: 32 | |
| Day Percent Change: 0.80% Day Change: 7.16 | |
| Week Change: 1.17% Year-to-date Change: 3.3% | |
| REGN Links: Profile News Message Board | |
| Charts:- Daily , Weekly | |
| Add REGN to Watchlist: View: Get Complete REGN Trend Analysis ➞ | |
 | ARDX Ardelyx, Inc. |
| Sector: Health Care | |
| SubSector: Biotechnology | |
| MarketCap: 541.985 Millions | |
| Recent Price: 6.39 Market Intelligence Score: 25 | |
| Day Percent Change: -1.84% Day Change: -0.12 | |
| Week Change: -1.39% Year-to-date Change: 3.1% | |
| ARDX Links: Profile News Message Board | |
| Charts:- Daily , Weekly | |
| Add ARDX to Watchlist: View: Get Complete ARDX Trend Analysis ➞ | |
 | AVTE Aerovate Therapeutics, Inc. |
| Sector: Health Care | |
| SubSector: Biotechnology | |
| MarketCap: 478 Millions | |
| Recent Price: 23.23 Market Intelligence Score: 68 | |
| Day Percent Change: 4.80% Day Change: 1.06 | |
| Week Change: 5.37% Year-to-date Change: 3.0% | |
| AVTE Links: Profile News Message Board | |
| Charts:- Daily , Weekly | |
| Add AVTE to Watchlist: View: Get Complete AVTE Trend Analysis ➞ | |
 | CDMO Avid Bioservices, Inc. |
| Sector: Health Care | |
| SubSector: Biotechnology | |
| MarketCap: 203.685 Millions | |
| Recent Price: 6.68 Market Intelligence Score: 42 | |
| Day Percent Change: 4.21% Day Change: 0.27 | |
| Week Change: 4.21% Year-to-date Change: 2.8% | |
| CDMO Links: Profile News Message Board | |
| Charts:- Daily , Weekly | |
| Add CDMO to Watchlist: View: Get Complete CDMO Trend Analysis ➞ | |
 | MIST Milestone Pharmaceuticals Inc. |
| Sector: Health Care | |
| SubSector: Biotechnology | |
| MarketCap: 342.685 Millions | |
| Recent Price: 1.70 Market Intelligence Score: 53 | |
| Day Percent Change: 4.29% Day Change: 0.07 | |
| Week Change: 3.66% Year-to-date Change: 1.8% | |
| MIST Links: Profile News Message Board | |
| Charts:- Daily , Weekly | |
| Add MIST to Watchlist: View: Get Complete MIST Trend Analysis ➞ | |
| To view more stocks, click on Next / Previous arrows or select different range: 0 - 25 , 25 - 50 , 50 - 75 , 75 - 100 , 100 - 125 , 125 - 150 , 150 - 175 , 175 - 200 , 200 - 225 , 225 - 250 , 250 - 275 , 275 - 300 , 300 - 325 , 325 - 350 , 350 - 375 , 375 - 400 | ||
| Click To Change The Sort Order: By Market Cap or Company Size Performance: Year-to-date, Week and Day | |
| Select Chart Type: | ||
|
Best Stocks Today 12Stocks.com |
© 2024 12Stocks.com Terms & Conditions Privacy Contact Us
All Information Provided Only For Education And Not To Be Used For Investing or Trading. See Terms & Conditions


One More Thing ... Get Best Stocks Delivered Daily!
Never Ever Miss A Move With Our Top Ten Stocks Lists
Find Best Stocks In Any Market - Bull or Bear Market
Take A Peek At Our Top Ten Stocks Lists: Daily, Weekly, Year-to-Date & Top Trends
Find Best Stocks In Any Market - Bull or Bear Market
Take A Peek At Our Top Ten Stocks Lists: Daily, Weekly, Year-to-Date & Top Trends
Biotech Stocks With Best Up Trends [0-bearish to 100-bullish]: Pieris [100], PureTech Health[100], Day One[100], NewAmsterdam Pharma[100], Agios [100], Avadel [100], BioMarin [100], Mesoblast [95], Emergent Bio[95], Blueprint Medicines[95], Exelixis [95]
Best Biotech Stocks Year-to-Date:
Pieris [6658.24%], Precision [2702.74%], Inovio [1933.33%], Assembly [1518.1%], Adverum nologies[1435.6%], NuCana [1252.27%], Affimed N.V[700%], Agenus [680.29%], Corbus [524.83%], Mesoblast [445.45%], Janux [364.03%] Best Biotech Stocks This Week:
Pieris [8382.76%], Seres [35.74%], BeyondSpring [27.22%], ProKidney [24.75%], Agenus [21.66%], Annovis Bio[18.8%], Generation Bio[17.69%], Molecular Partners[16.87%], Adaptimmune [16.72%], Longboard [16.23%], Mesoblast [15.16%] Best Biotech Stocks Daily:
Pieris [8318.89%], Seres [21.68%], Generation Bio[16.01%], IGM [14.07%], Adaptimmune [12.87%], Agenus [11.96%], Galectin [10.64%], PureTech Health[10.55%], Personalis [9.52%], Esperion [9.42%], ALX Oncology[8.92%]