
 Login Sign Up


| |||||
 |  | ||||

| 12Stocks.com Market Intelligence |
Best Biotech Stocks
|
|
| Quick Read: Best Biotech Stocks List By Performances & Trends: Daily, Weekly, Year-to-Date, Market Cap (Size) & Technical Trends | |||
| Best Biotech Stocks Views: Quick Browse View, Summary & Slide Show View | |||
| 12Stocks.com Biotech Stocks Performances & Trends Daily | |||||||||
|
|  The overall market intelligence score is 25 (0-bearish to 100-bullish) which puts Biotech sector in short term bearish to neutral trend. The market intelligence score from previous trading session is 32 and a deterioration of trend continues.
| ||||||||
Here are the market intelligence trend scores of the most requested Biotech stocks at 12Stocks.com (click stock name for detailed review):
|


| 12Stocks.com: Investing in Biotech sector with Stocks | |
|
The following table helps investors and traders sort through current performance and trends (as measured by market intelligence score) of various
stocks in the Biotech sector. Quick View: Move mouse or cursor over stock symbol (ticker) to view short-term Technical chart and over stock name to view long term chart. Click on  to add stock symbol to your watchlist and to add stock symbol to your watchlist and  to view watchlist. Click on any ticker or stock name for detailed market intelligence report for that stock. to view watchlist. Click on any ticker or stock name for detailed market intelligence report for that stock. |
12Stocks.com Performance of Stocks in Biotech Sector
| Ticker | Stock Name | Watchlist | Category | Recent Price | Market Intelligence Score | Change % | YTD Change% |
| GMAB | Genmab A/S |   | Biotechnology | 27.47 | 46 | -3.51% | -13.72% |
| CRSP | CRISPR | | Biotechnology | 53.73 | 25 | -3.45% | -14.17% |
| KALV | KalVista | | Biotechnology | 10.49 | 0 | 1.35% | -14.37% |
| IMCR | Immunocore | | Biotechnology | 58.00 | 49 | 1.91% | -14.57% |
| BMRN | BioMarin | | Biotechnology | 82.17 | 0 | -9.90% | -14.78% |
| MTNB | Matinas BioPharma | | Biotechnology | 0.18 | 25 | 1.10% | -14.99% |
| KMDA | Kamada | | Biotechnology | 5.20 | 35 | 0.39% | -15.03% |
| ORIC | ORIC | | Biotechnology | 7.76 | 10 | -3.96% | -15.84% |
| MDGL | Madrigal | | Biotechnology | 194.38 | 23 | -5.02% | -15.99% |
| BLTE | Belite Bio | | Biotechnology | 38.00 | 35 | 2.07% | -16.58% |
| SLGL | Sol-Gel Technologies | | Biotechnology | 0.92 | 30 | 0.00% | -16.74% |
| ARCT | Arcturus | | Biotechnology | 26.20 | 25 | -2.89% | -16.90% |
| RYTM | Rhythm | | Biotechnology | 38.19 | 20 | -3.83% | -16.92% |
| MIRM | Mirum | | Biotechnology | 24.52 | 42 | 2.08% | -16.94% |
| IONS | Ionis | | Biotechnology | 41.84 | 49 | -1.44% | -17.30% |
| BGNE | BeiGene | | Biotechnology | 148.56 | 49 | 3.08% | -17.63% |
| FENC | Fennec | | Biotechnology | 9.24 | 10 | 1.87% | -17.65% |
| NVAX | Novavax | | Biotechnology | 3.95 | 61 | -4.82% | -17.71% |
| KZR | Kezar Life | | Biotechnology | 0.78 | 50 | -2.72% | -17.71% |
| BNTX | BioNTech SE | | Biotechnology | 86.74 | 37 | -1.53% | -17.81% |
| INCY | yte | | Biotechnology | 51.18 | 10 | -1.08% | -18.49% |
| TGTX | TG | | Biotechnology | 13.91 | 35 | -0.50% | -18.56% |
| TBPH | Theravance Biopharma | | Biotechnology | 9.14 | 7 | -0.33% | -18.68% |
| EBS | Emergent Bio | | Biotechnology | 1.95 | 68 | -10.55% | -18.75% |
| TECH | Bio-Techne | | Biotechnology | 62.66 | 35 | -1.35% | -18.79% |
| To view more stocks, click on Next / Previous arrows or select different range: 0 - 25 , 25 - 50 , 50 - 75 , 75 - 100 , 100 - 125 , 125 - 150 , 150 - 175 , 175 - 200 , 200 - 225 , 225 - 250 , 250 - 275 , 275 - 300 , 300 - 325 , 325 - 350 , 350 - 375 , 375 - 400 | ||
 | Click To Change The Sort Order: By Market Cap or Company Size Performance: Year-to-date, Week and Day |  |
|
Get the most comprehensive stock market coverage daily at 12Stocks.com ➞ Best Stocks Today ➞ Best Stocks Weekly ➞ Best Stocks Year-to-Date ➞ Best Stocks Trends ➞  Best Stocks Today 12Stocks.com Best Nasdaq Stocks ➞ Best S&P 500 Stocks ➞ Best Tech Stocks ➞ Best Biotech Stocks ➞ |
| Detailed Overview of Biotech Stocks |
| Biotech Technical Overview, Leaders & Laggards, Top Biotech ETF Funds & Detailed Biotech Stocks List, Charts, Trends & More |
| Biotech Sector: Technical Analysis, Trends & YTD Performance | |
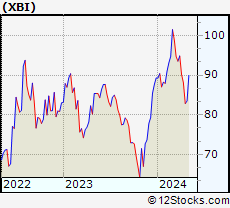
| Biotech sector, as represented by XBI, an exchange-traded fund [ETF] that holds basket of Biotech stocks (e.g, Amgen, Celgene) is down by -7.92% and is currently underperforming the overall market by -13.08% year-to-date. Below is a quick view of Technical charts and trends: | |
 XBI Weekly Chart |
|
| Long Term Trend: Not Good | |
| Medium Term Trend: Not Good | |
 XBI Daily Chart |
|
| Short Term Trend: Very Good | |
| Overall Trend Score: 25 | |
| YTD Performance: -7.92% | |
| **Trend Scores & Views Are Only For Educational Purposes And Not For Investing | |
| 12Stocks.com: Top Performing Biotech Sector Stocks | ||||||||||||||||||||||||||||||||||||||||||||||||
 The top performing Biotech sector stocks year to date are
Now, more recently, over last week, the top performing Biotech sector stocks on the move are


|
||||||||||||||||||||||||||||||||||||||||||||||||
| 12Stocks.com: Investing in Biotech Sector using Exchange Traded Funds | |
|
The following table shows list of key exchange traded funds (ETF) that
help investors track Biotech Index. For detailed view, check out our ETF Funds section of our website. Quick View: Move mouse or cursor over ETF symbol (ticker) to view short-term Technical chart and over ETF name to view long term chart. Click on ticker or stock name for detailed view. Click on to add stock symbol to your watchlist and to view watchlist. |
12Stocks.com List of ETFs that track Biotech Index
| Ticker | ETF Name | Watchlist | Recent Price | Market Intelligence Score | Change % | Week % | Year-to-date % |
| LABD | Biotech Bear 3X | | 11.03 | 75 | 6.36 | 2.13 | 13.83% |
| XBI | Biotech | | 82.22 | 25 | -2.05 | -0.74 | -7.92% |
| LABU | Biotech Bull 3X | | 83.72 | 25 | -6.35 | -2.71 | -31.36% |
| IBB | Biotechnology | | 125.67 | 18 | -1.64 | 0.76 | -7.49% |
| IYH | Healthcare | | 58.68 | 45 | -0.69 | 0.89 | 2.5% |
| IHF | Healthcare Providers | | 52.11 | 55 | -0.29 | -0.19 | -0.76% |
| IXJ | Global Healthcare | | 88.91 | 25 | -0.45 | 1.32 | 2.53% |
| BBH | Biotech | | 154.61 | 49 | -1.73 | 1.48 | -6.47% |
| FBT | First NYSE | | 142.59 | 25 | -1.93 | 0.64 | -9.78% |
| CURE | Healthcare Bull 3X | | 105.32 | 25 | -2.35 | 1.92 | 3.52% |
| BIB | Biotechnology | | 48.83 | 32 | -2.69 | 1.31 | -14.41% |
| BIS | Short Biotech | | 20.59 | 61 | 2.49 | -1.46 | 13.95% |
| PTH | DWA Healthcare Momentum | | 39.60 | 46 | -0.08 | 0.18 | 1.18% |
| PBE | Biotech & Genome | | 59.85 | 32 | -1.69 | 0 | -9.1% |
| BBC | Bio Biotechnology Clinical | | 24.70 | 36 | -3.62 | -0.04 | 1.01% |
| BTEC | Principal Healthcare Innovators | | 34.21 | 32 | 0.02 | 1.04 | -5.83% |
| BBP | Bio Biotechnology Products | | 51.14 | 35 | -2.40 | 1.41 | -11.96% |
| 12Stocks.com: Charts, Trends, Fundamental Data and Performances of Biotech Stocks | |
|
We now take in-depth look at all Biotech stocks including charts, multi-period performances and overall trends (as measured by market intelligence score). One can sort Biotech stocks (click link to choose) by Daily, Weekly and by Year-to-Date performances. Also, one can sort by size of the company or by market capitalization. |
| Select Your Default Chart Type: | |||||
| |||||
| Click on stock symbol or name for detailed view. Click on to add stock symbol to your watchlist and to view watchlist. Quick View: Move mouse or cursor over "Daily" to quickly view daily Technical stock chart and over "Weekly" to view weekly Technical stock chart. | |||||

 | GMAB Genmab A/S |
| Sector: Health Care | |
| SubSector: Biotechnology | |
| MarketCap: 12482.3 Millions | |
| Recent Price: 27.47 Market Intelligence Score: 46 | |
| Day Percent Change: -3.51% Day Change: -1.00 | |
| Week Change: -4.35% Year-to-date Change: -13.7% | |
| GMAB Links: Profile News Message Board | |
| Charts:- Daily , Weekly | |
| Add GMAB to Watchlist: View: Get Complete GMAB Trend Analysis ➞ | |
 | CRSP CRISPR Therapeutics AG |
| Sector: Health Care | |
| SubSector: Biotechnology | |
| MarketCap: 2691.35 Millions | |
| Recent Price: 53.73 Market Intelligence Score: 25 | |
| Day Percent Change: -3.45% Day Change: -1.92 | |
| Week Change: -2.4% Year-to-date Change: -14.2% | |
| CRSP Links: Profile News Message Board | |
| Charts:- Daily , Weekly | |
| Add CRSP to Watchlist: View: Get Complete CRSP Trend Analysis ➞ | |
 | KALV KalVista Pharmaceuticals, Inc. |
| Sector: Health Care | |
| SubSector: Biotechnology | |
| MarketCap: 138.385 Millions | |
| Recent Price: 10.49 Market Intelligence Score: 0 | |
| Day Percent Change: 1.35% Day Change: 0.14 | |
| Week Change: -9.33% Year-to-date Change: -14.4% | |
| KALV Links: Profile News Message Board | |
| Charts:- Daily , Weekly | |
| Add KALV to Watchlist: View: Get Complete KALV Trend Analysis ➞ | |
 | IMCR Immunocore Holdings plc |
| Sector: Health Care | |
| SubSector: Biotechnology | |
| MarketCap: 2830 Millions | |
| Recent Price: 58.00 Market Intelligence Score: 49 | |
| Day Percent Change: 1.91% Day Change: 1.09 | |
| Week Change: 4.17% Year-to-date Change: -14.6% | |
| IMCR Links: Profile News Message Board | |
| Charts:- Daily , Weekly | |
| Add IMCR to Watchlist: View: Get Complete IMCR Trend Analysis ➞ | |
 | BMRN BioMarin Pharmaceutical Inc. |
| Sector: Health Care | |
| SubSector: Biotechnology | |
| MarketCap: 14887.5 Millions | |
| Recent Price: 82.17 Market Intelligence Score: 0 | |
| Day Percent Change: -9.90% Day Change: -9.03 | |
| Week Change: -7.29% Year-to-date Change: -14.8% | |
| BMRN Links: Profile News Message Board | |
| Charts:- Daily , Weekly | |
| Add BMRN to Watchlist: View: Get Complete BMRN Trend Analysis ➞ | |
 | MTNB Matinas BioPharma Holdings, Inc. |
| Sector: Health Care | |
| SubSector: Biotechnology | |
| MarketCap: 147.085 Millions | |
| Recent Price: 0.18 Market Intelligence Score: 25 | |
| Day Percent Change: 1.10% Day Change: 0.00 | |
| Week Change: -2.08% Year-to-date Change: -15.0% | |
| MTNB Links: Profile News Message Board | |
| Charts:- Daily , Weekly | |
| Add MTNB to Watchlist: View: Get Complete MTNB Trend Analysis ➞ | |
 | KMDA Kamada Ltd. |
| Sector: Health Care | |
| SubSector: Biotechnology | |
| MarketCap: 238.685 Millions | |
| Recent Price: 5.20 Market Intelligence Score: 35 | |
| Day Percent Change: 0.39% Day Change: 0.02 | |
| Week Change: 2.97% Year-to-date Change: -15.0% | |
| KMDA Links: Profile News Message Board | |
| Charts:- Daily , Weekly | |
| Add KMDA to Watchlist: View: Get Complete KMDA Trend Analysis ➞ | |
 | ORIC ORIC Pharmaceuticals, Inc. |
| Sector: Health Care | |
| SubSector: Biotechnology | |
| MarketCap: 12787 Millions | |
| Recent Price: 7.76 Market Intelligence Score: 10 | |
| Day Percent Change: -3.96% Day Change: -0.32 | |
| Week Change: -15.1% Year-to-date Change: -15.8% | |
| ORIC Links: Profile News Message Board | |
| Charts:- Daily , Weekly | |
| Add ORIC to Watchlist: View: Get Complete ORIC Trend Analysis ➞ | |
 | MDGL Madrigal Pharmaceuticals, Inc. |
| Sector: Health Care | |
| SubSector: Biotechnology | |
| MarketCap: 1104.35 Millions | |
| Recent Price: 194.38 Market Intelligence Score: 23 | |
| Day Percent Change: -5.02% Day Change: -10.27 | |
| Week Change: -8.45% Year-to-date Change: -16.0% | |
| MDGL Links: Profile News Message Board | |
| Charts:- Daily , Weekly | |
| Add MDGL to Watchlist: View: Get Complete MDGL Trend Analysis ➞ | |
 | BLTE Belite Bio, Inc |
| Sector: Health Care | |
| SubSector: Biotechnology | |
| MarketCap: 404 Millions | |
| Recent Price: 38.00 Market Intelligence Score: 35 | |
| Day Percent Change: 2.07% Day Change: 0.77 | |
| Week Change: 13.67% Year-to-date Change: -16.6% | |
| BLTE Links: Profile News Message Board | |
| Charts:- Daily , Weekly | |
| Add BLTE to Watchlist: View: Get Complete BLTE Trend Analysis ➞ | |
 | SLGL Sol-Gel Technologies Ltd. |
| Sector: Health Care | |
| SubSector: Biotechnology | |
| MarketCap: 183.285 Millions | |
| Recent Price: 0.92 Market Intelligence Score: 30 | |
| Day Percent Change: 0.00% Day Change: 0.00 | |
| Week Change: 2.21% Year-to-date Change: -16.7% | |
| SLGL Links: Profile News Message Board | |
| Charts:- Daily , Weekly | |
| Add SLGL to Watchlist: View: Get Complete SLGL Trend Analysis ➞ | |
 | ARCT Arcturus Therapeutics Holdings Inc. |
| Sector: Health Care | |
| SubSector: Biotechnology | |
| MarketCap: 241.385 Millions | |
| Recent Price: 26.20 Market Intelligence Score: 25 | |
| Day Percent Change: -2.89% Day Change: -0.78 | |
| Week Change: 0.79% Year-to-date Change: -16.9% | |
| ARCT Links: Profile News Message Board | |
| Charts:- Daily , Weekly | |
| Add ARCT to Watchlist: View: Get Complete ARCT Trend Analysis ➞ | |
 | RYTM Rhythm Pharmaceuticals, Inc. |
| Sector: Health Care | |
| SubSector: Biotechnology | |
| MarketCap: 643.685 Millions | |
| Recent Price: 38.19 Market Intelligence Score: 20 | |
| Day Percent Change: -3.83% Day Change: -1.52 | |
| Week Change: 0.57% Year-to-date Change: -16.9% | |
| RYTM Links: Profile News Message Board | |
| Charts:- Daily , Weekly | |
| Add RYTM to Watchlist: View: Get Complete RYTM Trend Analysis ➞ | |
 | MIRM Mirum Pharmaceuticals, Inc. |
| Sector: Health Care | |
| SubSector: Biotechnology | |
| MarketCap: 309.585 Millions | |
| Recent Price: 24.52 Market Intelligence Score: 42 | |
| Day Percent Change: 2.08% Day Change: 0.50 | |
| Week Change: 2.9% Year-to-date Change: -16.9% | |
| MIRM Links: Profile News Message Board | |
| Charts:- Daily , Weekly | |
| Add MIRM to Watchlist: View: Get Complete MIRM Trend Analysis ➞ | |
 | IONS Ionis Pharmaceuticals, Inc. |
| Sector: Health Care | |
| SubSector: Biotechnology | |
| MarketCap: 6725.05 Millions | |
| Recent Price: 41.84 Market Intelligence Score: 49 | |
| Day Percent Change: -1.44% Day Change: -0.61 | |
| Week Change: 2.85% Year-to-date Change: -17.3% | |
| IONS Links: Profile News Message Board | |
| Charts:- Daily , Weekly | |
| Add IONS to Watchlist: View: Get Complete IONS Trend Analysis ➞ | |
 | BGNE BeiGene, Ltd. |
| Sector: Health Care | |
| SubSector: Biotechnology | |
| MarketCap: 10838.5 Millions | |
| Recent Price: 148.56 Market Intelligence Score: 49 | |
| Day Percent Change: 3.08% Day Change: 4.44 | |
| Week Change: 14.7% Year-to-date Change: -17.6% | |
| BGNE Links: Profile News Message Board | |
| Charts:- Daily , Weekly | |
| Add BGNE to Watchlist: View: Get Complete BGNE Trend Analysis ➞ | |
 | FENC Fennec Pharmaceuticals Inc. |
| Sector: Health Care | |
| SubSector: Biotechnology | |
| MarketCap: 126.785 Millions | |
| Recent Price: 9.24 Market Intelligence Score: 10 | |
| Day Percent Change: 1.87% Day Change: 0.17 | |
| Week Change: -0.86% Year-to-date Change: -17.7% | |
| FENC Links: Profile News Message Board | |
| Charts:- Daily , Weekly | |
| Add FENC to Watchlist: View: Get Complete FENC Trend Analysis ➞ | |
 | NVAX Novavax, Inc. |
| Sector: Health Care | |
| SubSector: Biotechnology | |
| MarketCap: 376.185 Millions | |
| Recent Price: 3.95 Market Intelligence Score: 61 | |
| Day Percent Change: -4.82% Day Change: -0.20 | |
| Week Change: -0.5% Year-to-date Change: -17.7% | |
| NVAX Links: Profile News Message Board | |
| Charts:- Daily , Weekly | |
| Add NVAX to Watchlist: View: Get Complete NVAX Trend Analysis ➞ | |
 | KZR Kezar Life Sciences, Inc. |
| Sector: Health Care | |
| SubSector: Biotechnology | |
| MarketCap: 174.885 Millions | |
| Recent Price: 0.78 Market Intelligence Score: 50 | |
| Day Percent Change: -2.72% Day Change: -0.02 | |
| Week Change: -1% Year-to-date Change: -17.7% | |
| KZR Links: Profile News Message Board | |
| Charts:- Daily , Weekly | |
| Add KZR to Watchlist: View: Get Complete KZR Trend Analysis ➞ | |
 | BNTX BioNTech SE |
| Sector: Health Care | |
| SubSector: Biotechnology | |
| MarketCap: 11933.7 Millions | |
| Recent Price: 86.74 Market Intelligence Score: 37 | |
| Day Percent Change: -1.53% Day Change: -1.35 | |
| Week Change: -0.09% Year-to-date Change: -17.8% | |
| BNTX Links: Profile News Message Board | |
| Charts:- Daily , Weekly | |
| Add BNTX to Watchlist: View: Get Complete BNTX Trend Analysis ➞ | |
 | INCY Incyte Corporation |
| Sector: Health Care | |
| SubSector: Biotechnology | |
| MarketCap: 15343.2 Millions | |
| Recent Price: 51.18 Market Intelligence Score: 10 | |
| Day Percent Change: -1.08% Day Change: -0.56 | |
| Week Change: -2.23% Year-to-date Change: -18.5% | |
| INCY Links: Profile News Message Board | |
| Charts:- Daily , Weekly | |
| Add INCY to Watchlist: View: Get Complete INCY Trend Analysis ➞ | |
 | TGTX TG Therapeutics, Inc. |
| Sector: Health Care | |
| SubSector: Biotechnology | |
| MarketCap: 1022.85 Millions | |
| Recent Price: 13.91 Market Intelligence Score: 35 | |
| Day Percent Change: -0.50% Day Change: -0.07 | |
| Week Change: 0.94% Year-to-date Change: -18.6% | |
| TGTX Links: Profile News Message Board | |
| Charts:- Daily , Weekly | |
| Add TGTX to Watchlist: View: Get Complete TGTX Trend Analysis ➞ | |
 | TBPH Theravance Biopharma, Inc. |
| Sector: Health Care | |
| SubSector: Biotechnology | |
| MarketCap: 1404.55 Millions | |
| Recent Price: 9.14 Market Intelligence Score: 7 | |
| Day Percent Change: -0.33% Day Change: -0.03 | |
| Week Change: -2.14% Year-to-date Change: -18.7% | |
| TBPH Links: Profile News Message Board | |
| Charts:- Daily , Weekly | |
| Add TBPH to Watchlist: View: Get Complete TBPH Trend Analysis ➞ | |
 | EBS Emergent BioSolutions Inc. |
| Sector: Health Care | |
| SubSector: Biotechnology | |
| MarketCap: 2417.65 Millions | |
| Recent Price: 1.95 Market Intelligence Score: 68 | |
| Day Percent Change: -10.55% Day Change: -0.23 | |
| Week Change: -4.41% Year-to-date Change: -18.8% | |
| EBS Links: Profile News Message Board | |
| Charts:- Daily , Weekly | |
| Add EBS to Watchlist: View: Get Complete EBS Trend Analysis ➞ | |
 | TECH Bio-Techne Corporation |
| Sector: Health Care | |
| SubSector: Biotechnology | |
| MarketCap: 6958.05 Millions | |
| Recent Price: 62.66 Market Intelligence Score: 35 | |
| Day Percent Change: -1.35% Day Change: -0.86 | |
| Week Change: 0.87% Year-to-date Change: -18.8% | |
| TECH Links: Profile News Message Board | |
| Charts:- Daily , Weekly | |
| Add TECH to Watchlist: View: Get Complete TECH Trend Analysis ➞ | |
| To view more stocks, click on Next / Previous arrows or select different range: 0 - 25 , 25 - 50 , 50 - 75 , 75 - 100 , 100 - 125 , 125 - 150 , 150 - 175 , 175 - 200 , 200 - 225 , 225 - 250 , 250 - 275 , 275 - 300 , 300 - 325 , 325 - 350 , 350 - 375 , 375 - 400 | ||
| Click To Change The Sort Order: By Market Cap or Company Size Performance: Year-to-date, Week and Day | |
| Select Chart Type: | ||
|
Best Stocks Today 12Stocks.com |
© 2024 12Stocks.com Terms & Conditions Privacy Contact Us
All Information Provided Only For Education And Not To Be Used For Investing or Trading. See Terms & Conditions


One More Thing ... Get Best Stocks Delivered Daily!
Never Ever Miss A Move With Our Top Ten Stocks Lists
Find Best Stocks In Any Market - Bull or Bear Market
Take A Peek At Our Top Ten Stocks Lists: Daily, Weekly, Year-to-Date & Top Trends
Find Best Stocks In Any Market - Bull or Bear Market
Take A Peek At Our Top Ten Stocks Lists: Daily, Weekly, Year-to-Date & Top Trends
Biotech Stocks With Best Up Trends [0-bearish to 100-bullish]: Annovis Bio[100], Agios [100], Agenus [95], Mesoblast [95], Cullinan Oncology[93], Avadel [93], Pieris [93], NewAmsterdam Pharma[93], PureTech Health[93], Exelixis [90], ALX Oncology[88]
Best Biotech Stocks Year-to-Date:
Pieris [6273.63%], Precision [2590.41%], Inovio [1885.29%], Assembly [1529.07%], NuCana [1198.17%], Adverum nologies[1147.34%], Agenus [902.54%], Affimed N.V[680.8%], Mesoblast [459.09%], Corbus [454.64%], Janux [338.34%] Best Biotech Stocks This Week:
Pieris [7900%], Agenus [56.31%], ProKidney [32.84%], Seres [32.65%], Annovis Bio[30%], BeyondSpring [26.11%], Cullinan Oncology[22.92%], Pharvaris N.V[18.84%], Mesoblast [18.04%], BeiGene [14.7%], Avid Bioservices[14.2%] Best Biotech Stocks Daily:
Galera [13.74%], Agenus [11.86%], ADiTx [10.57%], Apollomics [9.94%], Pharming [9.06%], Structure [8.13%], Pharvaris N.V[7.91%], ProKidney [7.75%], Avid Bioservices[7.17%], Merus N.V[7.05%], Zura Bio[6.75%]