
 Login Sign Up


| |||||
 |  | ||||

| 12Stocks.com Market Intelligence |
Best Biotech Stocks
|
|
| Quick Read: Best Biotech Stocks List By Performances & Trends: Daily, Weekly, Year-to-Date, Market Cap (Size) & Technical Trends | |||
| Best Biotech Stocks Views: Quick Browse View, Summary & Slide Show View | |||
| 12Stocks.com Biotech Stocks Performances & Trends Daily | |||||||||
|
|  The overall market intelligence score is 25 (0-bearish to 100-bullish) which puts Biotech sector in short term bearish to neutral trend. The market intelligence score from previous trading session is 32 and a deterioration of trend continues.
| ||||||||
Here are the market intelligence trend scores of the most requested Biotech stocks at 12Stocks.com (click stock name for detailed review):
|


| 12Stocks.com: Investing in Biotech sector with Stocks | |
|
The following table helps investors and traders sort through current performance and trends (as measured by market intelligence score) of various
stocks in the Biotech sector. Quick View: Move mouse or cursor over stock symbol (ticker) to view short-term Technical chart and over stock name to view long term chart. Click on  to add stock symbol to your watchlist and to add stock symbol to your watchlist and  to view watchlist. Click on any ticker or stock name for detailed market intelligence report for that stock. to view watchlist. Click on any ticker or stock name for detailed market intelligence report for that stock. |
12Stocks.com Performance of Stocks in Biotech Sector
| Ticker | Stock Name | Watchlist | Category | Recent Price | Market Intelligence Score | Change % | YTD Change% |
| CARA | Cara |   | Biotechnology | 0.70 | 61 | 4.23% | -5.79% |
| OCUL | Ocular Therapeutix | | Biotechnology | 4.20 | 10 | -9.58% | -5.83% |
| WVE | Wave Life | | Biotechnology | 4.74 | 51 | -5.39% | -6.14% |
| OMER | Omeros | | Biotechnology | 3.06 | 8 | 0.66% | -6.42% |
| AMGN | Amgen | | Biotechnology | 269.38 | 25 | -1.33% | -6.47% |
| INVA | Innoviva | | Biotechnology | 14.99 | 57 | -1.12% | -6.55% |
| RFL | Rafael | | Biotechnology | 1.71 | 40 | 0.00% | -6.56% |
| GLTO | Galecto | | Biotechnology | 0.67 | 33 | 3.21% | -6.81% |
| PRLD | Prelude | | Biotechnology | 4.05 | 63 | 3.58% | -6.90% |
| SGMO | Sangamo | | Biotechnology | 0.50 | 44 | 2.03% | -7.42% |
| PTCT | PTC | | Biotechnology | 25.49 | 28 | 1.11% | -7.51% |
| URGN | UroGen Pharma | | Biotechnology | 13.87 | 50 | -2.39% | -7.53% |
| RGEN | Repligen | | Biotechnology | 165.66 | 35 | -1.31% | -7.86% |
| ACLX | Arcellx | | Biotechnology | 51.38 | 25 | -3.55% | -7.93% |
| CERT | Certara | | Biotechnology | 16.16 | 33 | -1.70% | -8.21% |
| RARE | Ultragenyx | | Biotechnology | 43.85 | 50 | -0.97% | -8.30% |
| IGMS | IGM | | Biotechnology | 7.62 | 15 | -4.27% | -8.30% |
| MIST | Milestone | | Biotechnology | 1.53 | 54 | -7.83% | -8.38% |
| PHAR | Pharming | | Biotechnology | 10.47 | 7 | 9.06% | -8.40% |
| VRCA | Verrica | | Biotechnology | 6.66 | 49 | -1.91% | -9.02% |
| GNFT | Genfit SA | | Biotechnology | 3.49 | 0 | 0.00% | -9.35% |
| XNCR | Xencor | | Biotechnology | 19.23 | 17 | 1.10% | -9.42% |
| KALA | Kala | | Biotechnology | 6.32 | 20 | -1.25% | -9.71% |
| IPSC | Century | | Biotechnology | 2.98 | 15 | -0.17% | -9.85% |
| BHVN | Biohaven | | Biotechnology | 38.54 | 10 | -0.46% | -9.95% |
| To view more stocks, click on Next / Previous arrows or select different range: 0 - 25 , 25 - 50 , 50 - 75 , 75 - 100 , 100 - 125 , 125 - 150 , 150 - 175 , 175 - 200 , 200 - 225 , 225 - 250 , 250 - 275 , 275 - 300 , 300 - 325 , 325 - 350 , 350 - 375 , 375 - 400 | ||
 | Click To Change The Sort Order: By Market Cap or Company Size Performance: Year-to-date, Week and Day |  |
|
Get the most comprehensive stock market coverage daily at 12Stocks.com ➞ Best Stocks Today ➞ Best Stocks Weekly ➞ Best Stocks Year-to-Date ➞ Best Stocks Trends ➞  Best Stocks Today 12Stocks.com Best Nasdaq Stocks ➞ Best S&P 500 Stocks ➞ Best Tech Stocks ➞ Best Biotech Stocks ➞ |
| Detailed Overview of Biotech Stocks |
| Biotech Technical Overview, Leaders & Laggards, Top Biotech ETF Funds & Detailed Biotech Stocks List, Charts, Trends & More |
| Biotech Sector: Technical Analysis, Trends & YTD Performance | |
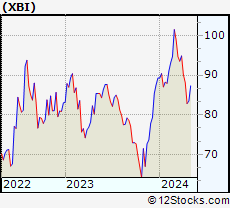
| Biotech sector, as represented by XBI, an exchange-traded fund [ETF] that holds basket of Biotech stocks (e.g, Amgen, Celgene) is down by -7.92% and is currently underperforming the overall market by -13.08% year-to-date. Below is a quick view of Technical charts and trends: | |
 XBI Weekly Chart |
|
| Long Term Trend: Not Good | |
| Medium Term Trend: Not Good | |
 XBI Daily Chart |
|
| Short Term Trend: Very Good | |
| Overall Trend Score: 25 | |
| YTD Performance: -7.92% | |
| **Trend Scores & Views Are Only For Educational Purposes And Not For Investing | |
| 12Stocks.com: Top Performing Biotech Sector Stocks | ||||||||||||||||||||||||||||||||||||||||||||||||
 The top performing Biotech sector stocks year to date are
Now, more recently, over last week, the top performing Biotech sector stocks on the move are


|
||||||||||||||||||||||||||||||||||||||||||||||||
| 12Stocks.com: Investing in Biotech Sector using Exchange Traded Funds | |
|
The following table shows list of key exchange traded funds (ETF) that
help investors track Biotech Index. For detailed view, check out our ETF Funds section of our website. Quick View: Move mouse or cursor over ETF symbol (ticker) to view short-term Technical chart and over ETF name to view long term chart. Click on ticker or stock name for detailed view. Click on to add stock symbol to your watchlist and to view watchlist. |
12Stocks.com List of ETFs that track Biotech Index
| Ticker | ETF Name | Watchlist | Recent Price | Market Intelligence Score | Change % | Week % | Year-to-date % |
| LABD | Biotech Bear 3X | | 11.03 | 75 | 6.36 | 2.13 | 13.83% |
| XBI | Biotech | | 82.22 | 25 | -2.05 | -0.74 | -7.92% |
| LABU | Biotech Bull 3X | | 83.72 | 25 | -6.35 | -2.71 | -31.36% |
| IBB | Biotechnology | | 125.67 | 18 | -1.64 | 0.76 | -7.49% |
| IYH | Healthcare | | 58.68 | 45 | -0.69 | 0.89 | 2.5% |
| IHF | Healthcare Providers | | 52.11 | 55 | -0.29 | -0.19 | -0.76% |
| IXJ | Global Healthcare | | 88.91 | 25 | -0.45 | 1.32 | 2.53% |
| BBH | Biotech | | 154.61 | 49 | -1.73 | 1.48 | -6.47% |
| FBT | First NYSE | | 142.59 | 25 | -1.93 | 0.64 | -9.78% |
| CURE | Healthcare Bull 3X | | 105.32 | 25 | -2.35 | 1.92 | 3.52% |
| BIB | Biotechnology | | 48.83 | 32 | -2.69 | 1.31 | -14.41% |
| BIS | Short Biotech | | 20.59 | 61 | 2.49 | -1.46 | 13.95% |
| PTH | DWA Healthcare Momentum | | 39.60 | 46 | -0.08 | 0.18 | 1.18% |
| PBE | Biotech & Genome | | 59.85 | 32 | -1.69 | 0 | -9.1% |
| BBC | Bio Biotechnology Clinical | | 24.70 | 36 | -3.62 | -0.04 | 1.01% |
| BTEC | Principal Healthcare Innovators | | 34.21 | 32 | 0.02 | 1.04 | -5.83% |
| BBP | Bio Biotechnology Products | | 51.14 | 35 | -2.40 | 1.41 | -11.96% |
| 12Stocks.com: Charts, Trends, Fundamental Data and Performances of Biotech Stocks | |
|
We now take in-depth look at all Biotech stocks including charts, multi-period performances and overall trends (as measured by market intelligence score). One can sort Biotech stocks (click link to choose) by Daily, Weekly and by Year-to-Date performances. Also, one can sort by size of the company or by market capitalization. |
| Select Your Default Chart Type: | |||||
| |||||
| Click on stock symbol or name for detailed view. Click on to add stock symbol to your watchlist and to view watchlist. Quick View: Move mouse or cursor over "Daily" to quickly view daily Technical stock chart and over "Weekly" to view weekly Technical stock chart. | |||||

 | CARA Cara Therapeutics, Inc. |
| Sector: Health Care | |
| SubSector: Biotechnology | |
| MarketCap: 597.985 Millions | |
| Recent Price: 0.70 Market Intelligence Score: 61 | |
| Day Percent Change: 4.23% Day Change: 0.03 | |
| Week Change: 5.9% Year-to-date Change: -5.8% | |
| CARA Links: Profile News Message Board | |
| Charts:- Daily , Weekly | |
| Add CARA to Watchlist: View: Get Complete CARA Trend Analysis ➞ | |
 | OCUL Ocular Therapeutix, Inc. |
| Sector: Health Care | |
| SubSector: Biotechnology | |
| MarketCap: 249.985 Millions | |
| Recent Price: 4.20 Market Intelligence Score: 10 | |
| Day Percent Change: -9.58% Day Change: -0.44 | |
| Week Change: -19.54% Year-to-date Change: -5.8% | |
| OCUL Links: Profile News Message Board | |
| Charts:- Daily , Weekly | |
| Add OCUL to Watchlist: View: Get Complete OCUL Trend Analysis ➞ | |
 | WVE Wave Life Sciences Ltd. |
| Sector: Health Care | |
| SubSector: Biotechnology | |
| MarketCap: 452.785 Millions | |
| Recent Price: 4.74 Market Intelligence Score: 51 | |
| Day Percent Change: -5.39% Day Change: -0.27 | |
| Week Change: -2.67% Year-to-date Change: -6.1% | |
| WVE Links: Profile News Message Board | |
| Charts:- Daily , Weekly | |
| Add WVE to Watchlist: View: Get Complete WVE Trend Analysis ➞ | |
 | OMER Omeros Corporation |
| Sector: Health Care | |
| SubSector: Biotechnology | |
| MarketCap: 759.585 Millions | |
| Recent Price: 3.06 Market Intelligence Score: 8 | |
| Day Percent Change: 0.66% Day Change: 0.02 | |
| Week Change: 0.33% Year-to-date Change: -6.4% | |
| OMER Links: Profile News Message Board | |
| Charts:- Daily , Weekly | |
| Add OMER to Watchlist: View: Get Complete OMER Trend Analysis ➞ | |
 | AMGN Amgen Inc. |
| Sector: Health Care | |
| SubSector: Biotechnology | |
| MarketCap: 121030 Millions | |
| Recent Price: 269.38 Market Intelligence Score: 25 | |
| Day Percent Change: -1.33% Day Change: -3.63 | |
| Week Change: 0.17% Year-to-date Change: -6.5% | |
| AMGN Links: Profile News Message Board | |
| Charts:- Daily , Weekly | |
| Add AMGN to Watchlist: View: Get Complete AMGN Trend Analysis ➞ | |
 | INVA Innoviva, Inc. |
| Sector: Health Care | |
| SubSector: Biotechnology | |
| MarketCap: 1023.15 Millions | |
| Recent Price: 14.99 Market Intelligence Score: 57 | |
| Day Percent Change: -1.12% Day Change: -0.17 | |
| Week Change: 0.27% Year-to-date Change: -6.6% | |
| INVA Links: Profile News Message Board | |
| Charts:- Daily , Weekly | |
| Add INVA to Watchlist: View: Get Complete INVA Trend Analysis ➞ | |
 | RFL Rafael Holdings, Inc. |
| Sector: Health Care | |
| SubSector: Biotechnology | |
| MarketCap: 203.685 Millions | |
| Recent Price: 1.71 Market Intelligence Score: 40 | |
| Day Percent Change: 0.00% Day Change: 0.00 | |
| Week Change: -2.84% Year-to-date Change: -6.6% | |
| RFL Links: Profile News Message Board | |
| Charts:- Daily , Weekly | |
| Add RFL to Watchlist: View: Get Complete RFL Trend Analysis ➞ | |
 | GLTO Galecto, Inc. |
| Sector: Health Care | |
| SubSector: Biotechnology | |
| MarketCap: 34487 Millions | |
| Recent Price: 0.67 Market Intelligence Score: 33 | |
| Day Percent Change: 3.21% Day Change: 0.02 | |
| Week Change: -6.81% Year-to-date Change: -6.8% | |
| GLTO Links: Profile News Message Board | |
| Charts:- Daily , Weekly | |
| Add GLTO to Watchlist: View: Get Complete GLTO Trend Analysis ➞ | |
 | PRLD Prelude Therapeutics Incorporated |
| Sector: Health Care | |
| SubSector: Biotechnology | |
| MarketCap: 26087 Millions | |
| Recent Price: 4.05 Market Intelligence Score: 63 | |
| Day Percent Change: 3.58% Day Change: 0.14 | |
| Week Change: 13.45% Year-to-date Change: -6.9% | |
| PRLD Links: Profile News Message Board | |
| Charts:- Daily , Weekly | |
| Add PRLD to Watchlist: View: Get Complete PRLD Trend Analysis ➞ | |
 | SGMO Sangamo Therapeutics, Inc. |
| Sector: Health Care | |
| SubSector: Biotechnology | |
| MarketCap: 779.285 Millions | |
| Recent Price: 0.50 Market Intelligence Score: 44 | |
| Day Percent Change: 2.03% Day Change: 0.01 | |
| Week Change: -1.66% Year-to-date Change: -7.4% | |
| SGMO Links: Profile News Message Board | |
| Charts:- Daily , Weekly | |
| Add SGMO to Watchlist: View: Get Complete SGMO Trend Analysis ➞ | |
 | PTCT PTC Therapeutics, Inc. |
| Sector: Health Care | |
| SubSector: Biotechnology | |
| MarketCap: 2795.85 Millions | |
| Recent Price: 25.49 Market Intelligence Score: 28 | |
| Day Percent Change: 1.11% Day Change: 0.28 | |
| Week Change: 0.67% Year-to-date Change: -7.5% | |
| PTCT Links: Profile News Message Board | |
| Charts:- Daily , Weekly | |
| Add PTCT to Watchlist: View: Get Complete PTCT Trend Analysis ➞ | |
 | URGN UroGen Pharma Ltd. |
| Sector: Health Care | |
| SubSector: Biotechnology | |
| MarketCap: 373.485 Millions | |
| Recent Price: 13.87 Market Intelligence Score: 50 | |
| Day Percent Change: -2.39% Day Change: -0.34 | |
| Week Change: 0.65% Year-to-date Change: -7.5% | |
| URGN Links: Profile News Message Board | |
| Charts:- Daily , Weekly | |
| Add URGN to Watchlist: View: Get Complete URGN Trend Analysis ➞ | |
 | RGEN Repligen Corporation |
| Sector: Health Care | |
| SubSector: Biotechnology | |
| MarketCap: 4711.75 Millions | |
| Recent Price: 165.66 Market Intelligence Score: 35 | |
| Day Percent Change: -1.31% Day Change: -2.20 | |
| Week Change: 5.42% Year-to-date Change: -7.9% | |
| RGEN Links: Profile News Message Board | |
| Charts:- Daily , Weekly | |
| Add RGEN to Watchlist: View: Get Complete RGEN Trend Analysis ➞ | |
 | ACLX Arcellx, Inc. |
| Sector: Health Care | |
| SubSector: Biotechnology | |
| MarketCap: 1530 Millions | |
| Recent Price: 51.38 Market Intelligence Score: 25 | |
| Day Percent Change: -3.55% Day Change: -1.89 | |
| Week Change: -0.52% Year-to-date Change: -7.9% | |
| ACLX Links: Profile News Message Board | |
| Charts:- Daily , Weekly | |
| Add ACLX to Watchlist: View: Get Complete ACLX Trend Analysis ➞ | |
 | CERT Certara, Inc. |
| Sector: Health Care | |
| SubSector: Biotechnology | |
| MarketCap: 21487 Millions | |
| Recent Price: 16.16 Market Intelligence Score: 33 | |
| Day Percent Change: -1.70% Day Change: -0.28 | |
| Week Change: 1.41% Year-to-date Change: -8.2% | |
| CERT Links: Profile News Message Board | |
| Charts:- Daily , Weekly | |
| Add CERT to Watchlist: View: Get Complete CERT Trend Analysis ➞ | |
 | RARE Ultragenyx Pharmaceutical Inc. |
| Sector: Health Care | |
| SubSector: Biotechnology | |
| MarketCap: 2373.35 Millions | |
| Recent Price: 43.85 Market Intelligence Score: 50 | |
| Day Percent Change: -0.97% Day Change: -0.43 | |
| Week Change: 3.49% Year-to-date Change: -8.3% | |
| RARE Links: Profile News Message Board | |
| Charts:- Daily , Weekly | |
| Add RARE to Watchlist: View: Get Complete RARE Trend Analysis ➞ | |
 | IGMS IGM Biosciences, Inc. |
| Sector: Health Care | |
| SubSector: Biotechnology | |
| MarketCap: 2000.05 Millions | |
| Recent Price: 7.62 Market Intelligence Score: 15 | |
| Day Percent Change: -4.27% Day Change: -0.34 | |
| Week Change: 5.83% Year-to-date Change: -8.3% | |
| IGMS Links: Profile News Message Board | |
| Charts:- Daily , Weekly | |
| Add IGMS to Watchlist: View: Get Complete IGMS Trend Analysis ➞ | |
 | MIST Milestone Pharmaceuticals Inc. |
| Sector: Health Care | |
| SubSector: Biotechnology | |
| MarketCap: 342.685 Millions | |
| Recent Price: 1.53 Market Intelligence Score: 54 | |
| Day Percent Change: -7.83% Day Change: -0.13 | |
| Week Change: -6.71% Year-to-date Change: -8.4% | |
| MIST Links: Profile News Message Board | |
| Charts:- Daily , Weekly | |
| Add MIST to Watchlist: View: Get Complete MIST Trend Analysis ➞ | |
 | PHAR Pharming Group N.V. |
| Sector: Health Care | |
| SubSector: Biotechnology | |
| MarketCap: 808 Millions | |
| Recent Price: 10.47 Market Intelligence Score: 7 | |
| Day Percent Change: 9.06% Day Change: 0.87 | |
| Week Change: 4.7% Year-to-date Change: -8.4% | |
| PHAR Links: Profile News Message Board | |
| Charts:- Daily , Weekly | |
| Add PHAR to Watchlist: View: Get Complete PHAR Trend Analysis ➞ | |
 | VRCA Verrica Pharmaceuticals Inc. |
| Sector: Health Care | |
| SubSector: Biotechnology | |
| MarketCap: 289.585 Millions | |
| Recent Price: 6.66 Market Intelligence Score: 49 | |
| Day Percent Change: -1.91% Day Change: -0.13 | |
| Week Change: -4.31% Year-to-date Change: -9.0% | |
| VRCA Links: Profile News Message Board | |
| Charts:- Daily , Weekly | |
| Add VRCA to Watchlist: View: Get Complete VRCA Trend Analysis ➞ | |
 | GNFT Genfit SA |
| Sector: Health Care | |
| SubSector: Biotechnology | |
| MarketCap: 529.285 Millions | |
| Recent Price: 3.49 Market Intelligence Score: 0 | |
| Day Percent Change: 0.00% Day Change: 0.00 | |
| Week Change: -2.79% Year-to-date Change: -9.4% | |
| GNFT Links: Profile News Message Board | |
| Charts:- Daily , Weekly | |
| Add GNFT to Watchlist: View: Get Complete GNFT Trend Analysis ➞ | |
 | XNCR Xencor, Inc. |
| Sector: Health Care | |
| SubSector: Biotechnology | |
| MarketCap: 1744.35 Millions | |
| Recent Price: 19.23 Market Intelligence Score: 17 | |
| Day Percent Change: 1.10% Day Change: 0.21 | |
| Week Change: 4.62% Year-to-date Change: -9.4% | |
| XNCR Links: Profile News Message Board | |
| Charts:- Daily , Weekly | |
| Add XNCR to Watchlist: View: Get Complete XNCR Trend Analysis ➞ | |
 | KALA Kala Pharmaceuticals, Inc. |
| Sector: Health Care | |
| SubSector: Biotechnology | |
| MarketCap: 276.485 Millions | |
| Recent Price: 6.32 Market Intelligence Score: 20 | |
| Day Percent Change: -1.25% Day Change: -0.08 | |
| Week Change: -7.2% Year-to-date Change: -9.7% | |
| KALA Links: Profile News Message Board | |
| Charts:- Daily , Weekly | |
| Add KALA to Watchlist: View: Get Complete KALA Trend Analysis ➞ | |
 | IPSC Century Therapeutics, Inc. |
| Sector: Health Care | |
| SubSector: Biotechnology | |
| MarketCap: 187 Millions | |
| Recent Price: 2.98 Market Intelligence Score: 15 | |
| Day Percent Change: -0.17% Day Change: 0.00 | |
| Week Change: -3.72% Year-to-date Change: -9.9% | |
| IPSC Links: Profile News Message Board | |
| Charts:- Daily , Weekly | |
| Add IPSC to Watchlist: View: Get Complete IPSC Trend Analysis ➞ | |
 | BHVN Biohaven Pharmaceutical Holding Company Ltd. |
| Sector: Health Care | |
| SubSector: Biotechnology | |
| MarketCap: 2024.25 Millions | |
| Recent Price: 38.54 Market Intelligence Score: 10 | |
| Day Percent Change: -0.46% Day Change: -0.18 | |
| Week Change: -1.15% Year-to-date Change: -10.0% | |
| BHVN Links: Profile News Message Board | |
| Charts:- Daily , Weekly | |
| Add BHVN to Watchlist: View: Get Complete BHVN Trend Analysis ➞ | |
| To view more stocks, click on Next / Previous arrows or select different range: 0 - 25 , 25 - 50 , 50 - 75 , 75 - 100 , 100 - 125 , 125 - 150 , 150 - 175 , 175 - 200 , 200 - 225 , 225 - 250 , 250 - 275 , 275 - 300 , 300 - 325 , 325 - 350 , 350 - 375 , 375 - 400 | ||
| Click To Change The Sort Order: By Market Cap or Company Size Performance: Year-to-date, Week and Day | |
| Select Chart Type: | ||
|
Best Stocks Today 12Stocks.com |
© 2024 12Stocks.com Terms & Conditions Privacy Contact Us
All Information Provided Only For Education And Not To Be Used For Investing or Trading. See Terms & Conditions


One More Thing ... Get Best Stocks Delivered Daily!
Never Ever Miss A Move With Our Top Ten Stocks Lists
Find Best Stocks In Any Market - Bull or Bear Market
Take A Peek At Our Top Ten Stocks Lists: Daily, Weekly, Year-to-Date & Top Trends
Find Best Stocks In Any Market - Bull or Bear Market
Take A Peek At Our Top Ten Stocks Lists: Daily, Weekly, Year-to-Date & Top Trends
Biotech Stocks With Best Up Trends [0-bearish to 100-bullish]: Annovis Bio[100], Agios [100], Agenus [95], Mesoblast [95], Cullinan Oncology[93], Avadel [93], Pieris [93], NewAmsterdam Pharma[93], PureTech Health[93], Exelixis [90], ALX Oncology[88]
Best Biotech Stocks Year-to-Date:
Pieris [6273.63%], Precision [2590.41%], Inovio [1885.29%], Assembly [1529.07%], NuCana [1198.17%], Adverum nologies[1147.34%], Agenus [902.54%], Affimed N.V[680.8%], Mesoblast [459.09%], Corbus [454.64%], Janux [338.34%] Best Biotech Stocks This Week:
Pieris [7900%], Agenus [56.31%], ProKidney [32.84%], Seres [32.65%], Annovis Bio[30%], BeyondSpring [26.11%], Cullinan Oncology[22.92%], Pharvaris N.V[18.84%], Mesoblast [18.04%], BeiGene [14.7%], Avid Bioservices[14.2%] Best Biotech Stocks Daily:
Galera [13.74%], Agenus [11.86%], ADiTx [10.57%], Apollomics [9.94%], Pharming [9.06%], Structure [8.13%], Pharvaris N.V[7.91%], ProKidney [7.75%], Avid Bioservices[7.17%], Merus N.V[7.05%], Zura Bio[6.75%]