
 Login Sign Up


| |||||
 |  | ||||

| 12Stocks.com Market Intelligence |
Best Biotech Stocks
|
|
| Quick Read: Best Biotech Stocks List By Performances & Trends: Daily, Weekly, Year-to-Date, Market Cap (Size) & Technical Trends | |||
| Best Biotech Stocks Views: Quick Browse View, Summary & Slide Show View | |||
| 12Stocks.com Biotech Stocks Performances & Trends Daily | |||||||||
|
|  The overall market intelligence score is 25 (0-bearish to 100-bullish) which puts Biotech sector in short term bearish to neutral trend. The market intelligence score from previous trading session is 32 and a deterioration of trend continues.
| ||||||||
Here are the market intelligence trend scores of the most requested Biotech stocks at 12Stocks.com (click stock name for detailed review):
|


| 12Stocks.com: Investing in Biotech sector with Stocks | |
|
The following table helps investors and traders sort through current performance and trends (as measured by market intelligence score) of various
stocks in the Biotech sector. Quick View: Move mouse or cursor over stock symbol (ticker) to view short-term Technical chart and over stock name to view long term chart. Click on  to add stock symbol to your watchlist and to add stock symbol to your watchlist and  to view watchlist. Click on any ticker or stock name for detailed market intelligence report for that stock. to view watchlist. Click on any ticker or stock name for detailed market intelligence report for that stock. |
12Stocks.com Performance of Stocks in Biotech Sector
| Ticker | Stock Name | Watchlist | Category | Recent Price | Market Intelligence Score | Change % | YTD Change% |
| HRTX | Heron |   | Biotechnology | 2.55 | 63 | -3.77% | 50.00% |
| MGNX | MacroGenics | | Biotechnology | 14.37 | 56 | -8.47% | 49.38% |
| XFOR | X4 | | Biotechnology | 1.23 | 56 | -4.65% | 46.69% |
| GRTX | Galera | | Biotechnology | 0.21 | 40 | 13.74% | 42.92% |
| ADMA | ADMA Biologics | | Biotechnology | 6.44 | 83 | -0.31% | 42.48% |
| SPRY | ARS | | Biotechnology | 8.09 | 46 | -2.41% | 42.30% |
| AGIO | Agios | | Biotechnology | 31.67 | 100 | 0.00% | 42.21% |
| IOVA | Iovance Bio | | Biotechnology | 11.55 | 41 | -1.37% | 42.07% |
| DSGN | Design | | Biotechnology | 3.76 | 43 | 2.87% | 41.62% |
| EWTX | Edgewise | | Biotechnology | 15.94 | 30 | 1.21% | 40.44% |
| HUMA | Humacyte | | Biotechnology | 3.90 | 76 | 2.09% | 37.32% |
| KROS | Keros | | Biotechnology | 54.63 | 36 | -2.67% | 37.14% |
| XOMA | XOMA | | Biotechnology | 25.36 | 76 | -1.09% | 37.08% |
| ATRA | Atara Bio | | Biotechnology | 0.70 | 66 | -2.08% | 36.47% |
| SMMT | Summit | | Biotechnology | 3.55 | 37 | -1.11% | 36.02% |
| IMNM | Immunome | | Biotechnology | 14.40 | 17 | 0.84% | 34.71% |
| STTK | Shattuck Labs | | Biotechnology | 9.56 | 81 | -3.14% | 34.65% |
| ADAP | Adaptimmune | | Biotechnology | 1.06 | 56 | -1.85% | 33.67% |
| TNYA | Tenaya | | Biotechnology | 4.22 | 56 | -4.09% | 32.70% |
| ENTA | Enanta | | Biotechnology | 12.48 | 46 | -3.41% | 32.62% |
| KURA | Kura Oncology | | Biotechnology | 19.00 | 30 | 1.33% | 32.13% |
| SRPT | Sarepta | | Biotechnology | 127.39 | 75 | 2.53% | 32.11% |
| ATAI | Atai Life | | Biotechnology | 1.84 | 36 | -1.60% | 30.50% |
| KYMR | Kymera | | Biotechnology | 33.08 | 56 | -5.97% | 30.18% |
| VCEL | Vericel | | Biotechnology | 45.45 | 56 | -1.43% | 27.63% |
| To view more stocks, click on Next / Previous arrows or select different range: 0 - 25 , 25 - 50 , 50 - 75 , 75 - 100 , 100 - 125 , 125 - 150 , 150 - 175 , 175 - 200 , 200 - 225 , 225 - 250 , 250 - 275 , 275 - 300 , 300 - 325 , 325 - 350 , 350 - 375 , 375 - 400 | ||
 | Click To Change The Sort Order: By Market Cap or Company Size Performance: Year-to-date, Week and Day |  |
|
Get the most comprehensive stock market coverage daily at 12Stocks.com ➞ Best Stocks Today ➞ Best Stocks Weekly ➞ Best Stocks Year-to-Date ➞ Best Stocks Trends ➞  Best Stocks Today 12Stocks.com Best Nasdaq Stocks ➞ Best S&P 500 Stocks ➞ Best Tech Stocks ➞ Best Biotech Stocks ➞ |
| Detailed Overview of Biotech Stocks |
| Biotech Technical Overview, Leaders & Laggards, Top Biotech ETF Funds & Detailed Biotech Stocks List, Charts, Trends & More |
| Biotech Sector: Technical Analysis, Trends & YTD Performance | |
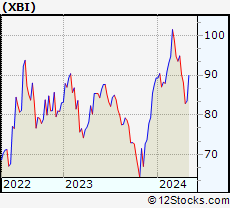
| Biotech sector, as represented by XBI, an exchange-traded fund [ETF] that holds basket of Biotech stocks (e.g, Amgen, Celgene) is down by -7.92% and is currently underperforming the overall market by -13.08% year-to-date. Below is a quick view of Technical charts and trends: | |
 XBI Weekly Chart |
|
| Long Term Trend: Not Good | |
| Medium Term Trend: Not Good | |
 XBI Daily Chart |
|
| Short Term Trend: Very Good | |
| Overall Trend Score: 25 | |
| YTD Performance: -7.92% | |
| **Trend Scores & Views Are Only For Educational Purposes And Not For Investing | |
| 12Stocks.com: Top Performing Biotech Sector Stocks | ||||||||||||||||||||||||||||||||||||||||||||||||
 The top performing Biotech sector stocks year to date are
Now, more recently, over last week, the top performing Biotech sector stocks on the move are


|
||||||||||||||||||||||||||||||||||||||||||||||||
| 12Stocks.com: Investing in Biotech Sector using Exchange Traded Funds | |
|
The following table shows list of key exchange traded funds (ETF) that
help investors track Biotech Index. For detailed view, check out our ETF Funds section of our website. Quick View: Move mouse or cursor over ETF symbol (ticker) to view short-term Technical chart and over ETF name to view long term chart. Click on ticker or stock name for detailed view. Click on to add stock symbol to your watchlist and to view watchlist. |
12Stocks.com List of ETFs that track Biotech Index
| Ticker | ETF Name | Watchlist | Recent Price | Market Intelligence Score | Change % | Week % | Year-to-date % |
| LABD | Biotech Bear 3X | | 11.03 | 75 | 6.36 | 2.13 | 13.83% |
| XBI | Biotech | | 82.22 | 25 | -2.05 | -0.74 | -7.92% |
| LABU | Biotech Bull 3X | | 83.72 | 25 | -6.35 | -2.71 | -31.36% |
| IBB | Biotechnology | | 125.67 | 18 | -1.64 | 0.76 | -7.49% |
| IYH | Healthcare | | 58.68 | 45 | -0.69 | 0.89 | 2.5% |
| IHF | Healthcare Providers | | 52.11 | 55 | -0.29 | -0.19 | -0.76% |
| IXJ | Global Healthcare | | 88.91 | 25 | -0.45 | 1.32 | 2.53% |
| BBH | Biotech | | 154.61 | 49 | -1.73 | 1.48 | -6.47% |
| FBT | First NYSE | | 142.59 | 25 | -1.93 | 0.64 | -9.78% |
| CURE | Healthcare Bull 3X | | 105.32 | 25 | -2.35 | 1.92 | 3.52% |
| BIB | Biotechnology | | 48.83 | 32 | -2.69 | 1.31 | -14.41% |
| BIS | Short Biotech | | 20.59 | 61 | 2.49 | -1.46 | 13.95% |
| PTH | DWA Healthcare Momentum | | 39.60 | 46 | -0.08 | 0.18 | 1.18% |
| PBE | Biotech & Genome | | 59.85 | 32 | -1.69 | 0 | -9.1% |
| BBC | Bio Biotechnology Clinical | | 24.70 | 36 | -3.62 | -0.04 | 1.01% |
| BTEC | Principal Healthcare Innovators | | 34.21 | 32 | 0.02 | 1.04 | -5.83% |
| BBP | Bio Biotechnology Products | | 51.14 | 35 | -2.40 | 1.41 | -11.96% |
| 12Stocks.com: Charts, Trends, Fundamental Data and Performances of Biotech Stocks | |
|
We now take in-depth look at all Biotech stocks including charts, multi-period performances and overall trends (as measured by market intelligence score). One can sort Biotech stocks (click link to choose) by Daily, Weekly and by Year-to-Date performances. Also, one can sort by size of the company or by market capitalization. |
| Select Your Default Chart Type: | |||||
| |||||
| Click on stock symbol or name for detailed view. Click on to add stock symbol to your watchlist and to view watchlist. Quick View: Move mouse or cursor over "Daily" to quickly view daily Technical stock chart and over "Weekly" to view weekly Technical stock chart. | |||||

 | HRTX Heron Therapeutics, Inc. |
| Sector: Health Care | |
| SubSector: Biotechnology | |
| MarketCap: 1172.75 Millions | |
| Recent Price: 2.55 Market Intelligence Score: 63 | |
| Day Percent Change: -3.77% Day Change: -0.10 | |
| Week Change: -3.41% Year-to-date Change: 50.0% | |
| HRTX Links: Profile News Message Board | |
| Charts:- Daily , Weekly | |
| Add HRTX to Watchlist: View: Get Complete HRTX Trend Analysis ➞ | |
 | MGNX MacroGenics, Inc. |
| Sector: Health Care | |
| SubSector: Biotechnology | |
| MarketCap: 262.785 Millions | |
| Recent Price: 14.37 Market Intelligence Score: 56 | |
| Day Percent Change: -8.47% Day Change: -1.33 | |
| Week Change: -7.94% Year-to-date Change: 49.4% | |
| MGNX Links: Profile News Message Board | |
| Charts:- Daily , Weekly | |
| Add MGNX to Watchlist: View: Get Complete MGNX Trend Analysis ➞ | |
 | XFOR X4 Pharmaceuticals, Inc. |
| Sector: Health Care | |
| SubSector: Biotechnology | |
| MarketCap: 143.385 Millions | |
| Recent Price: 1.23 Market Intelligence Score: 56 | |
| Day Percent Change: -4.65% Day Change: -0.06 | |
| Week Change: -1.99% Year-to-date Change: 46.7% | |
| XFOR Links: Profile News Message Board | |
| Charts:- Daily , Weekly | |
| Add XFOR to Watchlist: View: Get Complete XFOR Trend Analysis ➞ | |
 | GRTX Galera Therapeutics, Inc. |
| Sector: Health Care | |
| SubSector: Biotechnology | |
| MarketCap: 277.585 Millions | |
| Recent Price: 0.21 Market Intelligence Score: 40 | |
| Day Percent Change: 13.74% Day Change: 0.03 | |
| Week Change: 13.37% Year-to-date Change: 42.9% | |
| GRTX Links: Profile News Message Board | |
| Charts:- Daily , Weekly | |
| Add GRTX to Watchlist: View: Get Complete GRTX Trend Analysis ➞ | |
 | ADMA ADMA Biologics, Inc. |
| Sector: Health Care | |
| SubSector: Biotechnology | |
| MarketCap: 204.985 Millions | |
| Recent Price: 6.44 Market Intelligence Score: 83 | |
| Day Percent Change: -0.31% Day Change: -0.02 | |
| Week Change: 2.71% Year-to-date Change: 42.5% | |
| ADMA Links: Profile News Message Board | |
| Charts:- Daily , Weekly | |
| Add ADMA to Watchlist: View: Get Complete ADMA Trend Analysis ➞ | |
 | SPRY ARS Pharmaceuticals, Inc. |
| Sector: Health Care | |
| SubSector: Biotechnology | |
| MarketCap: 632 Millions | |
| Recent Price: 8.09 Market Intelligence Score: 46 | |
| Day Percent Change: -2.41% Day Change: -0.20 | |
| Week Change: -4.49% Year-to-date Change: 42.3% | |
| SPRY Links: Profile News Message Board | |
| Charts:- Daily , Weekly | |
| Add SPRY to Watchlist: View: Get Complete SPRY Trend Analysis ➞ | |
 | AGIO Agios Pharmaceuticals, Inc. |
| Sector: Health Care | |
| SubSector: Biotechnology | |
| MarketCap: 2613.35 Millions | |
| Recent Price: 31.67 Market Intelligence Score: 100 | |
| Day Percent Change: 0.00% Day Change: 0.00 | |
| Week Change: 7.25% Year-to-date Change: 42.2% | |
| AGIO Links: Profile News Message Board | |
| Charts:- Daily , Weekly | |
| Add AGIO to Watchlist: View: Get Complete AGIO Trend Analysis ➞ | |
 | IOVA Iovance Biotherapeutics, Inc. |
| Sector: Health Care | |
| SubSector: Biotechnology | |
| MarketCap: 3533.35 Millions | |
| Recent Price: 11.55 Market Intelligence Score: 41 | |
| Day Percent Change: -1.37% Day Change: -0.16 | |
| Week Change: 2.03% Year-to-date Change: 42.1% | |
| IOVA Links: Profile News Message Board | |
| Charts:- Daily , Weekly | |
| Add IOVA to Watchlist: View: Get Complete IOVA Trend Analysis ➞ | |
 | DSGN Design Therapeutics, Inc. |
| Sector: Health Care | |
| SubSector: Biotechnology | |
| MarketCap: 367 Millions | |
| Recent Price: 3.76 Market Intelligence Score: 43 | |
| Day Percent Change: 2.87% Day Change: 0.10 | |
| Week Change: 1.62% Year-to-date Change: 41.6% | |
| DSGN Links: Profile News Message Board | |
| Charts:- Daily , Weekly | |
| Add DSGN to Watchlist: View: Get Complete DSGN Trend Analysis ➞ | |
 | EWTX Edgewise Therapeutics, Inc. |
| Sector: Health Care | |
| SubSector: Biotechnology | |
| MarketCap: 492 Millions | |
| Recent Price: 15.94 Market Intelligence Score: 30 | |
| Day Percent Change: 1.21% Day Change: 0.19 | |
| Week Change: 4.66% Year-to-date Change: 40.4% | |
| EWTX Links: Profile News Message Board | |
| Charts:- Daily , Weekly | |
| Add EWTX to Watchlist: View: Get Complete EWTX Trend Analysis ➞ | |
 | HUMA Humacyte, Inc. |
| Sector: Health Care | |
| SubSector: Biotechnology | |
| MarketCap: 297 Millions | |
| Recent Price: 3.90 Market Intelligence Score: 76 | |
| Day Percent Change: 2.09% Day Change: 0.08 | |
| Week Change: 5.41% Year-to-date Change: 37.3% | |
| HUMA Links: Profile News Message Board | |
| Charts:- Daily , Weekly | |
| Add HUMA to Watchlist: View: Get Complete HUMA Trend Analysis ➞ | |
 | KROS Keros Therapeutics, Inc. |
| Sector: Health Care | |
| SubSector: Biotechnology | |
| MarketCap: 17887 Millions | |
| Recent Price: 54.63 Market Intelligence Score: 36 | |
| Day Percent Change: -2.67% Day Change: -1.50 | |
| Week Change: -6.7% Year-to-date Change: 37.1% | |
| KROS Links: Profile News Message Board | |
| Charts:- Daily , Weekly | |
| Add KROS to Watchlist: View: Get Complete KROS Trend Analysis ➞ | |
 | XOMA XOMA Corporation |
| Sector: Health Care | |
| SubSector: Biotechnology | |
| MarketCap: 174.885 Millions | |
| Recent Price: 25.36 Market Intelligence Score: 76 | |
| Day Percent Change: -1.09% Day Change: -0.28 | |
| Week Change: -0.47% Year-to-date Change: 37.1% | |
| XOMA Links: Profile News Message Board | |
| Charts:- Daily , Weekly | |
| Add XOMA to Watchlist: View: Get Complete XOMA Trend Analysis ➞ | |
 | ATRA Atara Biotherapeutics, Inc. |
| Sector: Health Care | |
| SubSector: Biotechnology | |
| MarketCap: 579.185 Millions | |
| Recent Price: 0.70 Market Intelligence Score: 66 | |
| Day Percent Change: -2.08% Day Change: -0.01 | |
| Week Change: 5.87% Year-to-date Change: 36.5% | |
| ATRA Links: Profile News Message Board | |
| Charts:- Daily , Weekly | |
| Add ATRA to Watchlist: View: Get Complete ATRA Trend Analysis ➞ | |
 | SMMT Summit Therapeutics plc |
| Sector: Health Care | |
| SubSector: Biotechnology | |
| MarketCap: 156.985 Millions | |
| Recent Price: 3.55 Market Intelligence Score: 37 | |
| Day Percent Change: -1.11% Day Change: -0.04 | |
| Week Change: 1.43% Year-to-date Change: 36.0% | |
| SMMT Links: Profile News Message Board | |
| Charts:- Daily , Weekly | |
| Add SMMT to Watchlist: View: Get Complete SMMT Trend Analysis ➞ | |
 | IMNM Immunome, Inc. |
| Sector: Health Care | |
| SubSector: Biotechnology | |
| MarketCap: 12487 Millions | |
| Recent Price: 14.40 Market Intelligence Score: 17 | |
| Day Percent Change: 0.84% Day Change: 0.12 | |
| Week Change: -13.72% Year-to-date Change: 34.7% | |
| IMNM Links: Profile News Message Board | |
| Charts:- Daily , Weekly | |
| Add IMNM to Watchlist: View: Get Complete IMNM Trend Analysis ➞ | |
 | STTK Shattuck Labs, Inc. |
| Sector: Health Care | |
| SubSector: Biotechnology | |
| MarketCap: 16987 Millions | |
| Recent Price: 9.56 Market Intelligence Score: 81 | |
| Day Percent Change: -3.14% Day Change: -0.31 | |
| Week Change: -2.35% Year-to-date Change: 34.7% | |
| STTK Links: Profile News Message Board | |
| Charts:- Daily , Weekly | |
| Add STTK to Watchlist: View: Get Complete STTK Trend Analysis ➞ | |
 | ADAP Adaptimmune Therapeutics plc |
| Sector: Health Care | |
| SubSector: Biotechnology | |
| MarketCap: 380.985 Millions | |
| Recent Price: 1.06 Market Intelligence Score: 56 | |
| Day Percent Change: -1.85% Day Change: -0.02 | |
| Week Change: 8.53% Year-to-date Change: 33.7% | |
| ADAP Links: Profile News Message Board | |
| Charts:- Daily , Weekly | |
| Add ADAP to Watchlist: View: Get Complete ADAP Trend Analysis ➞ | |
 | TNYA Tenaya Therapeutics, Inc. |
| Sector: Health Care | |
| SubSector: Biotechnology | |
| MarketCap: 395 Millions | |
| Recent Price: 4.22 Market Intelligence Score: 56 | |
| Day Percent Change: -4.09% Day Change: -0.18 | |
| Week Change: -2.31% Year-to-date Change: 32.7% | |
| TNYA Links: Profile News Message Board | |
| Charts:- Daily , Weekly | |
| Add TNYA to Watchlist: View: Get Complete TNYA Trend Analysis ➞ | |
 | ENTA Enanta Pharmaceuticals, Inc. |
| Sector: Health Care | |
| SubSector: Biotechnology | |
| MarketCap: 998.385 Millions | |
| Recent Price: 12.48 Market Intelligence Score: 46 | |
| Day Percent Change: -3.41% Day Change: -0.44 | |
| Week Change: -6.31% Year-to-date Change: 32.6% | |
| ENTA Links: Profile News Message Board | |
| Charts:- Daily , Weekly | |
| Add ENTA to Watchlist: View: Get Complete ENTA Trend Analysis ➞ | |
 | KURA Kura Oncology, Inc. |
| Sector: Health Care | |
| SubSector: Biotechnology | |
| MarketCap: 401.885 Millions | |
| Recent Price: 19.00 Market Intelligence Score: 30 | |
| Day Percent Change: 1.33% Day Change: 0.25 | |
| Week Change: 8.39% Year-to-date Change: 32.1% | |
| KURA Links: Profile News Message Board | |
| Charts:- Daily , Weekly | |
| Add KURA to Watchlist: View: Get Complete KURA Trend Analysis ➞ | |
 | SRPT Sarepta Therapeutics, Inc. |
| Sector: Health Care | |
| SubSector: Biotechnology | |
| MarketCap: 7388.05 Millions | |
| Recent Price: 127.39 Market Intelligence Score: 75 | |
| Day Percent Change: 2.53% Day Change: 3.14 | |
| Week Change: 10.18% Year-to-date Change: 32.1% | |
| SRPT Links: Profile News Message Board | |
| Charts:- Daily , Weekly | |
| Add SRPT to Watchlist: View: Get Complete SRPT Trend Analysis ➞ | |
 | ATAI Atai Life Sciences N.V. |
| Sector: Health Care | |
| SubSector: Biotechnology | |
| MarketCap: 287 Millions | |
| Recent Price: 1.84 Market Intelligence Score: 36 | |
| Day Percent Change: -1.60% Day Change: -0.03 | |
| Week Change: -0.54% Year-to-date Change: 30.5% | |
| ATAI Links: Profile News Message Board | |
| Charts:- Daily , Weekly | |
| Add ATAI to Watchlist: View: Get Complete ATAI Trend Analysis ➞ | |
 | KYMR Kymera Therapeutics, Inc. |
| Sector: Health Care | |
| SubSector: Biotechnology | |
| MarketCap: 27087 Millions | |
| Recent Price: 33.08 Market Intelligence Score: 56 | |
| Day Percent Change: -5.97% Day Change: -2.10 | |
| Week Change: -4.5% Year-to-date Change: 30.2% | |
| KYMR Links: Profile News Message Board | |
| Charts:- Daily , Weekly | |
| Add KYMR to Watchlist: View: Get Complete KYMR Trend Analysis ➞ | |
 | VCEL Vericel Corporation |
| Sector: Health Care | |
| SubSector: Biotechnology | |
| MarketCap: 391.885 Millions | |
| Recent Price: 45.45 Market Intelligence Score: 56 | |
| Day Percent Change: -1.43% Day Change: -0.66 | |
| Week Change: 3.91% Year-to-date Change: 27.6% | |
| VCEL Links: Profile News Message Board | |
| Charts:- Daily , Weekly | |
| Add VCEL to Watchlist: View: Get Complete VCEL Trend Analysis ➞ | |
| To view more stocks, click on Next / Previous arrows or select different range: 0 - 25 , 25 - 50 , 50 - 75 , 75 - 100 , 100 - 125 , 125 - 150 , 150 - 175 , 175 - 200 , 200 - 225 , 225 - 250 , 250 - 275 , 275 - 300 , 300 - 325 , 325 - 350 , 350 - 375 , 375 - 400 | ||
| Click To Change The Sort Order: By Market Cap or Company Size Performance: Year-to-date, Week and Day | |
| Select Chart Type: | ||
|
Best Stocks Today 12Stocks.com |
© 2024 12Stocks.com Terms & Conditions Privacy Contact Us
All Information Provided Only For Education And Not To Be Used For Investing or Trading. See Terms & Conditions


One More Thing ... Get Best Stocks Delivered Daily!
Never Ever Miss A Move With Our Top Ten Stocks Lists
Find Best Stocks In Any Market - Bull or Bear Market
Take A Peek At Our Top Ten Stocks Lists: Daily, Weekly, Year-to-Date & Top Trends
Find Best Stocks In Any Market - Bull or Bear Market
Take A Peek At Our Top Ten Stocks Lists: Daily, Weekly, Year-to-Date & Top Trends
Biotech Stocks With Best Up Trends [0-bearish to 100-bullish]: Annovis Bio[100], Agios [100], Agenus [95], Mesoblast [95], Cullinan Oncology[93], Avadel [93], Pieris [93], NewAmsterdam Pharma[93], PureTech Health[93], Exelixis [90], ALX Oncology[88]
Best Biotech Stocks Year-to-Date:
Pieris [6273.63%], Precision [2590.41%], Inovio [1885.29%], Assembly [1529.07%], NuCana [1198.17%], Adverum nologies[1147.34%], Agenus [902.54%], Affimed N.V[680.8%], Mesoblast [459.09%], Corbus [454.64%], Janux [338.34%] Best Biotech Stocks This Week:
Pieris [7900%], Agenus [56.31%], ProKidney [32.84%], Seres [32.65%], Annovis Bio[30%], BeyondSpring [26.11%], Cullinan Oncology[22.92%], Pharvaris N.V[18.84%], Mesoblast [18.04%], BeiGene [14.7%], Avid Bioservices[14.2%] Best Biotech Stocks Daily:
Galera [13.74%], Agenus [11.86%], ADiTx [10.57%], Apollomics [9.94%], Pharming [9.06%], Structure [8.13%], Pharvaris N.V[7.91%], ProKidney [7.75%], Avid Bioservices[7.17%], Merus N.V[7.05%], Zura Bio[6.75%]