
 Login Sign Up


| |||||
 |  | ||||

| 12Stocks.com Market Intelligence |
Best Biotech Stocks
|
|
| Quick Read: Best Biotech Stocks List By Performances & Trends: Daily, Weekly, Year-to-Date, Market Cap (Size) & Technical Trends | |||
| Best Biotech Stocks Views: Quick Browse View, Summary & Slide Show View | |||
| 12Stocks.com Biotech Stocks Performances & Trends Daily | |||||||||
|
|  The overall market intelligence score is 25 (0-bearish to 100-bullish) which puts Biotech sector in short term bearish to neutral trend. The market intelligence score from previous trading session is 32 and hence a deterioration of trend.
| ||||||||
Here are the market intelligence trend scores of the most requested Biotech stocks at 12Stocks.com (click stock name for detailed review):
|


| 12Stocks.com: Investing in Biotech sector with Stocks | |
|
The following table helps investors and traders sort through current performance and trends (as measured by market intelligence score) of various
stocks in the Biotech sector. Quick View: Move mouse or cursor over stock symbol (ticker) to view short-term Technical chart and over stock name to view long term chart. Click on  to add stock symbol to your watchlist and to add stock symbol to your watchlist and  to view watchlist. Click on any ticker or stock name for detailed market intelligence report for that stock. to view watchlist. Click on any ticker or stock name for detailed market intelligence report for that stock. |
12Stocks.com Performance of Stocks in Biotech Sector
| Ticker | Stock Name | Watchlist | Category | Recent Price | Market Intelligence Score | Change % | YTD Change% |
| EBS | Emergent Bio |   | Biotechnology | 2.18 | 75 | -4.80% | -9.17% |
| SGMO | Sangamo | | Biotechnology | 0.49 | 44 | -5.36% | -9.26% |
| GNFT | Genfit SA | | Biotechnology | 3.49 | 0 | 1.45% | -9.35% |
| DCPH | Deciphera | | Biotechnology | 14.62 | 48 | -0.34% | -9.36% |
| BHVN | Biohaven | | Biotechnology | 38.72 | 10 | -2.25% | -9.53% |
| INBX | Inhibrx | | Biotechnology | 34.38 | 7 | 0.75% | -9.54% |
| HRMY | Harmony | | Biotechnology | 29.20 | 28 | 1.23% | -9.55% |
| CARA | Cara | | Biotechnology | 0.67 | 61 | -5.02% | -9.61% |
| MNOV | MediciNova | | Biotechnology | 1.36 | 20 | 1.88% | -9.67% |
| IPSC | Century | | Biotechnology | 2.98 | 15 | -4.79% | -9.70% |
| GLTO | Galecto | | Biotechnology | 0.65 | 31 | -7.21% | -9.71% |
| ANAB | AnaptysBio | | Biotechnology | 19.27 | 0 | 0.47% | -10.04% |
| CPRX | Catalyst | | Biotechnology | 15.12 | 33 | 0.47% | -10.05% |
| PRLD | Prelude | | Biotechnology | 3.91 | 63 | 1.03% | -10.11% |
| VYGR | Voyager | | Biotechnology | 7.57 | 51 | -1.05% | -10.31% |
| XNCR | Xencor | | Biotechnology | 19.02 | 17 | 3.54% | -10.41% |
| AXSM | Axsome | | Biotechnology | 71.17 | 57 | -2.61% | -10.58% |
| GMAB | Genmab A/S | | Biotechnology | 28.47 | 46 | -0.32% | -10.58% |
| RGNX | REGENXBIO | | Biotechnology | 16.04 | 43 | 0.88% | -10.64% |
| CRSP | CRISPR | | Biotechnology | 55.65 | 32 | -1.35% | -11.10% |
| ALKS | Alkermes | | Biotechnology | 24.65 | 49 | 1.61% | -11.14% |
| XCUR | Exicure | | Biotechnology | 0.52 | 10 | -4.68% | -11.25% |
| MDGL | Madrigal | | Biotechnology | 204.65 | 23 | -6.29% | -11.55% |
| ERAS | Erasca | | Biotechnology | 1.88 | 61 | -2.59% | -11.74% |
| ILMN | Illumina | | Biotechnology | 122.87 | 42 | -1.28% | -11.76% |
| To view more stocks, click on Next / Previous arrows or select different range: 0 - 25 , 25 - 50 , 50 - 75 , 75 - 100 , 100 - 125 , 125 - 150 , 150 - 175 , 175 - 200 , 200 - 225 , 225 - 250 , 250 - 275 , 275 - 300 , 300 - 325 , 325 - 350 , 350 - 375 , 375 - 400 | ||
 | Click To Change The Sort Order: By Market Cap or Company Size Performance: Year-to-date, Week and Day |  |
|
Get the most comprehensive stock market coverage daily at 12Stocks.com ➞ Best Stocks Today ➞ Best Stocks Weekly ➞ Best Stocks Year-to-Date ➞ Best Stocks Trends ➞  Best Stocks Today 12Stocks.com Best Nasdaq Stocks ➞ Best S&P 500 Stocks ➞ Best Tech Stocks ➞ Best Biotech Stocks ➞ |
| Detailed Overview of Biotech Stocks |
| Biotech Technical Overview, Leaders & Laggards, Top Biotech ETF Funds & Detailed Biotech Stocks List, Charts, Trends & More |
| Biotech Sector: Technical Analysis, Trends & YTD Performance | |
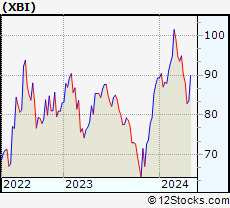
| Biotech sector, as represented by XBI, an exchange-traded fund [ETF] that holds basket of Biotech stocks (e.g, Amgen, Celgene) is down by -5.99% and is currently underperforming the overall market by -11.65% year-to-date. Below is a quick view of Technical charts and trends: | |
 XBI Weekly Chart |
|
| Long Term Trend: Not Good | |
| Medium Term Trend: Not Good | |
 XBI Daily Chart |
|
| Short Term Trend: Very Good | |
| Overall Trend Score: 25 | |
| YTD Performance: -5.99% | |
| **Trend Scores & Views Are Only For Educational Purposes And Not For Investing | |
| 12Stocks.com: Top Performing Biotech Sector Stocks | ||||||||||||||||||||||||||||||||||||||||||||||||
 The top performing Biotech sector stocks year to date are
Now, more recently, over last week, the top performing Biotech sector stocks on the move are


|
||||||||||||||||||||||||||||||||||||||||||||||||
| 12Stocks.com: Investing in Biotech Sector using Exchange Traded Funds | |
|
The following table shows list of key exchange traded funds (ETF) that
help investors track Biotech Index. For detailed view, check out our ETF Funds section of our website. Quick View: Move mouse or cursor over ETF symbol (ticker) to view short-term Technical chart and over ETF name to view long term chart. Click on ticker or stock name for detailed view. Click on to add stock symbol to your watchlist and to view watchlist. |
12Stocks.com List of ETFs that track Biotech Index
| Ticker | ETF Name | Watchlist | Recent Price | Market Intelligence Score | Change % | Week % | Year-to-date % |
| LABD | Biotech Bear 3X | | 10.37 | 62 | 2.98 | -3.98 | 7.02% |
| XBI | Biotech | | 83.94 | 25 | -0.89 | 1.34 | -5.99% |
| LABU | Biotech Bull 3X | | 89.40 | 25 | -2.80 | 3.89 | -26.7% |
| IBB | Biotechnology | | 127.76 | 32 | -0.20 | 2.44 | -5.96% |
| IYH | Healthcare | | 59.09 | 30 | -0.20 | 1.6 | 3.22% |
| IXJ | Global Healthcare | | 89.31 | 45 | -0.35 | 1.78 | 2.99% |
| IHF | Healthcare Providers | | 52.26 | 48 | -0.11 | 0.1 | -0.48% |
| CURE | Healthcare Bull 3X | | 107.85 | 32 | -0.25 | 4.37 | 6.01% |
| FBT | First NYSE | | 145.40 | 18 | 0.05 | 2.62 | -8.01% |
| BIB | Biotechnology | | 50.18 | 32 | -0.30 | 4.11 | -12.04% |
| BIS | Short Biotech | | 20.09 | 61 | 0.75 | -3.85 | 11.18% |
| BBH | Biotech | | 157.33 | 49 | 0.03 | 3.26 | -4.83% |
| PBE | Biotech & Genome | | 60.88 | 17 | -0.43 | 1.72 | -7.53% |
| PTH | DWA Healthcare Momentum | | 39.63 | 46 | -1.34 | 0.25 | 1.25% |
| BTEC | Principal Healthcare Innovators | | 34.20 | 18 | -1.73 | 1.02 | -5.85% |
| BBP | Bio Biotechnology Products | | 52.40 | 20 | 0.02 | 3.91 | -9.8% |
| BBC | Bio Biotechnology Clinical | | 25.63 | 36 | -0.17 | 3.71 | 4.81% |
| 12Stocks.com: Charts, Trends, Fundamental Data and Performances of Biotech Stocks | |
|
We now take in-depth look at all Biotech stocks including charts, multi-period performances and overall trends (as measured by market intelligence score). One can sort Biotech stocks (click link to choose) by Daily, Weekly and by Year-to-Date performances. Also, one can sort by size of the company or by market capitalization. |
| Select Your Default Chart Type: | |||||
| |||||
| Click on stock symbol or name for detailed view. Click on to add stock symbol to your watchlist and to view watchlist. Quick View: Move mouse or cursor over "Daily" to quickly view daily Technical stock chart and over "Weekly" to view weekly Technical stock chart. | |||||

 | EBS Emergent BioSolutions Inc. |
| Sector: Health Care | |
| SubSector: Biotechnology | |
| MarketCap: 2417.65 Millions | |
| Recent Price: 2.18 Market Intelligence Score: 75 | |
| Day Percent Change: -4.80% Day Change: -0.11 | |
| Week Change: 6.86% Year-to-date Change: -9.2% | |
| EBS Links: Profile News Message Board | |
| Charts:- Daily , Weekly | |
| Add EBS to Watchlist: View: Get Complete EBS Trend Analysis ➞ | |
 | SGMO Sangamo Therapeutics, Inc. |
| Sector: Health Care | |
| SubSector: Biotechnology | |
| MarketCap: 779.285 Millions | |
| Recent Price: 0.49 Market Intelligence Score: 44 | |
| Day Percent Change: -5.36% Day Change: -0.03 | |
| Week Change: -3.62% Year-to-date Change: -9.3% | |
| SGMO Links: Profile News Message Board | |
| Charts:- Daily , Weekly | |
| Add SGMO to Watchlist: View: Get Complete SGMO Trend Analysis ➞ | |
 | GNFT Genfit SA |
| Sector: Health Care | |
| SubSector: Biotechnology | |
| MarketCap: 529.285 Millions | |
| Recent Price: 3.49 Market Intelligence Score: 0 | |
| Day Percent Change: 1.45% Day Change: 0.05 | |
| Week Change: -2.79% Year-to-date Change: -9.4% | |
| GNFT Links: Profile News Message Board | |
| Charts:- Daily , Weekly | |
| Add GNFT to Watchlist: View: Get Complete GNFT Trend Analysis ➞ | |
 | DCPH Deciphera Pharmaceuticals, Inc. |
| Sector: Health Care | |
| SubSector: Biotechnology | |
| MarketCap: 2329.95 Millions | |
| Recent Price: 14.62 Market Intelligence Score: 48 | |
| Day Percent Change: -0.34% Day Change: -0.05 | |
| Week Change: -0.48% Year-to-date Change: -9.4% | |
| DCPH Links: Profile News Message Board | |
| Charts:- Daily , Weekly | |
| Add DCPH to Watchlist: View: Get Complete DCPH Trend Analysis ➞ | |
 | BHVN Biohaven Pharmaceutical Holding Company Ltd. |
| Sector: Health Care | |
| SubSector: Biotechnology | |
| MarketCap: 2024.25 Millions | |
| Recent Price: 38.72 Market Intelligence Score: 10 | |
| Day Percent Change: -2.25% Day Change: -0.89 | |
| Week Change: -0.69% Year-to-date Change: -9.5% | |
| BHVN Links: Profile News Message Board | |
| Charts:- Daily , Weekly | |
| Add BHVN to Watchlist: View: Get Complete BHVN Trend Analysis ➞ | |
 | INBX Inhibrx, Inc. |
| Sector: Health Care | |
| SubSector: Biotechnology | |
| MarketCap: 14187 Millions | |
| Recent Price: 34.38 Market Intelligence Score: 7 | |
| Day Percent Change: 0.75% Day Change: 0.25 | |
| Week Change: -0.22% Year-to-date Change: -9.5% | |
| INBX Links: Profile News Message Board | |
| Charts:- Daily , Weekly | |
| Add INBX to Watchlist: View: Get Complete INBX Trend Analysis ➞ | |
 | HRMY Harmony Biosciences Holdings, Inc. |
| Sector: Health Care | |
| SubSector: Biotechnology | |
| MarketCap: 24487 Millions | |
| Recent Price: 29.20 Market Intelligence Score: 28 | |
| Day Percent Change: 1.23% Day Change: 0.35 | |
| Week Change: 0.26% Year-to-date Change: -9.6% | |
| HRMY Links: Profile News Message Board | |
| Charts:- Daily , Weekly | |
| Add HRMY to Watchlist: View: Get Complete HRMY Trend Analysis ➞ | |
 | CARA Cara Therapeutics, Inc. |
| Sector: Health Care | |
| SubSector: Biotechnology | |
| MarketCap: 597.985 Millions | |
| Recent Price: 0.67 Market Intelligence Score: 61 | |
| Day Percent Change: -5.02% Day Change: -0.04 | |
| Week Change: 1.6% Year-to-date Change: -9.6% | |
| CARA Links: Profile News Message Board | |
| Charts:- Daily , Weekly | |
| Add CARA to Watchlist: View: Get Complete CARA Trend Analysis ➞ | |
 | MNOV MediciNova, Inc. |
| Sector: Health Care | |
| SubSector: Biotechnology | |
| MarketCap: 137.685 Millions | |
| Recent Price: 1.36 Market Intelligence Score: 20 | |
| Day Percent Change: 1.88% Day Change: 0.02 | |
| Week Change: -2.52% Year-to-date Change: -9.7% | |
| MNOV Links: Profile News Message Board | |
| Charts:- Daily , Weekly | |
| Add MNOV to Watchlist: View: Get Complete MNOV Trend Analysis ➞ | |
 | IPSC Century Therapeutics, Inc. |
| Sector: Health Care | |
| SubSector: Biotechnology | |
| MarketCap: 187 Millions | |
| Recent Price: 2.98 Market Intelligence Score: 15 | |
| Day Percent Change: -4.79% Day Change: -0.15 | |
| Week Change: -3.56% Year-to-date Change: -9.7% | |
| IPSC Links: Profile News Message Board | |
| Charts:- Daily , Weekly | |
| Add IPSC to Watchlist: View: Get Complete IPSC Trend Analysis ➞ | |
 | GLTO Galecto, Inc. |
| Sector: Health Care | |
| SubSector: Biotechnology | |
| MarketCap: 34487 Millions | |
| Recent Price: 0.65 Market Intelligence Score: 31 | |
| Day Percent Change: -7.21% Day Change: -0.05 | |
| Week Change: -9.71% Year-to-date Change: -9.7% | |
| GLTO Links: Profile News Message Board | |
| Charts:- Daily , Weekly | |
| Add GLTO to Watchlist: View: Get Complete GLTO Trend Analysis ➞ | |
 | ANAB AnaptysBio, Inc. |
| Sector: Health Care | |
| SubSector: Biotechnology | |
| MarketCap: 405.985 Millions | |
| Recent Price: 19.27 Market Intelligence Score: 0 | |
| Day Percent Change: 0.47% Day Change: 0.09 | |
| Week Change: -3.02% Year-to-date Change: -10.0% | |
| ANAB Links: Profile News Message Board | |
| Charts:- Daily , Weekly | |
| Add ANAB to Watchlist: View: Get Complete ANAB Trend Analysis ➞ | |
 | CPRX Catalyst Pharmaceuticals, Inc. |
| Sector: Health Care | |
| SubSector: Biotechnology | |
| MarketCap: 365.185 Millions | |
| Recent Price: 15.12 Market Intelligence Score: 33 | |
| Day Percent Change: 0.47% Day Change: 0.07 | |
| Week Change: -0.07% Year-to-date Change: -10.1% | |
| CPRX Links: Profile News Message Board | |
| Charts:- Daily , Weekly | |
| Add CPRX to Watchlist: View: Get Complete CPRX Trend Analysis ➞ | |
 | PRLD Prelude Therapeutics Incorporated |
| Sector: Health Care | |
| SubSector: Biotechnology | |
| MarketCap: 26087 Millions | |
| Recent Price: 3.91 Market Intelligence Score: 63 | |
| Day Percent Change: 1.03% Day Change: 0.04 | |
| Week Change: 9.52% Year-to-date Change: -10.1% | |
| PRLD Links: Profile News Message Board | |
| Charts:- Daily , Weekly | |
| Add PRLD to Watchlist: View: Get Complete PRLD Trend Analysis ➞ | |
 | VYGR Voyager Therapeutics, Inc. |
| Sector: Health Care | |
| SubSector: Biotechnology | |
| MarketCap: 321.085 Millions | |
| Recent Price: 7.57 Market Intelligence Score: 51 | |
| Day Percent Change: -1.05% Day Change: -0.08 | |
| Week Change: 0.93% Year-to-date Change: -10.3% | |
| VYGR Links: Profile News Message Board | |
| Charts:- Daily , Weekly | |
| Add VYGR to Watchlist: View: Get Complete VYGR Trend Analysis ➞ | |
 | XNCR Xencor, Inc. |
| Sector: Health Care | |
| SubSector: Biotechnology | |
| MarketCap: 1744.35 Millions | |
| Recent Price: 19.02 Market Intelligence Score: 17 | |
| Day Percent Change: 3.54% Day Change: 0.65 | |
| Week Change: 3.48% Year-to-date Change: -10.4% | |
| XNCR Links: Profile News Message Board | |
| Charts:- Daily , Weekly | |
| Add XNCR to Watchlist: View: Get Complete XNCR Trend Analysis ➞ | |
 | AXSM Axsome Therapeutics, Inc. |
| Sector: Health Care | |
| SubSector: Biotechnology | |
| MarketCap: 2284.25 Millions | |
| Recent Price: 71.17 Market Intelligence Score: 57 | |
| Day Percent Change: -2.61% Day Change: -1.91 | |
| Week Change: 4.82% Year-to-date Change: -10.6% | |
| AXSM Links: Profile News Message Board | |
| Charts:- Daily , Weekly | |
| Add AXSM to Watchlist: View: Get Complete AXSM Trend Analysis ➞ | |
 | GMAB Genmab A/S |
| Sector: Health Care | |
| SubSector: Biotechnology | |
| MarketCap: 12482.3 Millions | |
| Recent Price: 28.47 Market Intelligence Score: 46 | |
| Day Percent Change: -0.32% Day Change: -0.09 | |
| Week Change: -0.87% Year-to-date Change: -10.6% | |
| GMAB Links: Profile News Message Board | |
| Charts:- Daily , Weekly | |
| Add GMAB to Watchlist: View: Get Complete GMAB Trend Analysis ➞ | |
 | RGNX REGENXBIO Inc. |
| Sector: Health Care | |
| SubSector: Biotechnology | |
| MarketCap: 1232.85 Millions | |
| Recent Price: 16.04 Market Intelligence Score: 43 | |
| Day Percent Change: 0.88% Day Change: 0.14 | |
| Week Change: 2.23% Year-to-date Change: -10.6% | |
| RGNX Links: Profile News Message Board | |
| Charts:- Daily , Weekly | |
| Add RGNX to Watchlist: View: Get Complete RGNX Trend Analysis ➞ | |
 | CRSP CRISPR Therapeutics AG |
| Sector: Health Care | |
| SubSector: Biotechnology | |
| MarketCap: 2691.35 Millions | |
| Recent Price: 55.65 Market Intelligence Score: 32 | |
| Day Percent Change: -1.35% Day Change: -0.76 | |
| Week Change: 1.09% Year-to-date Change: -11.1% | |
| CRSP Links: Profile News Message Board | |
| Charts:- Daily , Weekly | |
| Add CRSP to Watchlist: View: Get Complete CRSP Trend Analysis ➞ | |
 | ALKS Alkermes plc |
| Sector: Health Care | |
| SubSector: Biotechnology | |
| MarketCap: 2311.95 Millions | |
| Recent Price: 24.65 Market Intelligence Score: 49 | |
| Day Percent Change: 1.61% Day Change: 0.39 | |
| Week Change: 3.35% Year-to-date Change: -11.1% | |
| ALKS Links: Profile News Message Board | |
| Charts:- Daily , Weekly | |
| Add ALKS to Watchlist: View: Get Complete ALKS Trend Analysis ➞ | |
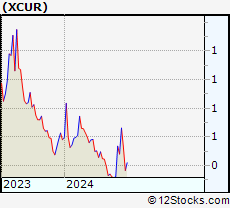 | XCUR Exicure, Inc. |
| Sector: Health Care | |
| SubSector: Biotechnology | |
| MarketCap: 113.785 Millions | |
| Recent Price: 0.52 Market Intelligence Score: 10 | |
| Day Percent Change: -4.68% Day Change: -0.03 | |
| Week Change: -11.59% Year-to-date Change: -11.3% | |
| XCUR Links: Profile News Message Board | |
| Charts:- Daily , Weekly | |
| Add XCUR to Watchlist: View: Get Complete XCUR Trend Analysis ➞ | |
 | MDGL Madrigal Pharmaceuticals, Inc. |
| Sector: Health Care | |
| SubSector: Biotechnology | |
| MarketCap: 1104.35 Millions | |
| Recent Price: 204.65 Market Intelligence Score: 23 | |
| Day Percent Change: -6.29% Day Change: -13.73 | |
| Week Change: -3.62% Year-to-date Change: -11.6% | |
| MDGL Links: Profile News Message Board | |
| Charts:- Daily , Weekly | |
| Add MDGL to Watchlist: View: Get Complete MDGL Trend Analysis ➞ | |
 | ERAS Erasca, Inc. |
| Sector: Health Care | |
| SubSector: Biotechnology | |
| MarketCap: 419 Millions | |
| Recent Price: 1.88 Market Intelligence Score: 61 | |
| Day Percent Change: -2.59% Day Change: -0.05 | |
| Week Change: 5.03% Year-to-date Change: -11.7% | |
| ERAS Links: Profile News Message Board | |
| Charts:- Daily , Weekly | |
| Add ERAS to Watchlist: View: Get Complete ERAS Trend Analysis ➞ | |
 | ILMN Illumina, Inc. |
| Sector: Health Care | |
| SubSector: Biotechnology | |
| MarketCap: 39194.3 Millions | |
| Recent Price: 122.87 Market Intelligence Score: 42 | |
| Day Percent Change: -1.28% Day Change: -1.59 | |
| Week Change: 4.63% Year-to-date Change: -11.8% | |
| ILMN Links: Profile News Message Board | |
| Charts:- Daily , Weekly | |
| Add ILMN to Watchlist: View: Get Complete ILMN Trend Analysis ➞ | |
| To view more stocks, click on Next / Previous arrows or select different range: 0 - 25 , 25 - 50 , 50 - 75 , 75 - 100 , 100 - 125 , 125 - 150 , 150 - 175 , 175 - 200 , 200 - 225 , 225 - 250 , 250 - 275 , 275 - 300 , 300 - 325 , 325 - 350 , 350 - 375 , 375 - 400 | ||
| Click To Change The Sort Order: By Market Cap or Company Size Performance: Year-to-date, Week and Day | |
| Select Chart Type: | ||
|
Best Stocks Today 12Stocks.com |
© 2024 12Stocks.com Terms & Conditions Privacy Contact Us
All Information Provided Only For Education And Not To Be Used For Investing or Trading. See Terms & Conditions


One More Thing ... Get Best Stocks Delivered Daily!
Never Ever Miss A Move With Our Top Ten Stocks Lists
Find Best Stocks In Any Market - Bull or Bear Market
Take A Peek At Our Top Ten Stocks Lists: Daily, Weekly, Year-to-Date & Top Trends
Find Best Stocks In Any Market - Bull or Bear Market
Take A Peek At Our Top Ten Stocks Lists: Daily, Weekly, Year-to-Date & Top Trends
Biotech Stocks With Best Up Trends [0-bearish to 100-bullish]: Annovis Bio[100], PureTech Health[100], Agios [100], Pieris [100], Avadel [100], Agenus [95], Mesoblast [95], Exelixis [95], Blueprint Medicines[95], BioMarin [95], AlloVir [95]
Best Biotech Stocks Year-to-Date:
Pieris [6427.47%], Precision [2590.41%], Inovio [1892.16%], Assembly [1543.7%], Adverum nologies[1253.61%], NuCana [1198.17%], Agenus [796.24%], Affimed N.V[680.8%], Corbus [488.41%], Mesoblast [465.45%], Janux [352.07%] Best Biotech Stocks This Week:
Pieris [8093.1%], Agenus [39.74%], BeyondSpring [35%], Seres [30.29%], Annovis Bio[27.4%], ProKidney [23.28%], Cullinan Oncology[20.69%], Mesoblast [19.39%], Molecular Partners[16.87%], HOOKIPA Pharma[16.17%], Longboard [13.3%] Best Biotech Stocks Daily:
Agenus [14.86%], Cullinan Oncology[13.55%], HOOKIPA Pharma[11.11%], Gritstone Oncology[10.06%], Sage [8.11%], Relay [7.46%], Annovis Bio[7.24%], BeyondSpring [6.11%], Sarepta [6.09%], Molecular Templates[5.81%], Vigil Neuroscience[5.66%]