
 Login Sign Up


| |||||
 |  | ||||

| 12Stocks.com Market Intelligence |
Best Biotech Stocks
|
|
| Quick Read: Best Biotech Stocks List By Performances & Trends: Daily, Weekly, Year-to-Date, Market Cap (Size) & Technical Trends | |||
| Best Biotech Stocks Views: Quick Browse View, Summary & Slide Show View | |||
| 12Stocks.com Biotech Stocks Performances & Trends Daily | |||||||||
|
|  The overall market intelligence score is 32 (0-bearish to 100-bullish) which puts Biotech sector in short term bearish to neutral trend. The market intelligence score from previous trading session is 10 and hence an improvement of trend.
| ||||||||
Here are the market intelligence trend scores of the most requested Biotech stocks at 12Stocks.com (click stock name for detailed review):
|


| 12Stocks.com: Investing in Biotech sector with Stocks | |
|
The following table helps investors and traders sort through current performance and trends (as measured by market intelligence score) of various
stocks in the Biotech sector. Quick View: Move mouse or cursor over stock symbol (ticker) to view short-term Technical chart and over stock name to view long term chart. Click on  to add stock symbol to your watchlist and to add stock symbol to your watchlist and  to view watchlist. Click on any ticker or stock name for detailed market intelligence report for that stock. to view watchlist. Click on any ticker or stock name for detailed market intelligence report for that stock. |
12Stocks.com Performance of Stocks in Biotech Sector
| Ticker | Stock Name | Watchlist | Category | Recent Price | Market Intelligence Score | Change % | YTD Change% |
| AMRN | Amarin |   | Biotechnology | 0.88 | 40 | 2.03% | 1.53% |
| KNSA | Kiniksa | | Biotechnology | 17.68 | 62 | 3.42% | 0.80% |
| BTAI | BioXcel | | Biotechnology | 2.97 | 69 | 4.21% | 0.68% |
| WVE | Wave Life | | Biotechnology | 5.08 | 58 | 4.96% | 0.59% |
| ITOS | iTeos | | Biotechnology | 10.99 | 61 | 1.85% | 0.46% |
| THRD | Third Harmonic | | Biotechnology | 11.04 | 51 | -5.28% | 0.18% |
| BPMC | Blueprint Medicines | | Biotechnology | 92.29 | 88 | 1.85% | 0.05% |
| SVA | Sinovac | | Biotechnology | 6.47 | 27 | 0.00% | 0.00% |
| CGEN | Compugen | | Biotechnology | 1.98 | 32 | 4.76% | 0.00% |
| XOMAO | XOMA | | Biotechnology | 24.96 | 38 | 0.00% | -0.11% |
| LYRA | Lyra | | Biotechnology | 5.21 | 58 | 0.00% | -0.19% |
| MORF | Morphic Holding | | Biotechnology | 28.75 | 42 | 0.88% | -0.45% |
| VRTX | Vertex | | Biotechnology | 404.91 | 57 | 1.25% | -0.49% |
| OVID | Ovid | | Biotechnology | 3.20 | 17 | 1.59% | -0.62% |
| PHAT | Phathom | | Biotechnology | 9.06 | 48 | 0.55% | -0.77% |
| CERE | Cerevel | | Biotechnology | 41.99 | 50 | -0.26% | -0.94% |
| RPRX | Royalty Pharma | | Biotechnology | 27.82 | 10 | -0.64% | -0.96% |
| ARGX | argenx SE | | Biotechnology | 375.08 | 42 | 1.72% | -1.41% |
| GLUE | Monte Rosa | | Biotechnology | 5.55 | 41 | 0.91% | -1.42% |
| ROIV | Roivant | | Biotechnology | 10.94 | 68 | 3.06% | -1.53% |
| CMPX | Compass | | Biotechnology | 1.51 | 46 | 1.34% | -1.63% |
| OCX | OncoCyte | | Biotechnology | 2.46 | 10 | -2.19% | -1.80% |
| LGND | Ligand | | Biotechnology | 69.89 | 10 | 1.98% | -2.14% |
| SPRO | Spero | | Biotechnology | 1.44 | 22 | 2.14% | -2.38% |
| ACLX | Arcellx | | Biotechnology | 54.43 | 25 | 4.67% | -2.46% |
| To view more stocks, click on Next / Previous arrows or select different range: 0 - 25 , 25 - 50 , 50 - 75 , 75 - 100 , 100 - 125 , 125 - 150 , 150 - 175 , 175 - 200 , 200 - 225 , 225 - 250 , 250 - 275 , 275 - 300 , 300 - 325 , 325 - 350 , 350 - 375 , 375 - 400 | ||
 | Click To Change The Sort Order: By Market Cap or Company Size Performance: Year-to-date, Week and Day |  |
|
Get the most comprehensive stock market coverage daily at 12Stocks.com ➞ Best Stocks Today ➞ Best Stocks Weekly ➞ Best Stocks Year-to-Date ➞ Best Stocks Trends ➞  Best Stocks Today 12Stocks.com Best Nasdaq Stocks ➞ Best S&P 500 Stocks ➞ Best Tech Stocks ➞ Best Biotech Stocks ➞ |
| Detailed Overview of Biotech Stocks |
| Biotech Technical Overview, Leaders & Laggards, Top Biotech ETF Funds & Detailed Biotech Stocks List, Charts, Trends & More |
| Biotech Sector: Technical Analysis, Trends & YTD Performance | |
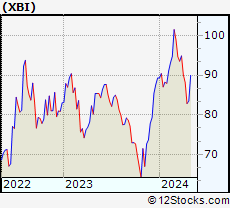
| Biotech sector, as represented by XBI, an exchange-traded fund [ETF] that holds basket of Biotech stocks (e.g, Amgen, Celgene) is down by -5.15% and is currently underperforming the overall market by -10.79% year-to-date. Below is a quick view of Technical charts and trends: | |
 XBI Weekly Chart |
|
| Long Term Trend: Not Good | |
| Medium Term Trend: Not Good | |
 XBI Daily Chart |
|
| Short Term Trend: Very Good | |
| Overall Trend Score: 32 | |
| YTD Performance: -5.15% | |
| **Trend Scores & Views Are Only For Educational Purposes And Not For Investing | |
| 12Stocks.com: Top Performing Biotech Sector Stocks | ||||||||||||||||||||||||||||||||||||||||||||||||
 The top performing Biotech sector stocks year to date are
Now, more recently, over last week, the top performing Biotech sector stocks on the move are


|
||||||||||||||||||||||||||||||||||||||||||||||||
| 12Stocks.com: Investing in Biotech Sector using Exchange Traded Funds | |
|
The following table shows list of key exchange traded funds (ETF) that
help investors track Biotech Index. For detailed view, check out our ETF Funds section of our website. Quick View: Move mouse or cursor over ETF symbol (ticker) to view short-term Technical chart and over ETF name to view long term chart. Click on ticker or stock name for detailed view. Click on to add stock symbol to your watchlist and to view watchlist. |
12Stocks.com List of ETFs that track Biotech Index
| Ticker | ETF Name | Watchlist | Recent Price | Market Intelligence Score | Change % | Week % | Year-to-date % |
| LABD | Biotech Bear 3X | | 10.07 | 55 | -6.33 | -6.76 | 3.92% |
| XBI | Biotech | | 84.69 | 32 | 2.28 | 2.25 | -5.15% |
| LABU | Biotech Bull 3X | | 91.98 | 32 | 6.42 | 6.89 | -24.59% |
| IBB | Biotechnology | | 128.02 | 32 | 1.51 | 2.65 | -5.76% |
| PBE | Biotech & Genome | | 61.14 | 39 | 0.82 | 2.16 | -7.14% |
| IXJ | Global Healthcare | | 89.62 | 65 | 1.37 | 2.13 | 3.34% |
| IYH | Healthcare | | 59.21 | 52 | 1.33 | 1.81 | 3.43% |
| IHF | Healthcare Providers | | 52.32 | 70 | 0.47 | 0.21 | -0.36% |
| CURE | Healthcare Bull 3X | | 108.12 | 39 | 3.52 | 4.64 | 6.27% |
| BIB | Biotechnology | | 50.33 | 39 | 2.51 | 4.42 | -11.78% |
| FBT | First NYSE | | 145.32 | 32 | 1.68 | 2.57 | -8.05% |
| BBH | Biotech | | 157.29 | 49 | 1.77 | 3.24 | -4.85% |
| BIS | Short Biotech | | 19.94 | 68 | -2.59 | -4.57 | 10.35% |
| PTH | DWA Healthcare Momentum | | 40.17 | 68 | 2.11 | 1.62 | 2.63% |
| BBP | Bio Biotechnology Products | | 52.39 | 42 | 1.87 | 3.89 | -9.81% |
| BTEC | Principal Healthcare Innovators | | 34.81 | 32 | 3.10 | 2.79 | -4.2% |
| BBC | Bio Biotechnology Clinical | | 25.67 | 51 | 3.26 | 3.89 | 4.98% |
| 12Stocks.com: Charts, Trends, Fundamental Data and Performances of Biotech Stocks | |
|
We now take in-depth look at all Biotech stocks including charts, multi-period performances and overall trends (as measured by market intelligence score). One can sort Biotech stocks (click link to choose) by Daily, Weekly and by Year-to-Date performances. Also, one can sort by size of the company or by market capitalization. |
| Select Your Default Chart Type: | |||||
| |||||
| Click on stock symbol or name for detailed view. Click on to add stock symbol to your watchlist and to view watchlist. Quick View: Move mouse or cursor over "Daily" to quickly view daily Technical stock chart and over "Weekly" to view weekly Technical stock chart. | |||||

 | AMRN Amarin Corporation plc |
| Sector: Health Care | |
| SubSector: Biotechnology | |
| MarketCap: 4197.45 Millions | |
| Recent Price: 0.88 Market Intelligence Score: 40 | |
| Day Percent Change: 2.03% Day Change: 0.02 | |
| Week Change: 2.79% Year-to-date Change: 1.5% | |
| AMRN Links: Profile News Message Board | |
| Charts:- Daily , Weekly | |
| Add AMRN to Watchlist: View: Get Complete AMRN Trend Analysis ➞ | |
 | KNSA Kiniksa Pharmaceuticals, Ltd. |
| Sector: Health Care | |
| SubSector: Biotechnology | |
| MarketCap: 780.285 Millions | |
| Recent Price: 17.68 Market Intelligence Score: 62 | |
| Day Percent Change: 3.42% Day Change: 0.59 | |
| Week Change: 4.43% Year-to-date Change: 0.8% | |
| KNSA Links: Profile News Message Board | |
| Charts:- Daily , Weekly | |
| Add KNSA to Watchlist: View: Get Complete KNSA Trend Analysis ➞ | |
 | BTAI BioXcel Therapeutics, Inc. |
| Sector: Health Care | |
| SubSector: Biotechnology | |
| MarketCap: 487.485 Millions | |
| Recent Price: 2.97 Market Intelligence Score: 69 | |
| Day Percent Change: 4.21% Day Change: 0.12 | |
| Week Change: 7.22% Year-to-date Change: 0.7% | |
| BTAI Links: Profile News Message Board | |
| Charts:- Daily , Weekly | |
| Add BTAI to Watchlist: View: Get Complete BTAI Trend Analysis ➞ | |
 | WVE Wave Life Sciences Ltd. |
| Sector: Health Care | |
| SubSector: Biotechnology | |
| MarketCap: 452.785 Millions | |
| Recent Price: 5.08 Market Intelligence Score: 58 | |
| Day Percent Change: 4.96% Day Change: 0.24 | |
| Week Change: 4.31% Year-to-date Change: 0.6% | |
| WVE Links: Profile News Message Board | |
| Charts:- Daily , Weekly | |
| Add WVE to Watchlist: View: Get Complete WVE Trend Analysis ➞ | |
 | ITOS iTeos Therapeutics, Inc. |
| Sector: Health Care | |
| SubSector: Biotechnology | |
| MarketCap: 10487 Millions | |
| Recent Price: 10.99 Market Intelligence Score: 61 | |
| Day Percent Change: 1.85% Day Change: 0.20 | |
| Week Change: 7.27% Year-to-date Change: 0.5% | |
| ITOS Links: Profile News Message Board | |
| Charts:- Daily , Weekly | |
| Add ITOS to Watchlist: View: Get Complete ITOS Trend Analysis ➞ | |
 | THRD Third Harmonic Bio, Inc. |
| Sector: Health Care | |
| SubSector: Biotechnology | |
| MarketCap: 190 Millions | |
| Recent Price: 11.04 Market Intelligence Score: 51 | |
| Day Percent Change: -5.28% Day Change: -0.62 | |
| Week Change: -5.52% Year-to-date Change: 0.2% | |
| THRD Links: Profile News Message Board | |
| Charts:- Daily , Weekly | |
| Add THRD to Watchlist: View: Get Complete THRD Trend Analysis ➞ | |
 | BPMC Blueprint Medicines Corporation |
| Sector: Health Care | |
| SubSector: Biotechnology | |
| MarketCap: 3113.55 Millions | |
| Recent Price: 92.29 Market Intelligence Score: 88 | |
| Day Percent Change: 1.85% Day Change: 1.68 | |
| Week Change: 6.26% Year-to-date Change: 0.1% | |
| BPMC Links: Profile News Message Board | |
| Charts:- Daily , Weekly | |
| Add BPMC to Watchlist: View: Get Complete BPMC Trend Analysis ➞ | |
 | SVA Sinovac Biotech Ltd. |
| Sector: Health Care | |
| SubSector: Biotechnology | |
| MarketCap: 336.88 Millions | |
| Recent Price: 6.47 Market Intelligence Score: 27 | |
| Day Percent Change: 0.00% Day Change: 0.00 | |
| Week Change: 0% Year-to-date Change: 0.0% | |
| SVA Links: Profile News Message Board | |
| Charts:- Daily , Weekly | |
| Add SVA to Watchlist: View: Get Complete SVA Trend Analysis ➞ | |
 | CGEN Compugen Ltd. |
| Sector: Health Care | |
| SubSector: Biotechnology | |
| MarketCap: 634.285 Millions | |
| Recent Price: 1.98 Market Intelligence Score: 32 | |
| Day Percent Change: 4.76% Day Change: 0.09 | |
| Week Change: 4.21% Year-to-date Change: 0.0% | |
| CGEN Links: Profile News Message Board | |
| Charts:- Daily , Weekly | |
| Add CGEN to Watchlist: View: Get Complete CGEN Trend Analysis ➞ | |
 | XOMAO XOMA Corporation |
| Sector: Health Care | |
| SubSector: Biotechnology | |
| MarketCap: 217 Millions | |
| Recent Price: 24.96 Market Intelligence Score: 38 | |
| Day Percent Change: 0.00% Day Change: 0.00 | |
| Week Change: -0.51% Year-to-date Change: -0.1% | |
| XOMAO Links: Profile News Message Board | |
| Charts:- Daily , Weekly | |
| Add XOMAO to Watchlist: View: Get Complete XOMAO Trend Analysis ➞ | |
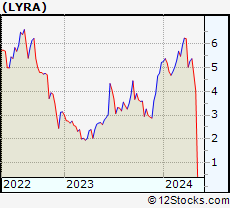 | LYRA Lyra Therapeutics, Inc. |
| Sector: Health Care | |
| SubSector: Biotechnology | |
| MarketCap: 12487 Millions | |
| Recent Price: 5.21 Market Intelligence Score: 58 | |
| Day Percent Change: 0.00% Day Change: 0.00 | |
| Week Change: -3.07% Year-to-date Change: -0.2% | |
| LYRA Links: Profile News Message Board | |
| Charts:- Daily , Weekly | |
| Add LYRA to Watchlist: View: Get Complete LYRA Trend Analysis ➞ | |
 | MORF Morphic Holding, Inc. |
| Sector: Health Care | |
| SubSector: Biotechnology | |
| MarketCap: 484.885 Millions | |
| Recent Price: 28.75 Market Intelligence Score: 42 | |
| Day Percent Change: 0.88% Day Change: 0.25 | |
| Week Change: 2.68% Year-to-date Change: -0.5% | |
| MORF Links: Profile News Message Board | |
| Charts:- Daily , Weekly | |
| Add MORF to Watchlist: View: Get Complete MORF Trend Analysis ➞ | |
 | VRTX Vertex Pharmaceuticals Incorporated |
| Sector: Health Care | |
| SubSector: Biotechnology | |
| MarketCap: 57669.6 Millions | |
| Recent Price: 404.91 Market Intelligence Score: 57 | |
| Day Percent Change: 1.25% Day Change: 4.99 | |
| Week Change: 2.7% Year-to-date Change: -0.5% | |
| VRTX Links: Profile News Message Board | |
| Charts:- Daily , Weekly | |
| Add VRTX to Watchlist: View: Get Complete VRTX Trend Analysis ➞ | |
 | OVID Ovid Therapeutics Inc. |
| Sector: Health Care | |
| SubSector: Biotechnology | |
| MarketCap: 130.385 Millions | |
| Recent Price: 3.20 Market Intelligence Score: 17 | |
| Day Percent Change: 1.59% Day Change: 0.05 | |
| Week Change: -1.39% Year-to-date Change: -0.6% | |
| OVID Links: Profile News Message Board | |
| Charts:- Daily , Weekly | |
| Add OVID to Watchlist: View: Get Complete OVID Trend Analysis ➞ | |
 | PHAT Phathom Pharmaceuticals, Inc. |
| Sector: Health Care | |
| SubSector: Biotechnology | |
| MarketCap: 728.785 Millions | |
| Recent Price: 9.06 Market Intelligence Score: 48 | |
| Day Percent Change: 0.55% Day Change: 0.05 | |
| Week Change: 0.89% Year-to-date Change: -0.8% | |
| PHAT Links: Profile News Message Board | |
| Charts:- Daily , Weekly | |
| Add PHAT to Watchlist: View: Get Complete PHAT Trend Analysis ➞ | |
 | CERE Cerevel Therapeutics Holdings, Inc. |
| Sector: Health Care | |
| SubSector: Biotechnology | |
| MarketCap: 21587 Millions | |
| Recent Price: 41.99 Market Intelligence Score: 50 | |
| Day Percent Change: -0.26% Day Change: -0.11 | |
| Week Change: -0.39% Year-to-date Change: -0.9% | |
| CERE Links: Profile News Message Board | |
| Charts:- Daily , Weekly | |
| Add CERE to Watchlist: View: Get Complete CERE Trend Analysis ➞ | |
 | RPRX Royalty Pharma plc |
| Sector: Health Care | |
| SubSector: Biotechnology | |
| MarketCap: 28457 Millions | |
| Recent Price: 27.82 Market Intelligence Score: 10 | |
| Day Percent Change: -0.64% Day Change: -0.18 | |
| Week Change: -1.21% Year-to-date Change: -1.0% | |
| RPRX Links: Profile News Message Board | |
| Charts:- Daily , Weekly | |
| Add RPRX to Watchlist: View: Get Complete RPRX Trend Analysis ➞ | |
 | ARGX argenx SE |
| Sector: Health Care | |
| SubSector: Biotechnology | |
| MarketCap: 5077.05 Millions | |
| Recent Price: 375.08 Market Intelligence Score: 42 | |
| Day Percent Change: 1.72% Day Change: 6.33 | |
| Week Change: 4.16% Year-to-date Change: -1.4% | |
| ARGX Links: Profile News Message Board | |
| Charts:- Daily , Weekly | |
| Add ARGX to Watchlist: View: Get Complete ARGX Trend Analysis ➞ | |
 | GLUE Monte Rosa Therapeutics, Inc. |
| Sector: Health Care | |
| SubSector: Biotechnology | |
| MarketCap: 346 Millions | |
| Recent Price: 5.55 Market Intelligence Score: 41 | |
| Day Percent Change: 0.91% Day Change: 0.05 | |
| Week Change: -5.13% Year-to-date Change: -1.4% | |
| GLUE Links: Profile News Message Board | |
| Charts:- Daily , Weekly | |
| Add GLUE to Watchlist: View: Get Complete GLUE Trend Analysis ➞ | |
 | ROIV Roivant Sciences Ltd. |
| Sector: Health Care | |
| SubSector: Biotechnology | |
| MarketCap: 7780 Millions | |
| Recent Price: 10.94 Market Intelligence Score: 68 | |
| Day Percent Change: 3.06% Day Change: 0.33 | |
| Week Change: 4.54% Year-to-date Change: -1.5% | |
| ROIV Links: Profile News Message Board | |
| Charts:- Daily , Weekly | |
| Add ROIV to Watchlist: View: Get Complete ROIV Trend Analysis ➞ | |
 | CMPX Compass Therapeutics, Inc. |
| Sector: Health Care | |
| SubSector: Biotechnology | |
| MarketCap: 406 Millions | |
| Recent Price: 1.51 Market Intelligence Score: 46 | |
| Day Percent Change: 1.34% Day Change: 0.02 | |
| Week Change: 2.72% Year-to-date Change: -1.6% | |
| CMPX Links: Profile News Message Board | |
| Charts:- Daily , Weekly | |
| Add CMPX to Watchlist: View: Get Complete CMPX Trend Analysis ➞ | |
 | OCX OncoCyte Corporation |
| Sector: Health Care | |
| SubSector: Biotechnology | |
| MarketCap: 131.485 Millions | |
| Recent Price: 2.46 Market Intelligence Score: 10 | |
| Day Percent Change: -2.19% Day Change: -0.05 | |
| Week Change: -1.6% Year-to-date Change: -1.8% | |
| OCX Links: Profile News Message Board | |
| Charts:- Daily , Weekly | |
| Add OCX to Watchlist: View: Get Complete OCX Trend Analysis ➞ | |
 | LGND Ligand Pharmaceuticals Incorporated |
| Sector: Health Care | |
| SubSector: Biotechnology | |
| MarketCap: 1344.45 Millions | |
| Recent Price: 69.89 Market Intelligence Score: 10 | |
| Day Percent Change: 1.98% Day Change: 1.36 | |
| Week Change: -3.56% Year-to-date Change: -2.1% | |
| LGND Links: Profile News Message Board | |
| Charts:- Daily , Weekly | |
| Add LGND to Watchlist: View: Get Complete LGND Trend Analysis ➞ | |
 | SPRO Spero Therapeutics, Inc. |
| Sector: Health Care | |
| SubSector: Biotechnology | |
| MarketCap: 121.085 Millions | |
| Recent Price: 1.44 Market Intelligence Score: 22 | |
| Day Percent Change: 2.14% Day Change: 0.03 | |
| Week Change: 1.77% Year-to-date Change: -2.4% | |
| SPRO Links: Profile News Message Board | |
| Charts:- Daily , Weekly | |
| Add SPRO to Watchlist: View: Get Complete SPRO Trend Analysis ➞ | |
 | ACLX Arcellx, Inc. |
| Sector: Health Care | |
| SubSector: Biotechnology | |
| MarketCap: 1530 Millions | |
| Recent Price: 54.43 Market Intelligence Score: 25 | |
| Day Percent Change: 4.67% Day Change: 2.43 | |
| Week Change: 5.38% Year-to-date Change: -2.5% | |
| ACLX Links: Profile News Message Board | |
| Charts:- Daily , Weekly | |
| Add ACLX to Watchlist: View: Get Complete ACLX Trend Analysis ➞ | |
| To view more stocks, click on Next / Previous arrows or select different range: 0 - 25 , 25 - 50 , 50 - 75 , 75 - 100 , 100 - 125 , 125 - 150 , 150 - 175 , 175 - 200 , 200 - 225 , 225 - 250 , 250 - 275 , 275 - 300 , 300 - 325 , 325 - 350 , 350 - 375 , 375 - 400 | ||
| Click To Change The Sort Order: By Market Cap or Company Size Performance: Year-to-date, Week and Day | |
| Select Chart Type: | ||
|
Best Stocks Today 12Stocks.com |
© 2024 12Stocks.com Terms & Conditions Privacy Contact Us
All Information Provided Only For Education And Not To Be Used For Investing or Trading. See Terms & Conditions


One More Thing ... Get Best Stocks Delivered Daily!
Never Ever Miss A Move With Our Top Ten Stocks Lists
Find Best Stocks In Any Market - Bull or Bear Market
Take A Peek At Our Top Ten Stocks Lists: Daily, Weekly, Year-to-Date & Top Trends
Find Best Stocks In Any Market - Bull or Bear Market
Take A Peek At Our Top Ten Stocks Lists: Daily, Weekly, Year-to-Date & Top Trends
Biotech Stocks With Best Up Trends [0-bearish to 100-bullish]: Pieris [100], PureTech Health[100], Day One[100], Agios [100], Avadel [100], PMV [100], Annovis Bio[100], BioMarin [100], Mesoblast [95], Nektar [95], Moderna [95]
Best Biotech Stocks Year-to-Date:
Pieris [6493.41%], Precision [2702.74%], Inovio [1933.33%], Assembly [1518.1%], Adverum nologies[1361.21%], NuCana [1252.27%], Affimed N.V[756%], Agenus [680.29%], Corbus [524.83%], Mesoblast [445.45%], Janux [364.03%] Best Biotech Stocks This Week:
Pieris [8175.86%], Seres [35.74%], BeyondSpring [27.22%], ProKidney [24.75%], Agenus [21.66%], Annovis Bio[18.8%], Generation Bio[17.69%], Molecular Partners[16.87%], Adaptimmune [16.72%], Longboard [16.23%], Mesoblast [15.16%] Best Biotech Stocks Daily:
Pieris [8113.55%], Seres [21.68%], Generation Bio[16.01%], ChromaDex [14.86%], IGM [14.07%], Adaptimmune [12.87%], Agenus [11.96%], Galectin [10.64%], PureTech Health[10.55%], Personalis [9.52%], Esperion [9.42%]